Business Analytics Report: Strategic Insights for Wimpy Restaurant
VerifiedAdded on 2023/06/14
|19
|4041
|296
Report
AI Summary
This report presents a business analytics case study of Wimpy Restaurant, founded in 1934, focusing on addressing challenges in a competitive market through quantitative data analysis. The study uses a questionnaire targeted at Wimpy's customer base to gather psychographic data related to consumer behavior and preferences. Descriptive statistics are provided for various factors including household composition (children and adults), geographic region, education level, employment status, income, and fast food consumption habits. The analysis of this data aims to inform strategic decision-making and improve Wimpy Restaurant's operational efficiency and customer satisfaction, with the goal of enhancing its brand image and competitive positioning. Desklib provides access to similar solved assignments and case studies for students.

Business Analytics
Paraphrase This Document
Need a fresh take? Get an instant paraphrase of this document with our AI Paraphraser
Table of Contents
Introduction......................................................................................................................................3
Background of case study.......................................................................................................3
Respondents of the questionnaire...........................................................................................4
Descriptive stats......................................................................................................................4
Recommendations................................................................................................................12
Conclusion.....................................................................................................................................14
References......................................................................................................................................15
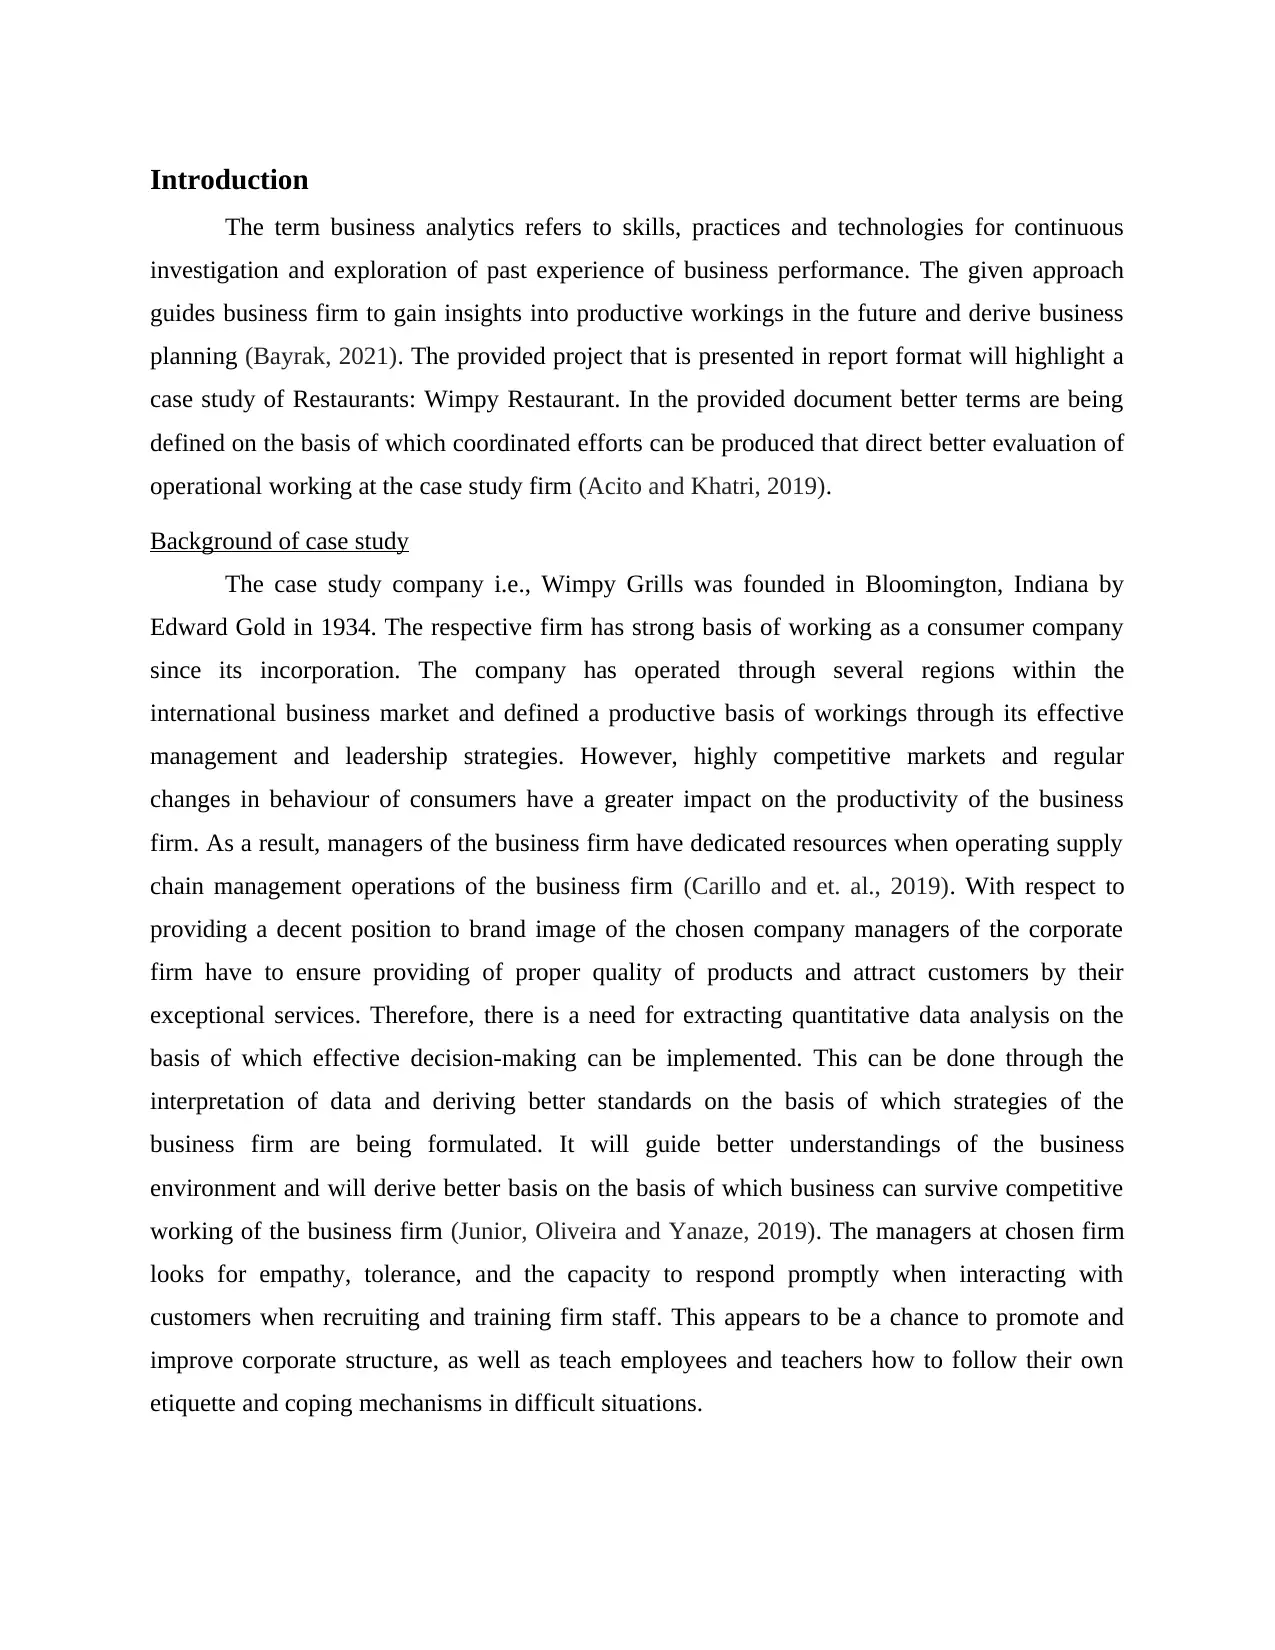
Introduction
The term business analytics refers to skills, practices and technologies for continuous
investigation and exploration of past experience of business performance. The given approach
guides business firm to gain insights into productive workings in the future and derive business
planning (Bayrak, 2021). The provided project that is presented in report format will highlight a
case study of Restaurants: Wimpy Restaurant. In the provided document better terms are being
defined on the basis of which coordinated efforts can be produced that direct better evaluation of
operational working at the case study firm (Acito and Khatri, 2019).
Background of case study
The case study company i.e., Wimpy Grills was founded in Bloomington, Indiana by
Edward Gold in 1934. The respective firm has strong basis of working as a consumer company
since its incorporation. The company has operated through several regions within the
international business market and defined a productive basis of workings through its effective
management and leadership strategies. However, highly competitive markets and regular
changes in behaviour of consumers have a greater impact on the productivity of the business
firm. As a result, managers of the business firm have dedicated resources when operating supply
chain management operations of the business firm (Carillo and et. al., 2019). With respect to
providing a decent position to brand image of the chosen company managers of the corporate
firm have to ensure providing of proper quality of products and attract customers by their
exceptional services. Therefore, there is a need for extracting quantitative data analysis on the
basis of which effective decision-making can be implemented. This can be done through the
interpretation of data and deriving better standards on the basis of which strategies of the
business firm are being formulated. It will guide better understandings of the business
environment and will derive better basis on the basis of which business can survive competitive
working of the business firm (Junior, Oliveira and Yanaze, 2019). The managers at chosen firm
looks for empathy, tolerance, and the capacity to respond promptly when interacting with
customers when recruiting and training firm staff. This appears to be a chance to promote and
improve corporate structure, as well as teach employees and teachers how to follow their own
etiquette and coping mechanisms in difficult situations.
⊘ This is a preview!⊘
Do you want full access?
Subscribe today to unlock all pages.
Trusted by 1+ million students worldwide
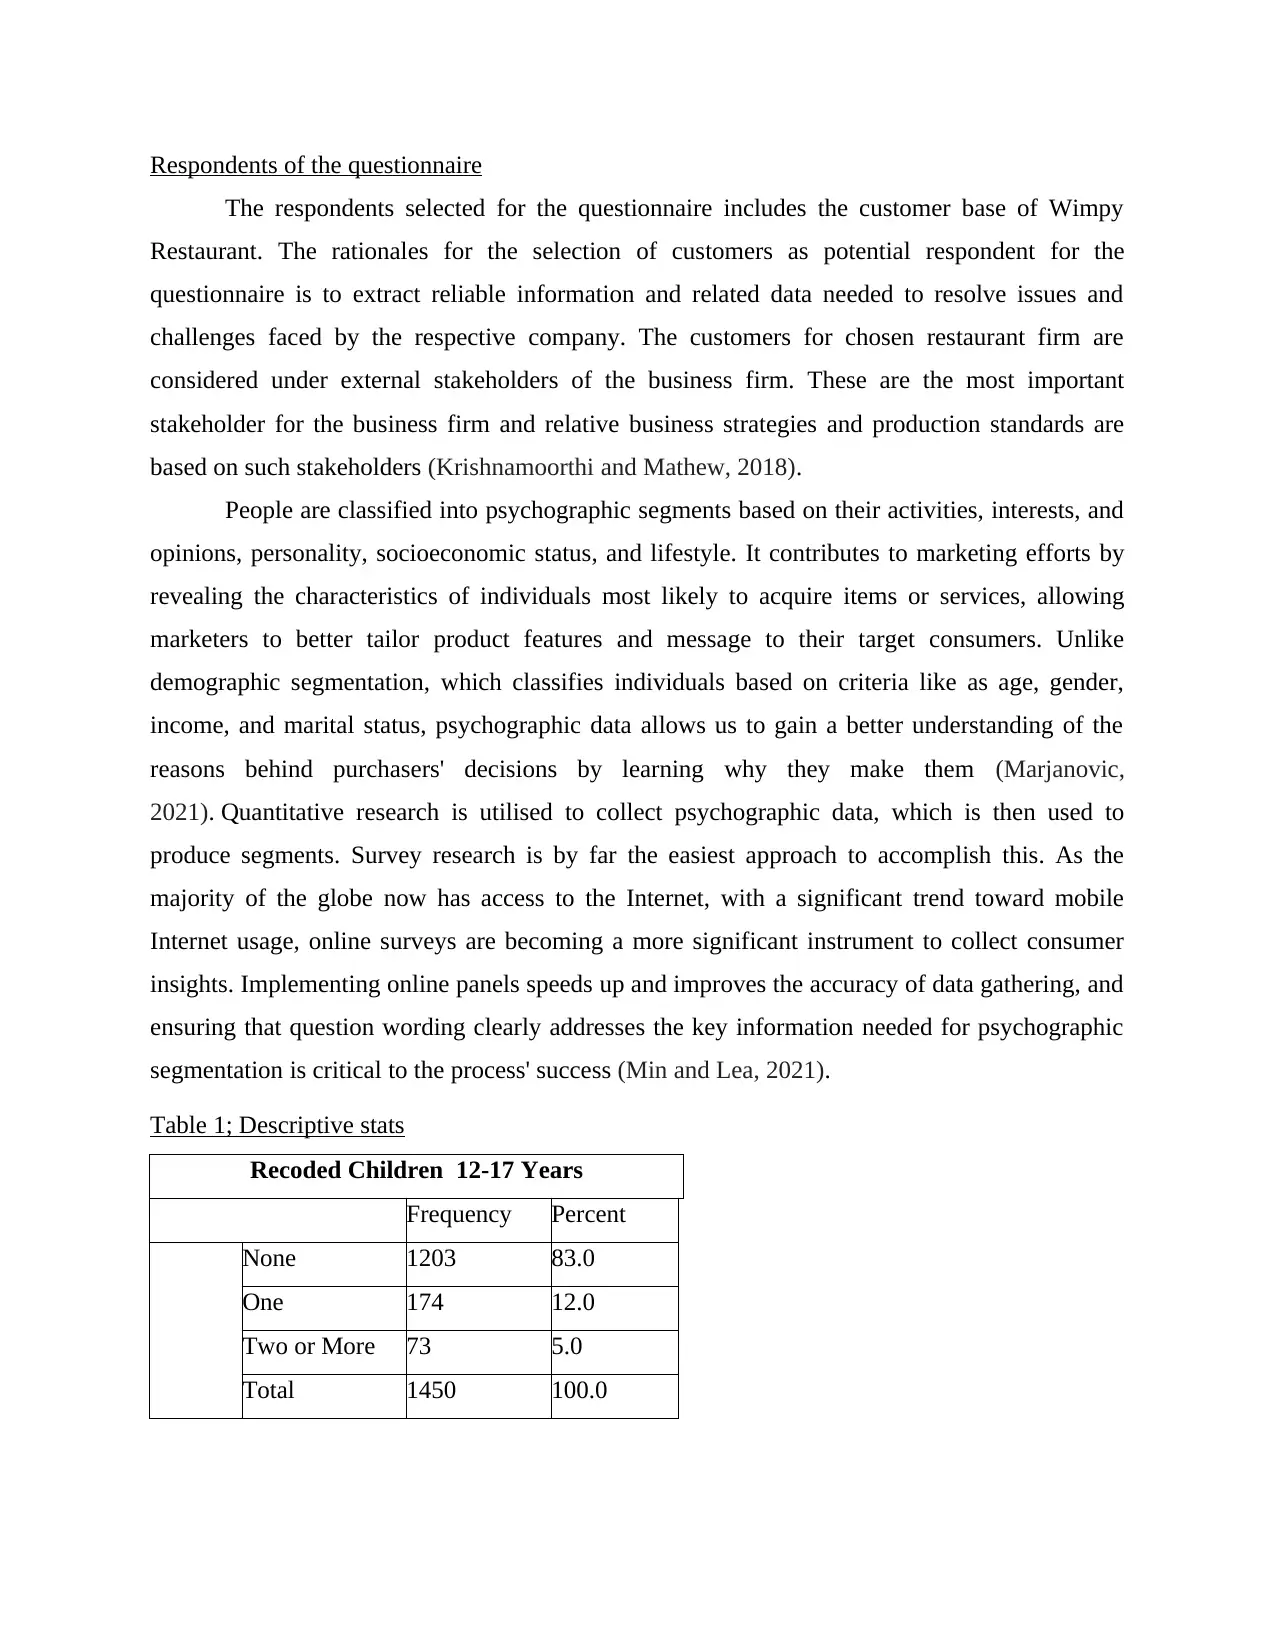
Respondents of the questionnaire
The respondents selected for the questionnaire includes the customer base of Wimpy
Restaurant. The rationales for the selection of customers as potential respondent for the
questionnaire is to extract reliable information and related data needed to resolve issues and
challenges faced by the respective company. The customers for chosen restaurant firm are
considered under external stakeholders of the business firm. These are the most important
stakeholder for the business firm and relative business strategies and production standards are
based on such stakeholders (Krishnamoorthi and Mathew, 2018).
People are classified into psychographic segments based on their activities, interests, and
opinions, personality, socioeconomic status, and lifestyle. It contributes to marketing efforts by
revealing the characteristics of individuals most likely to acquire items or services, allowing
marketers to better tailor product features and message to their target consumers. Unlike
demographic segmentation, which classifies individuals based on criteria like as age, gender,
income, and marital status, psychographic data allows us to gain a better understanding of the
reasons behind purchasers' decisions by learning why they make them (Marjanovic,
2021). Quantitative research is utilised to collect psychographic data, which is then used to
produce segments. Survey research is by far the easiest approach to accomplish this. As the
majority of the globe now has access to the Internet, with a significant trend toward mobile
Internet usage, online surveys are becoming a more significant instrument to collect consumer
insights. Implementing online panels speeds up and improves the accuracy of data gathering, and
ensuring that question wording clearly addresses the key information needed for psychographic
segmentation is critical to the process' success (Min and Lea, 2021).
Table 1; Descriptive stats
Recoded Children 12-17 Years
Frequency Percent
None 1203 83.0
One 174 12.0
Two or More 73 5.0
Total 1450 100.0
Paraphrase This Document
Need a fresh take? Get an instant paraphrase of this document with our AI Paraphraser
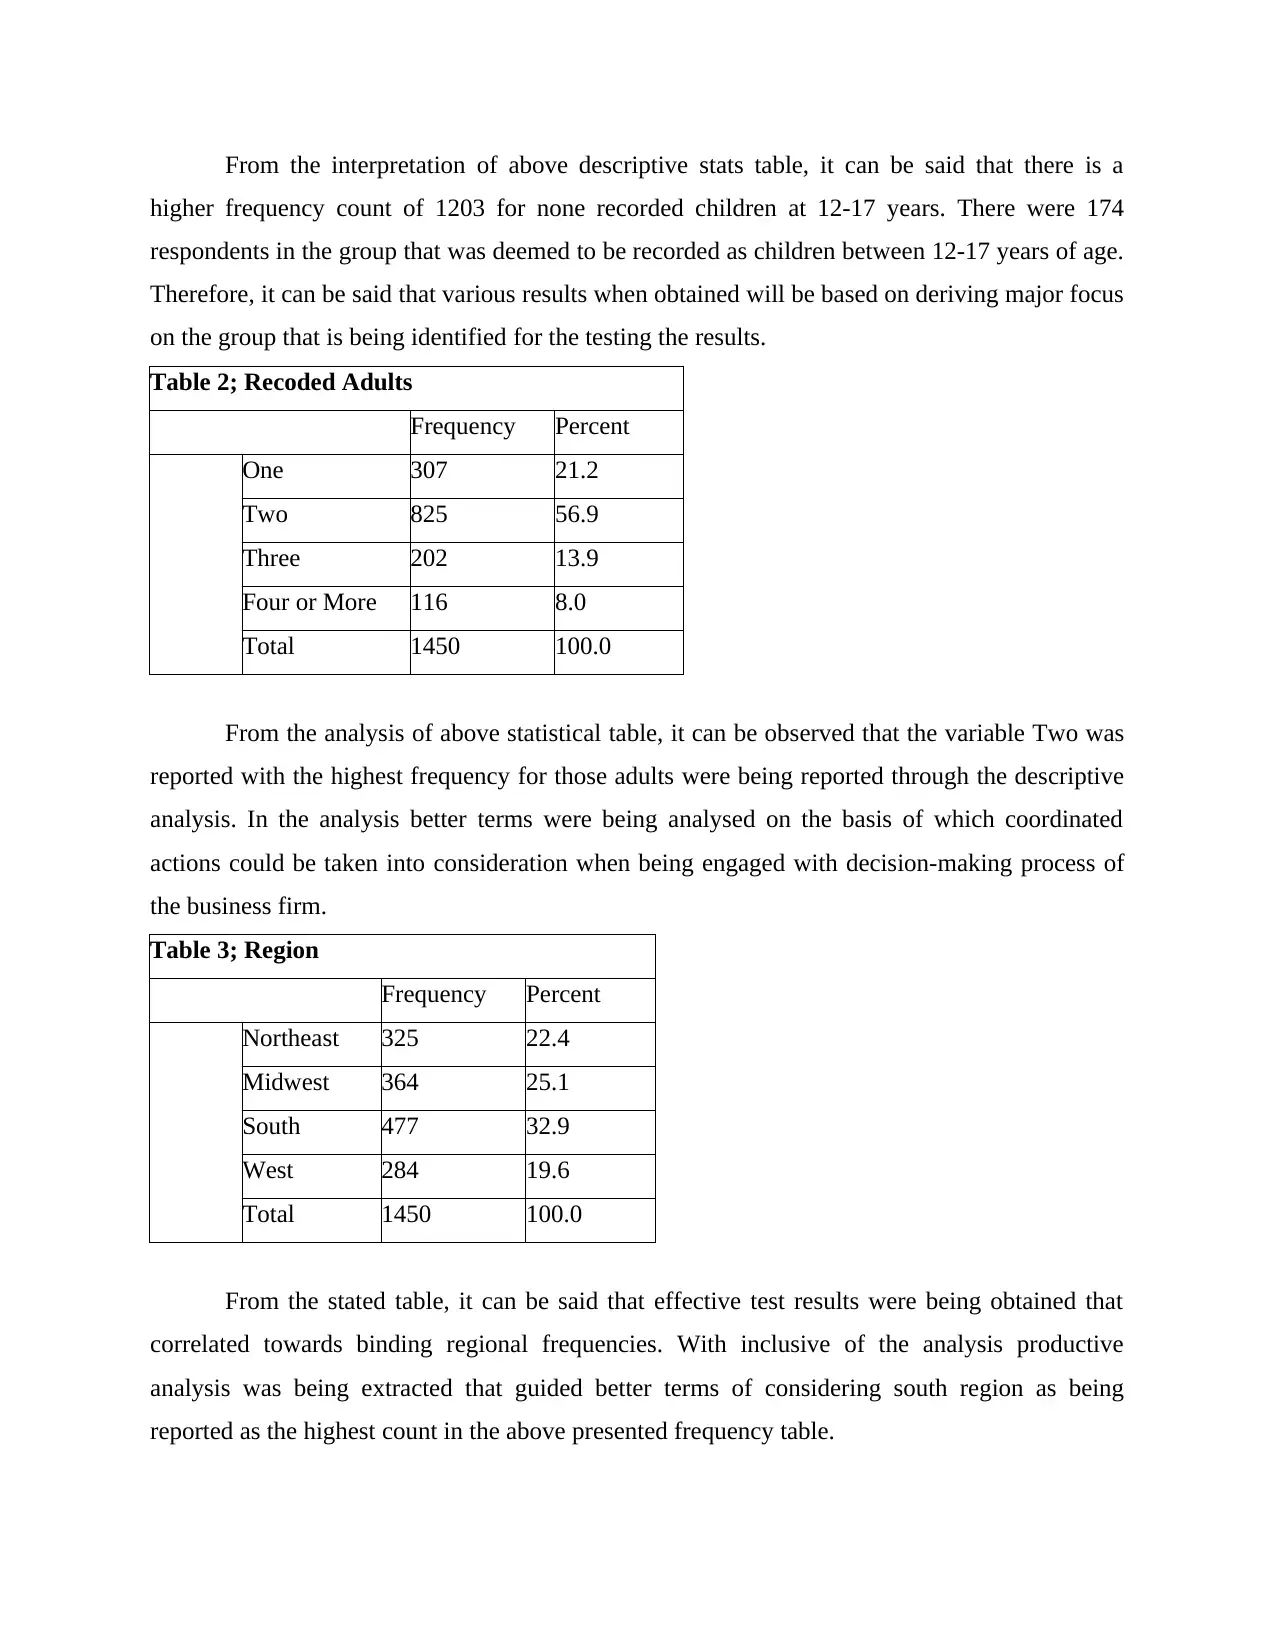
From the interpretation of above descriptive stats table, it can be said that there is a
higher frequency count of 1203 for none recorded children at 12-17 years. There were 174
respondents in the group that was deemed to be recorded as children between 12-17 years of age.
Therefore, it can be said that various results when obtained will be based on deriving major focus
on the group that is being identified for the testing the results.
Table 2; Recoded Adults
Frequency Percent
One 307 21.2
Two 825 56.9
Three 202 13.9
Four or More 116 8.0
Total 1450 100.0
From the analysis of above statistical table, it can be observed that the variable Two was
reported with the highest frequency for those adults were being reported through the descriptive
analysis. In the analysis better terms were being analysed on the basis of which coordinated
actions could be taken into consideration when being engaged with decision-making process of
the business firm.
Table 3; Region
Frequency Percent
Northeast 325 22.4
Midwest 364 25.1
South 477 32.9
West 284 19.6
Total 1450 100.0
From the stated table, it can be said that effective test results were being obtained that
correlated towards binding regional frequencies. With inclusive of the analysis productive
analysis was being extracted that guided better terms of considering south region as being
reported as the highest count in the above presented frequency table.
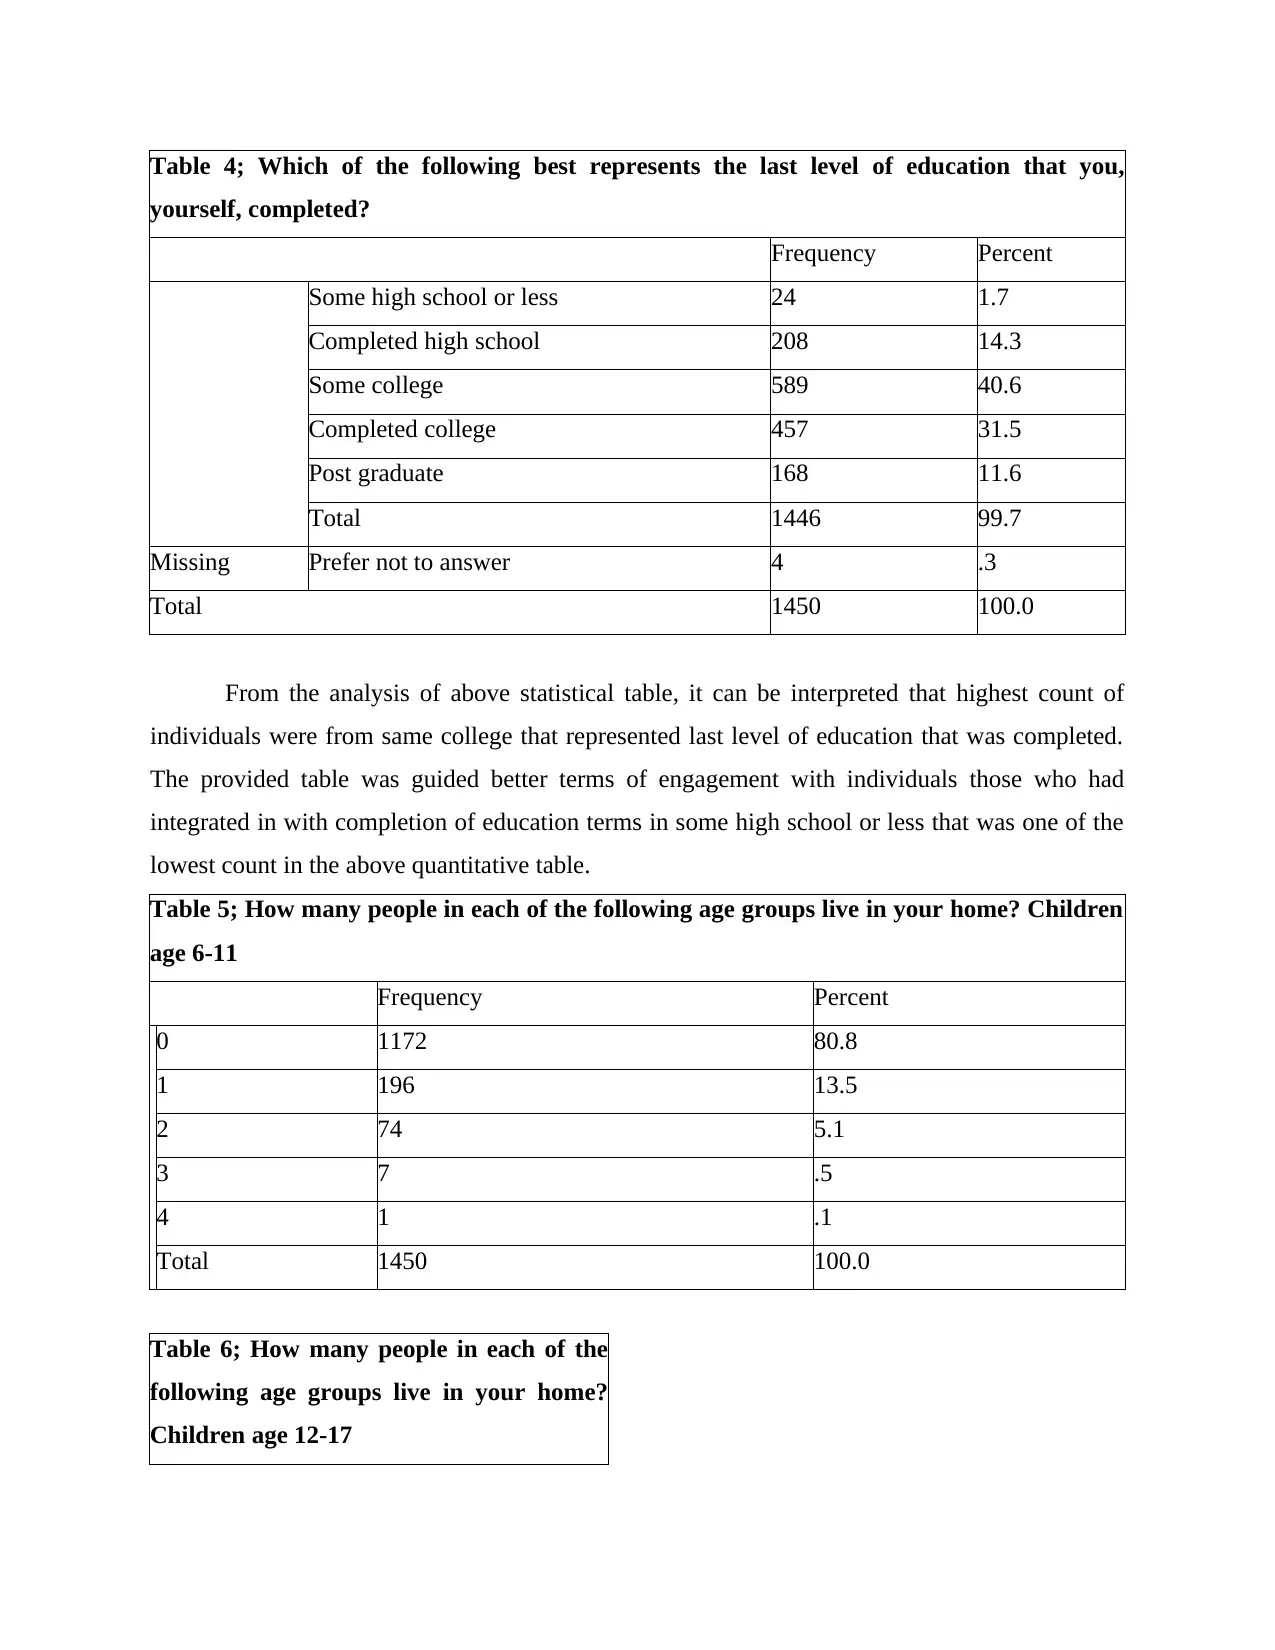
Table 4; Which of the following best represents the last level of education that you,
yourself, completed?
Frequency Percent
Some high school or less 24 1.7
Completed high school 208 14.3
Some college 589 40.6
Completed college 457 31.5
Post graduate 168 11.6
Total 1446 99.7
Missing Prefer not to answer 4 .3
Total 1450 100.0
From the analysis of above statistical table, it can be interpreted that highest count of
individuals were from same college that represented last level of education that was completed.
The provided table was guided better terms of engagement with individuals those who had
integrated in with completion of education terms in some high school or less that was one of the
lowest count in the above quantitative table.
Table 5; How many people in each of the following age groups live in your home? Children
age 6-11
Frequency Percent
0 1172 80.8
1 196 13.5
2 74 5.1
3 7 .5
4 1 .1
Total 1450 100.0
Table 6; How many people in each of the
following age groups live in your home?
Children age 12-17
⊘ This is a preview!⊘
Do you want full access?
Subscribe today to unlock all pages.
Trusted by 1+ million students worldwide
Frequency Percent
0 1203 83.0
1 174 12.0
2 65 4.5
3 7 .5
4 1 .1
Total 1450 100.0
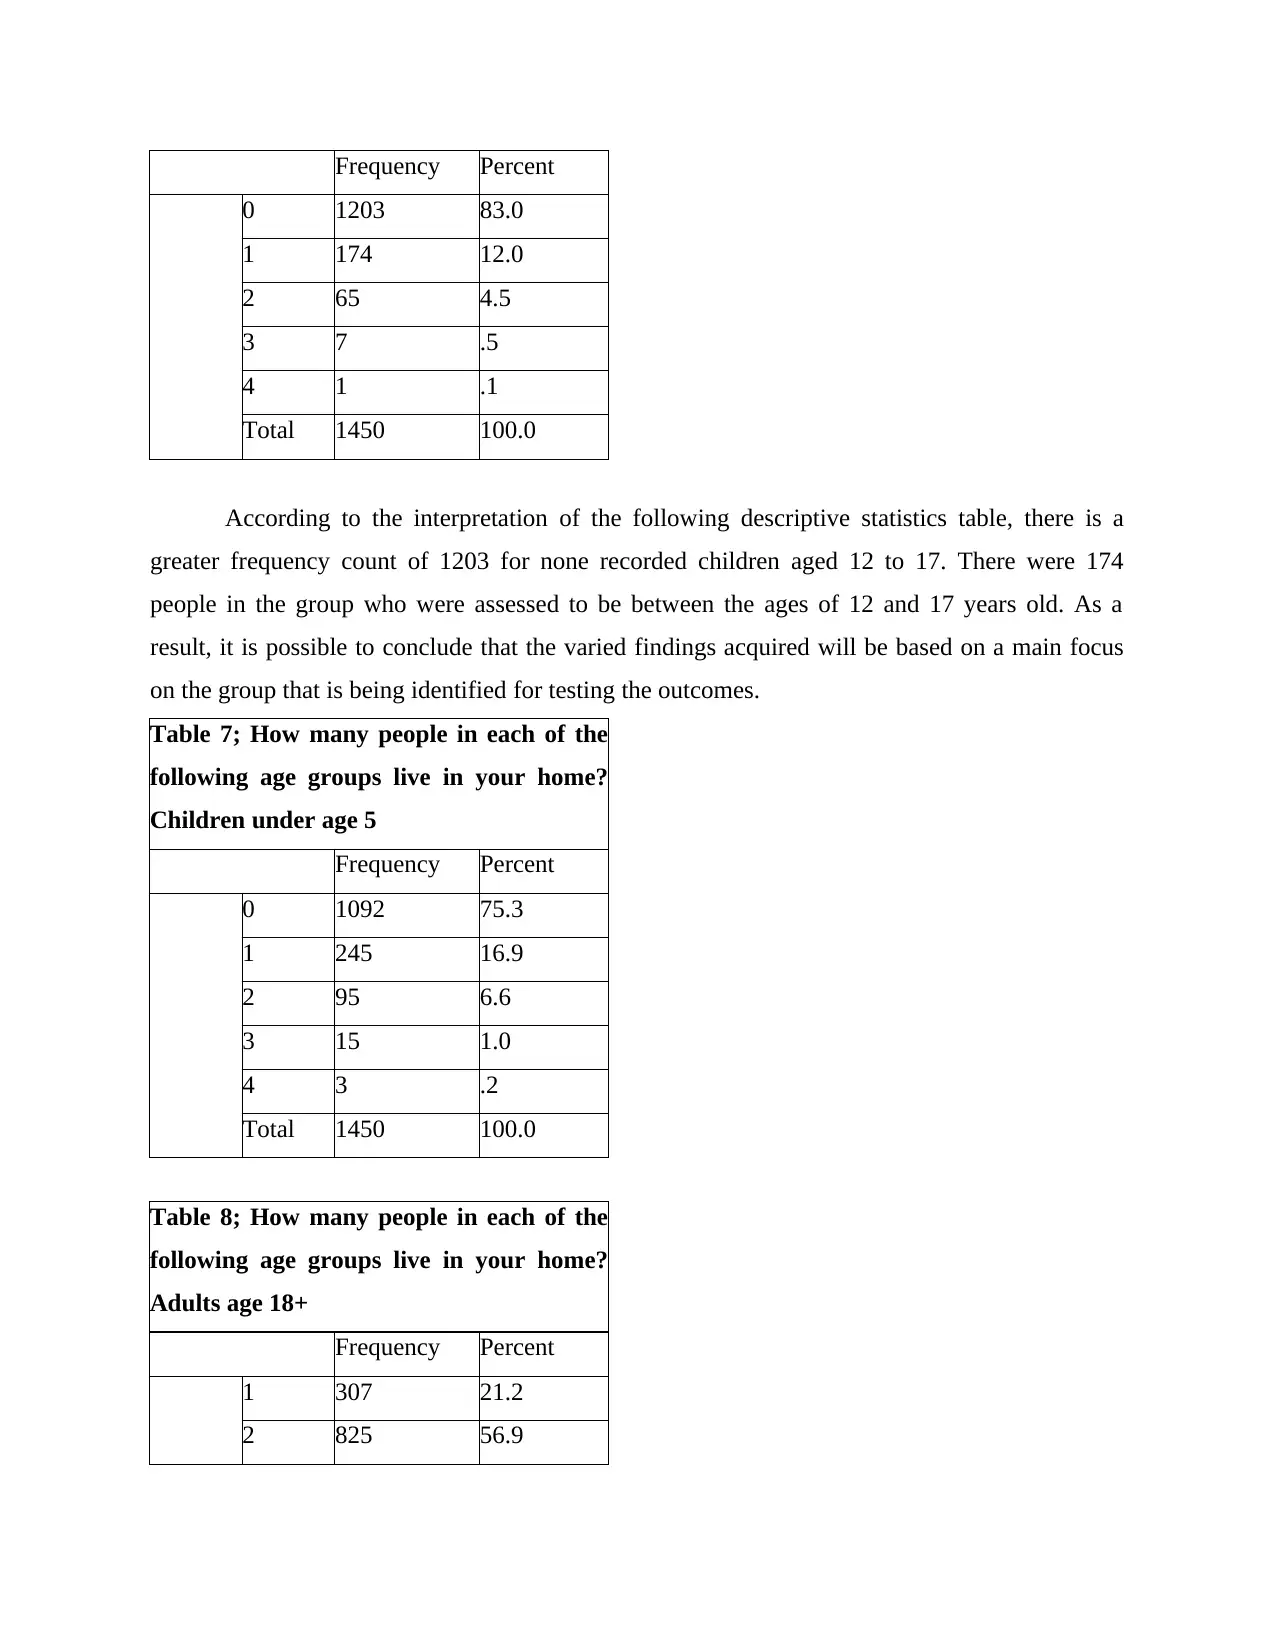
According to the interpretation of the following descriptive statistics table, there is a
greater frequency count of 1203 for none recorded children aged 12 to 17. There were 174
people in the group who were assessed to be between the ages of 12 and 17 years old. As a
result, it is possible to conclude that the varied findings acquired will be based on a main focus
on the group that is being identified for testing the outcomes.
Table 7; How many people in each of the
following age groups live in your home?
Children under age 5
Frequency Percent
0 1092 75.3
1 245 16.9
2 95 6.6
3 15 1.0
4 3 .2
Total 1450 100.0
Table 8; How many people in each of the
following age groups live in your home?
Adults age 18+
Frequency Percent
1 307 21.2
2 825 56.9
0 1203 83.0
1 174 12.0
2 65 4.5
3 7 .5
4 1 .1
Total 1450 100.0
According to the interpretation of the following descriptive statistics table, there is a
greater frequency count of 1203 for none recorded children aged 12 to 17. There were 174
people in the group who were assessed to be between the ages of 12 and 17 years old. As a
result, it is possible to conclude that the varied findings acquired will be based on a main focus
on the group that is being identified for testing the outcomes.
Table 7; How many people in each of the
following age groups live in your home?
Children under age 5
Frequency Percent
0 1092 75.3
1 245 16.9
2 95 6.6
3 15 1.0
4 3 .2
Total 1450 100.0
Table 8; How many people in each of the
following age groups live in your home?
Adults age 18+
Frequency Percent
1 307 21.2
2 825 56.9
Paraphrase This Document
Need a fresh take? Get an instant paraphrase of this document with our AI Paraphraser
3 202 13.9
4 91 6.3
5 22 1.5
7 1 .1
8 2 .1
Total 1450 100.0
Table 9; Are you…?
Frequency Percent
Single/separated/divorced/
widowed 673 46.4
Married/living as married 767 52.9
Total 1440 99.3
Missing Prefer not to answer 10 .7
Total 1450 100.0
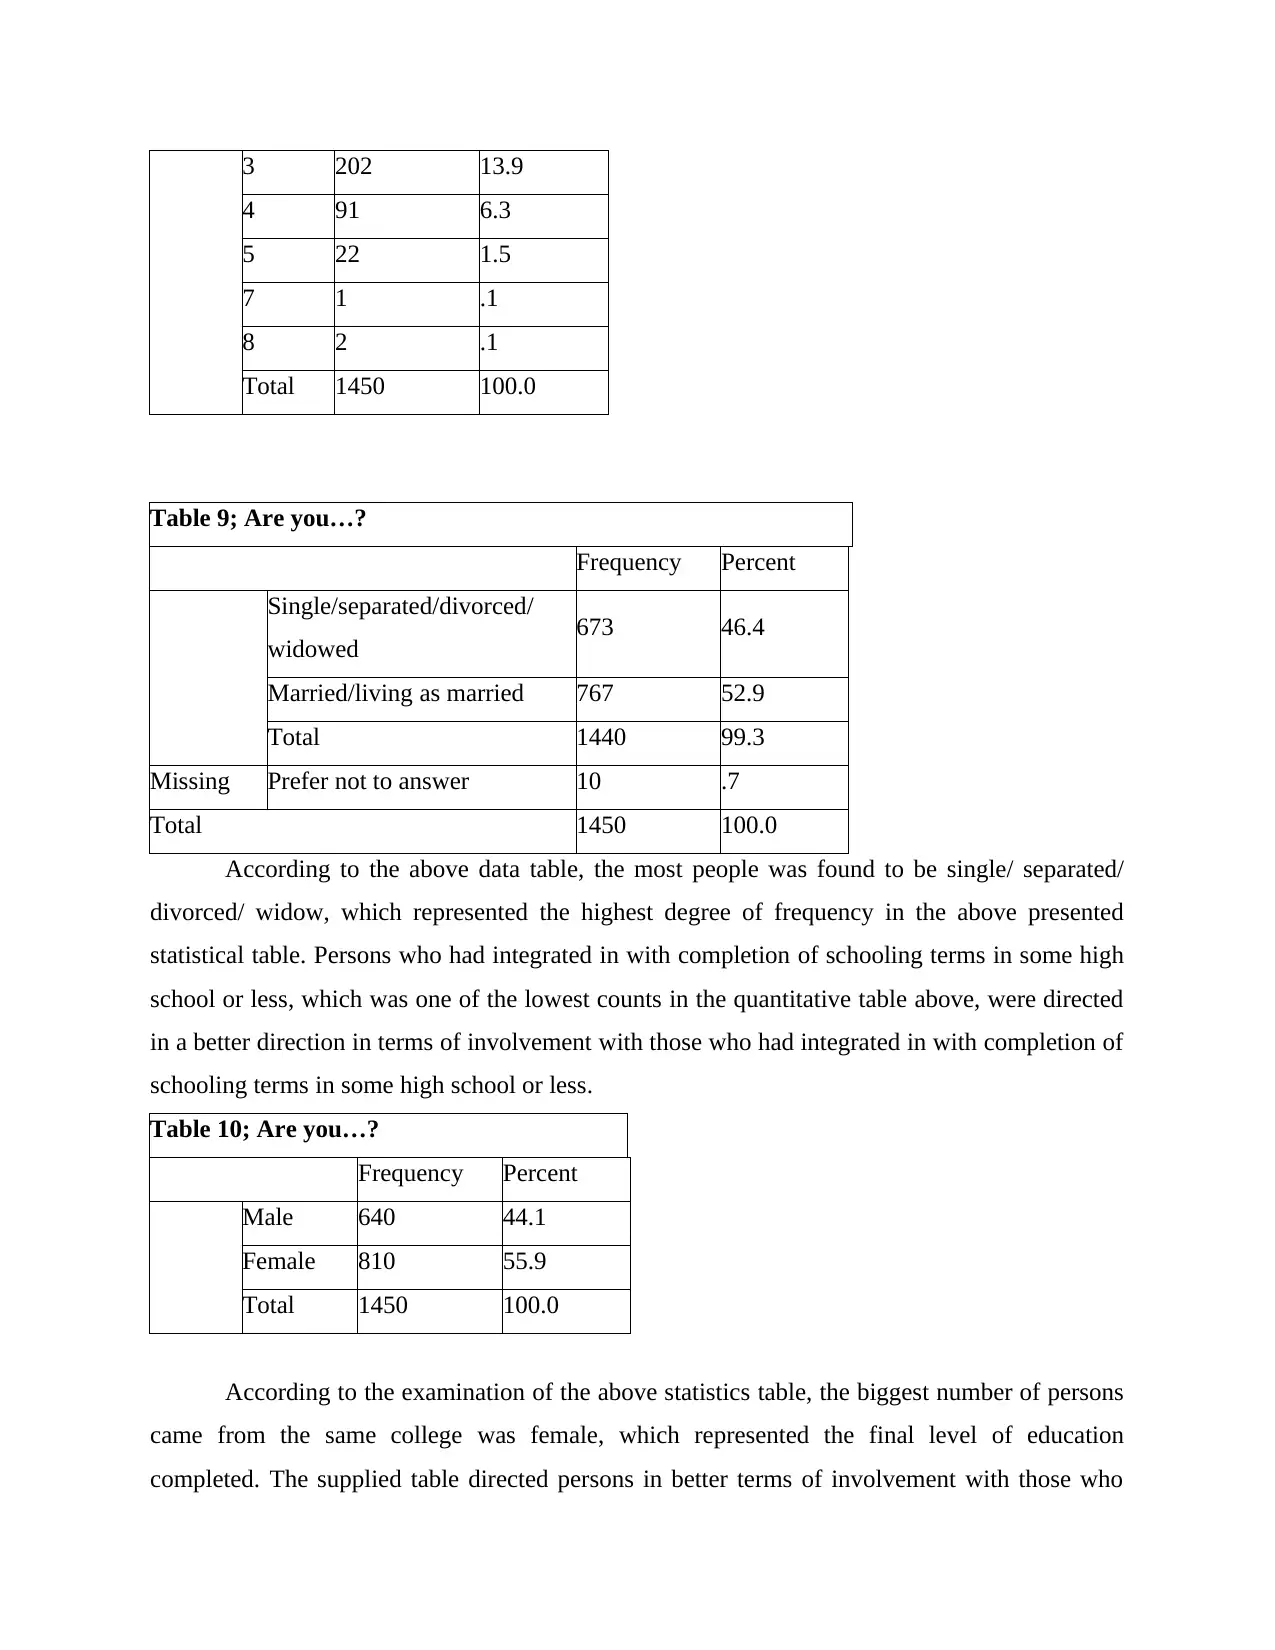
According to the above data table, the most people was found to be single/ separated/
divorced/ widow, which represented the highest degree of frequency in the above presented
statistical table. Persons who had integrated in with completion of schooling terms in some high
school or less, which was one of the lowest counts in the quantitative table above, were directed
in a better direction in terms of involvement with those who had integrated in with completion of
schooling terms in some high school or less.
Table 10; Are you…?
Frequency Percent
Male 640 44.1
Female 810 55.9
Total 1450 100.0
According to the examination of the above statistics table, the biggest number of persons
came from the same college was female, which represented the final level of education
completed. The supplied table directed persons in better terms of involvement with those who
4 91 6.3
5 22 1.5
7 1 .1
8 2 .1
Total 1450 100.0
Table 9; Are you…?
Frequency Percent
Single/separated/divorced/
widowed 673 46.4
Married/living as married 767 52.9
Total 1440 99.3
Missing Prefer not to answer 10 .7
Total 1450 100.0
According to the above data table, the most people was found to be single/ separated/
divorced/ widow, which represented the highest degree of frequency in the above presented
statistical table. Persons who had integrated in with completion of schooling terms in some high
school or less, which was one of the lowest counts in the quantitative table above, were directed
in a better direction in terms of involvement with those who had integrated in with completion of
schooling terms in some high school or less.
Table 10; Are you…?
Frequency Percent
Male 640 44.1
Female 810 55.9
Total 1450 100.0
According to the examination of the above statistics table, the biggest number of persons
came from the same college was female, which represented the final level of education
completed. The supplied table directed persons in better terms of involvement with those who
had integrated in with completion of schooling terms in some high school or less, which was one
of the lowest counts in the quantitative table above.
Table 11; To begin, which of the following
categories includes your age?
Frequency Percent
18-24 575 39.7
25-29 231 15.9
30-34 229 15.8
35-39 180 12.4
40-45 235 16.2
Total 1450 100.0
Table 12; Recoded Childreb Less than 5 Years
Frequency Percent
None 1092 75.3
One 245 16.9
Two or More 113 7.8
Total 1450 100.0
Table 13; Recoded Children 6 to 11 Years
Frequency Percent
None 1172 80.8
One 196 13.5
Two or More 82 5.7
Total 1450 100.0
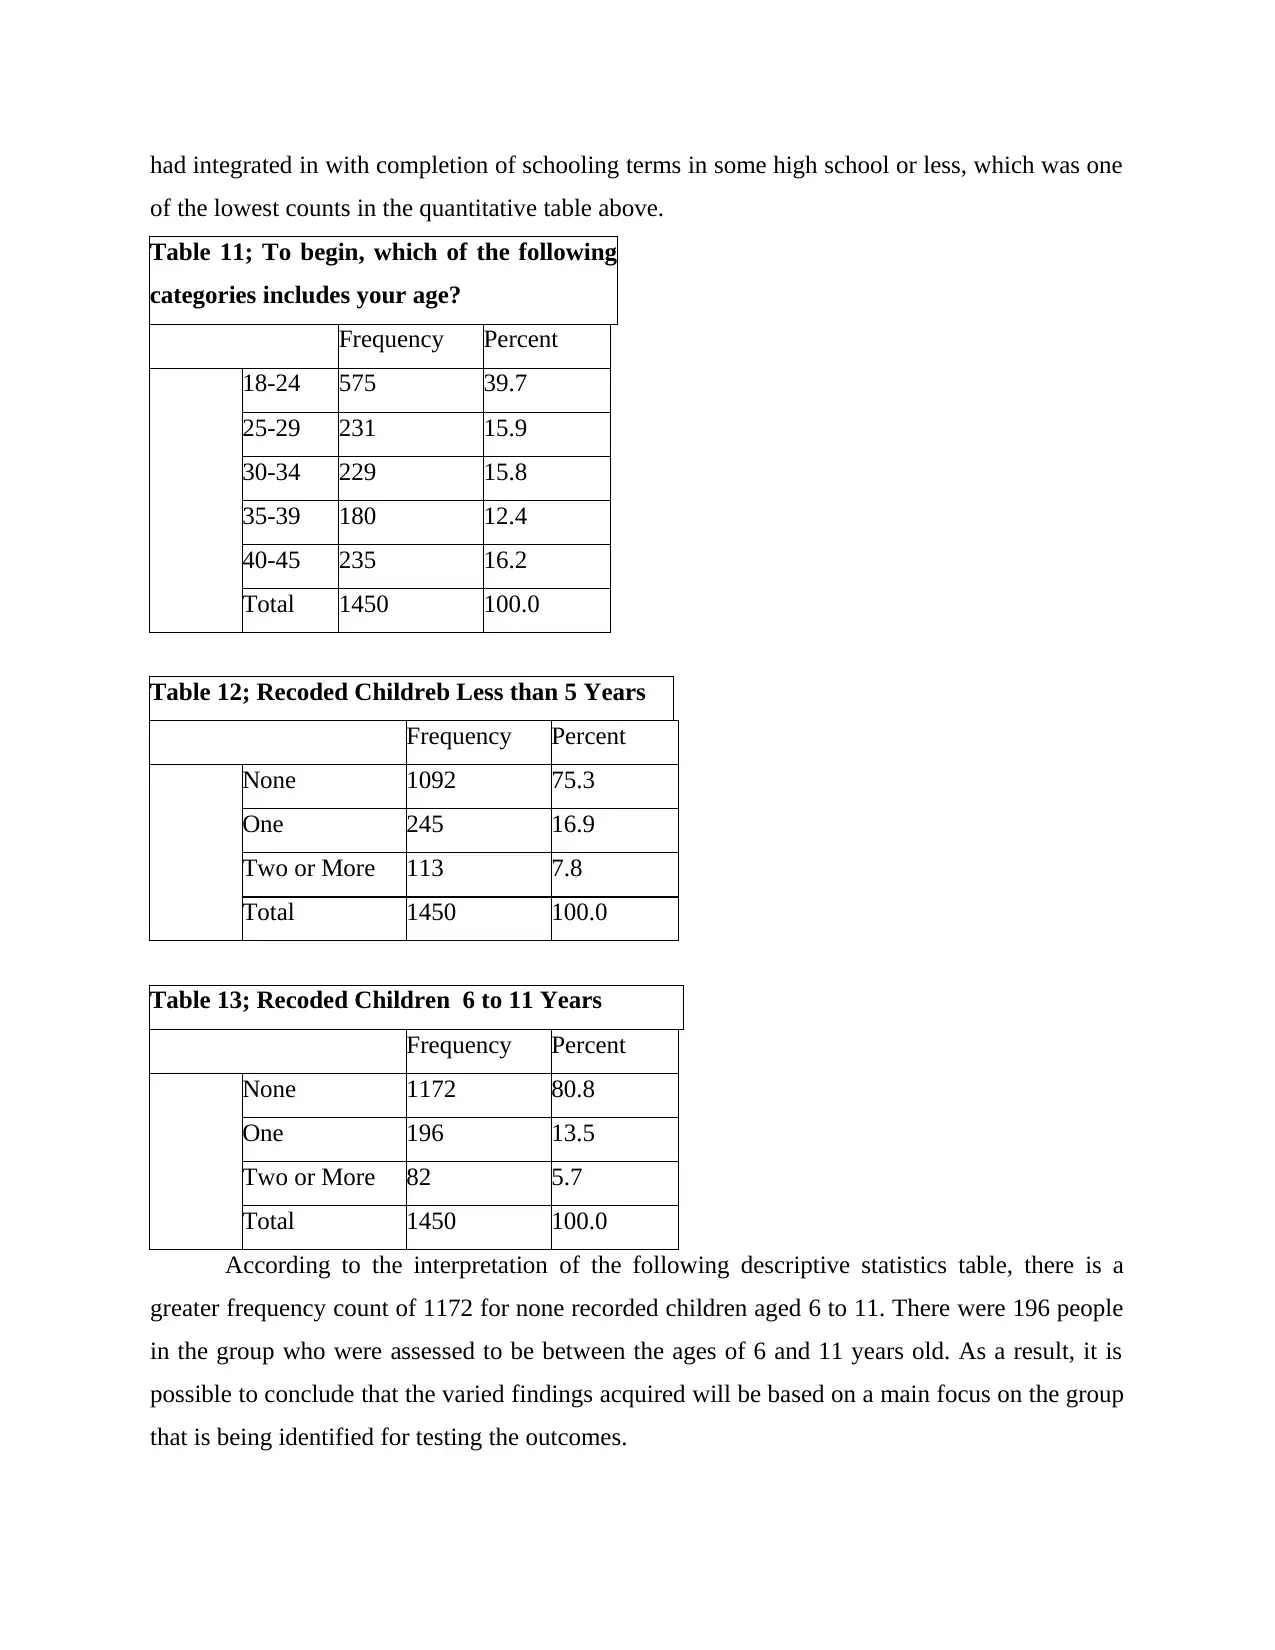
According to the interpretation of the following descriptive statistics table, there is a
greater frequency count of 1172 for none recorded children aged 6 to 11. There were 196 people
in the group who were assessed to be between the ages of 6 and 11 years old. As a result, it is
possible to conclude that the varied findings acquired will be based on a main focus on the group
that is being identified for testing the outcomes.
of the lowest counts in the quantitative table above.
Table 11; To begin, which of the following
categories includes your age?
Frequency Percent
18-24 575 39.7
25-29 231 15.9
30-34 229 15.8
35-39 180 12.4
40-45 235 16.2
Total 1450 100.0
Table 12; Recoded Childreb Less than 5 Years
Frequency Percent
None 1092 75.3
One 245 16.9
Two or More 113 7.8
Total 1450 100.0
Table 13; Recoded Children 6 to 11 Years
Frequency Percent
None 1172 80.8
One 196 13.5
Two or More 82 5.7
Total 1450 100.0
According to the interpretation of the following descriptive statistics table, there is a
greater frequency count of 1172 for none recorded children aged 6 to 11. There were 196 people
in the group who were assessed to be between the ages of 6 and 11 years old. As a result, it is
possible to conclude that the varied findings acquired will be based on a main focus on the group
that is being identified for testing the outcomes.
⊘ This is a preview!⊘
Do you want full access?
Subscribe today to unlock all pages.
Trusted by 1+ million students worldwide
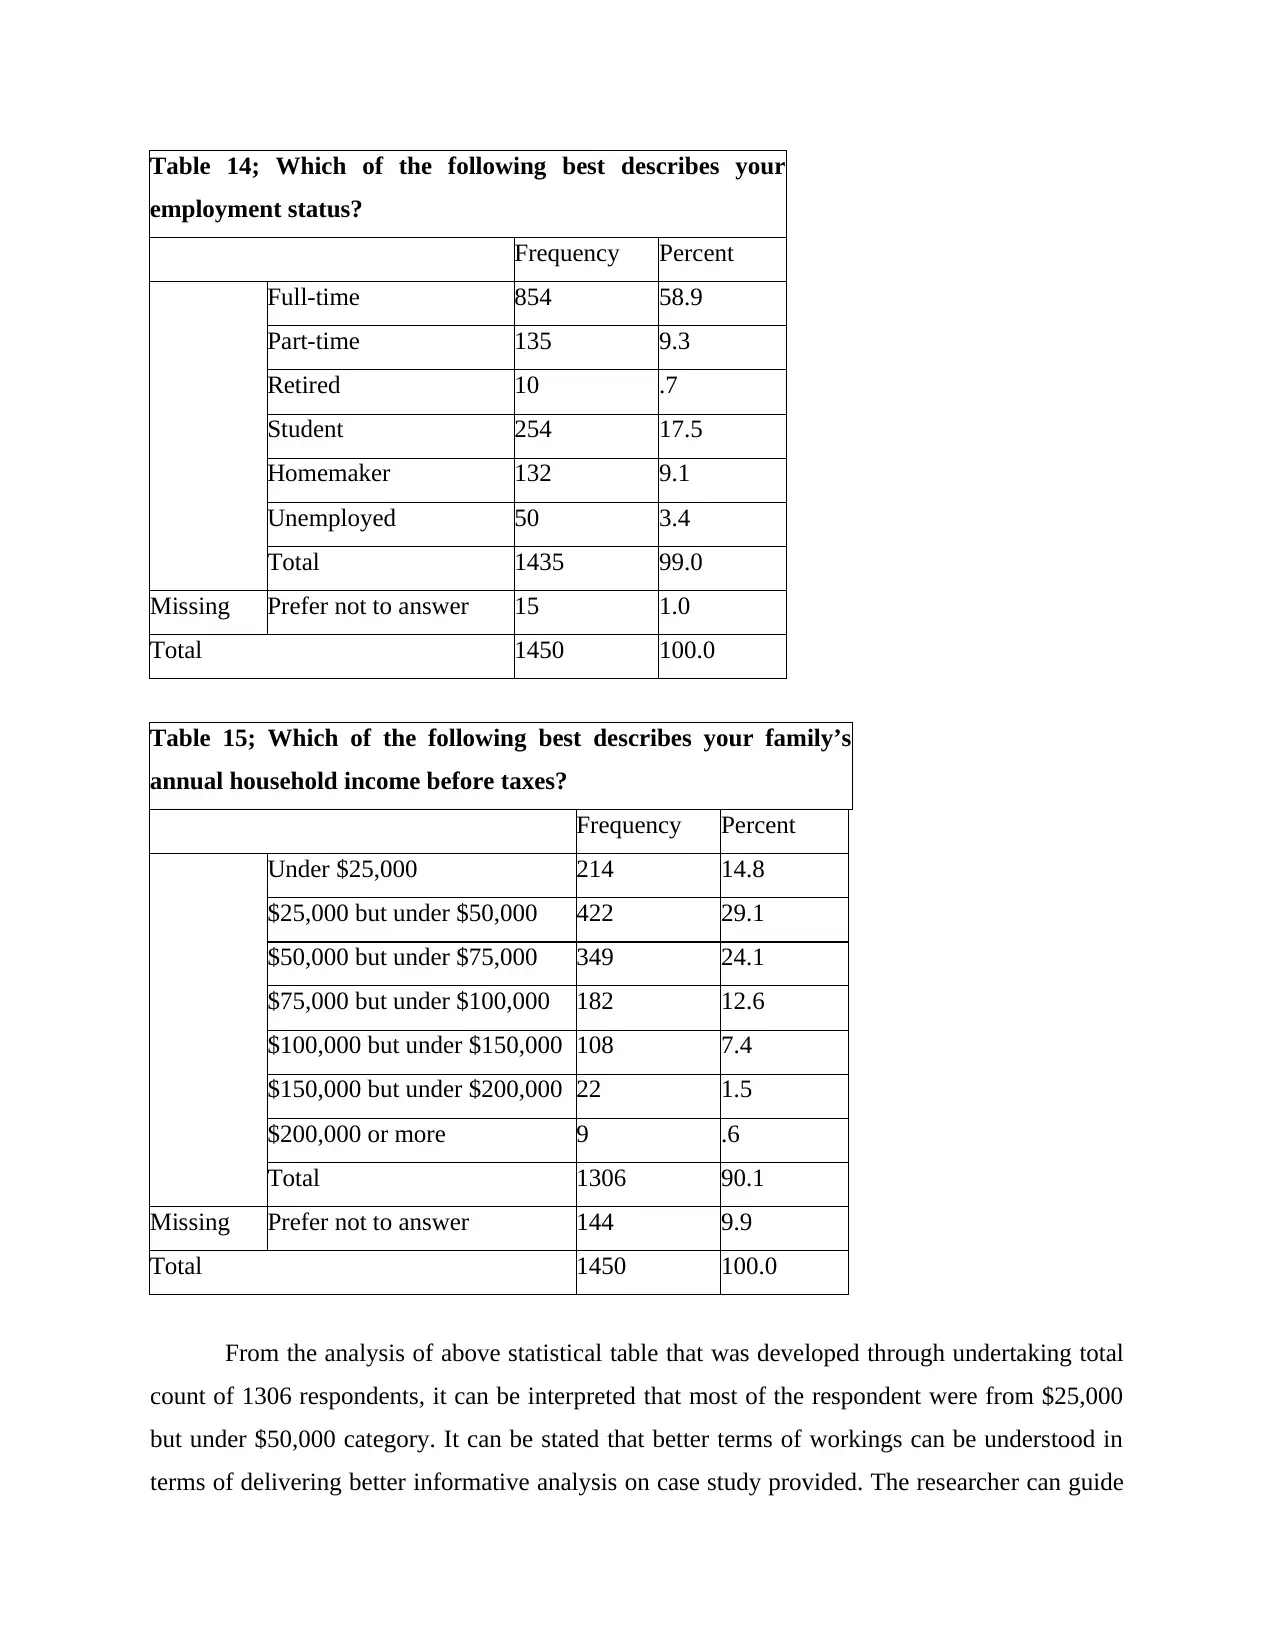
Table 14; Which of the following best describes your
employment status?
Frequency Percent
Full-time 854 58.9
Part-time 135 9.3
Retired 10 .7
Student 254 17.5
Homemaker 132 9.1
Unemployed 50 3.4
Total 1435 99.0
Missing Prefer not to answer 15 1.0
Total 1450 100.0
Table 15; Which of the following best describes your family’s
annual household income before taxes?
Frequency Percent
Under $25,000 214 14.8
$25,000 but under $50,000 422 29.1
$50,000 but under $75,000 349 24.1
$75,000 but under $100,000 182 12.6
$100,000 but under $150,000 108 7.4
$150,000 but under $200,000 22 1.5
$200,000 or more 9 .6
Total 1306 90.1
Missing Prefer not to answer 144 9.9
Total 1450 100.0
From the analysis of above statistical table that was developed through undertaking total
count of 1306 respondents, it can be interpreted that most of the respondent were from $25,000
but under $50,000 category. It can be stated that better terms of workings can be understood in
terms of delivering better informative analysis on case study provided. The researcher can guide
Paraphrase This Document
Need a fresh take? Get an instant paraphrase of this document with our AI Paraphraser
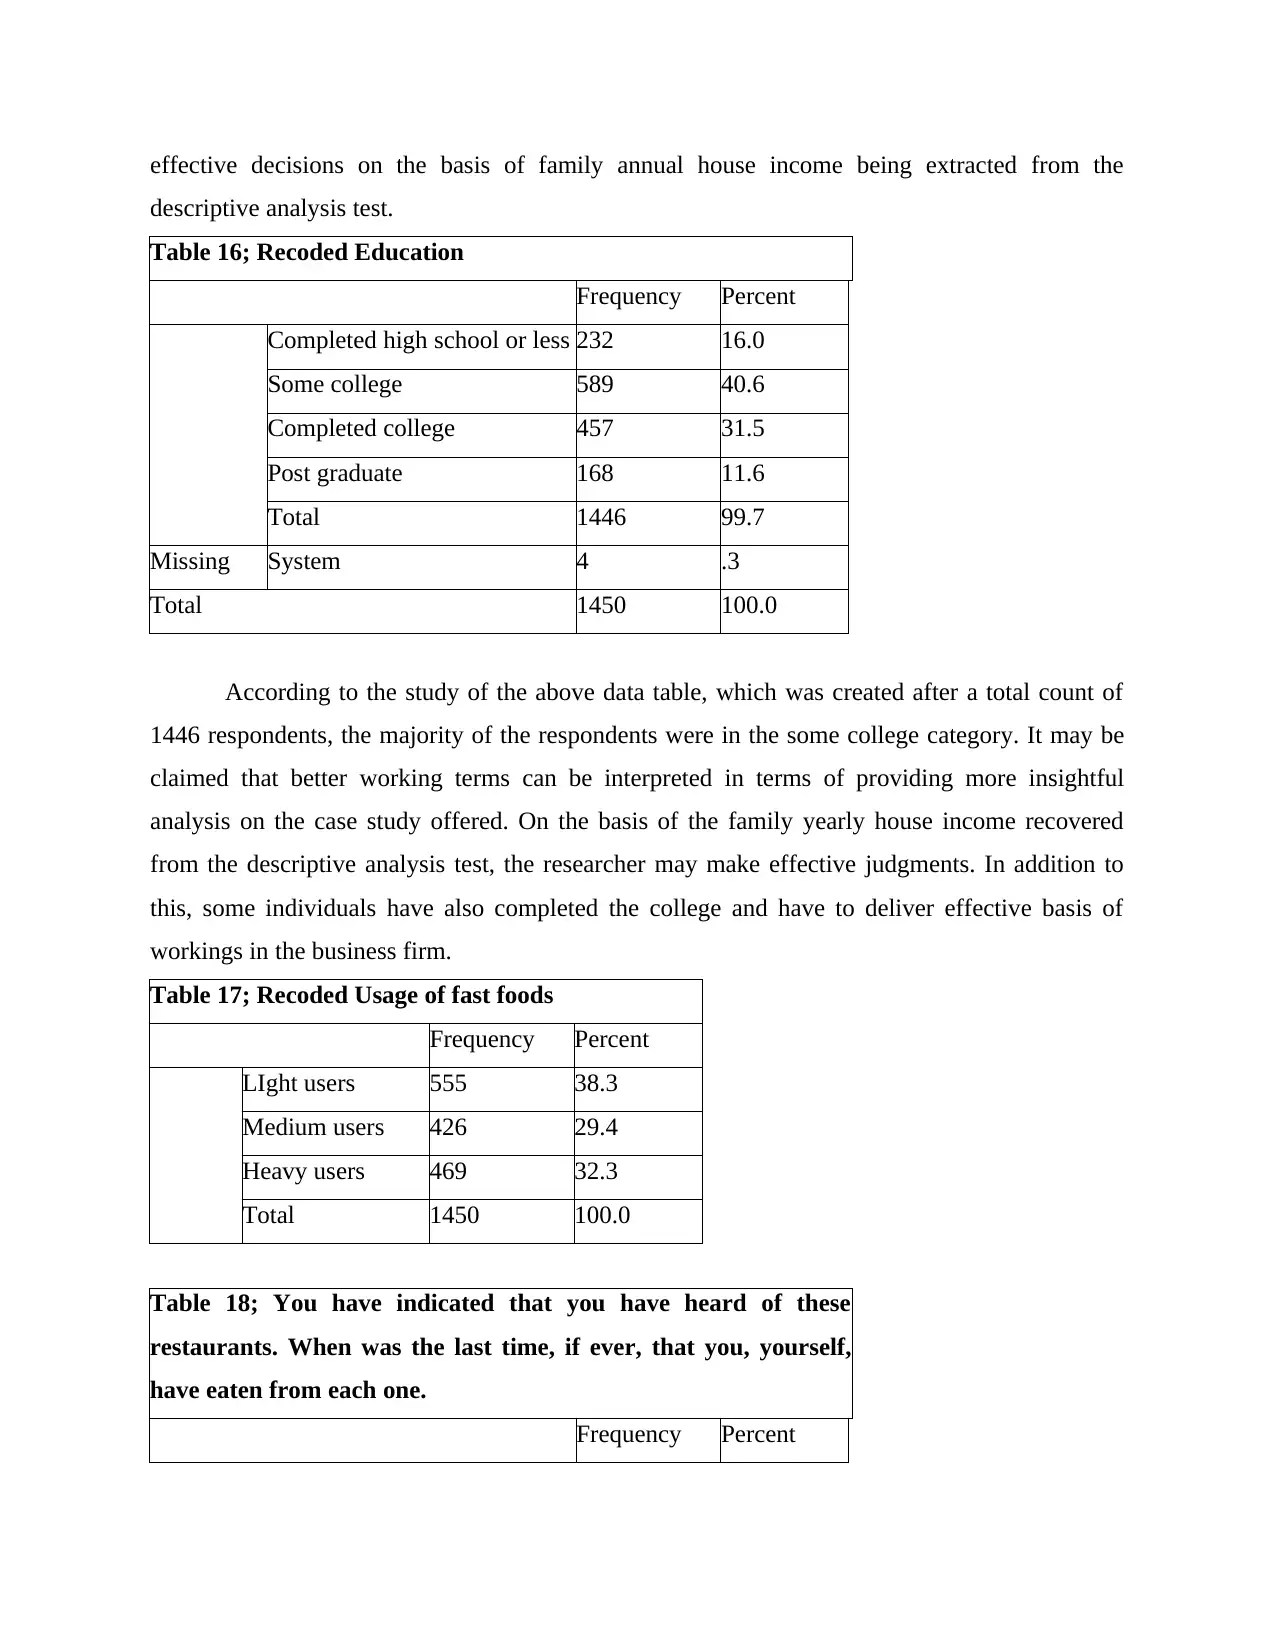
effective decisions on the basis of family annual house income being extracted from the
descriptive analysis test.
Table 16; Recoded Education
Frequency Percent
Completed high school or less 232 16.0
Some college 589 40.6
Completed college 457 31.5
Post graduate 168 11.6
Total 1446 99.7
Missing System 4 .3
Total 1450 100.0
According to the study of the above data table, which was created after a total count of
1446 respondents, the majority of the respondents were in the some college category. It may be
claimed that better working terms can be interpreted in terms of providing more insightful
analysis on the case study offered. On the basis of the family yearly house income recovered
from the descriptive analysis test, the researcher may make effective judgments. In addition to
this, some individuals have also completed the college and have to deliver effective basis of
workings in the business firm.
Table 17; Recoded Usage of fast foods
Frequency Percent
LIght users 555 38.3
Medium users 426 29.4
Heavy users 469 32.3
Total 1450 100.0
Table 18; You have indicated that you have heard of these
restaurants. When was the last time, if ever, that you, yourself,
have eaten from each one.
Frequency Percent
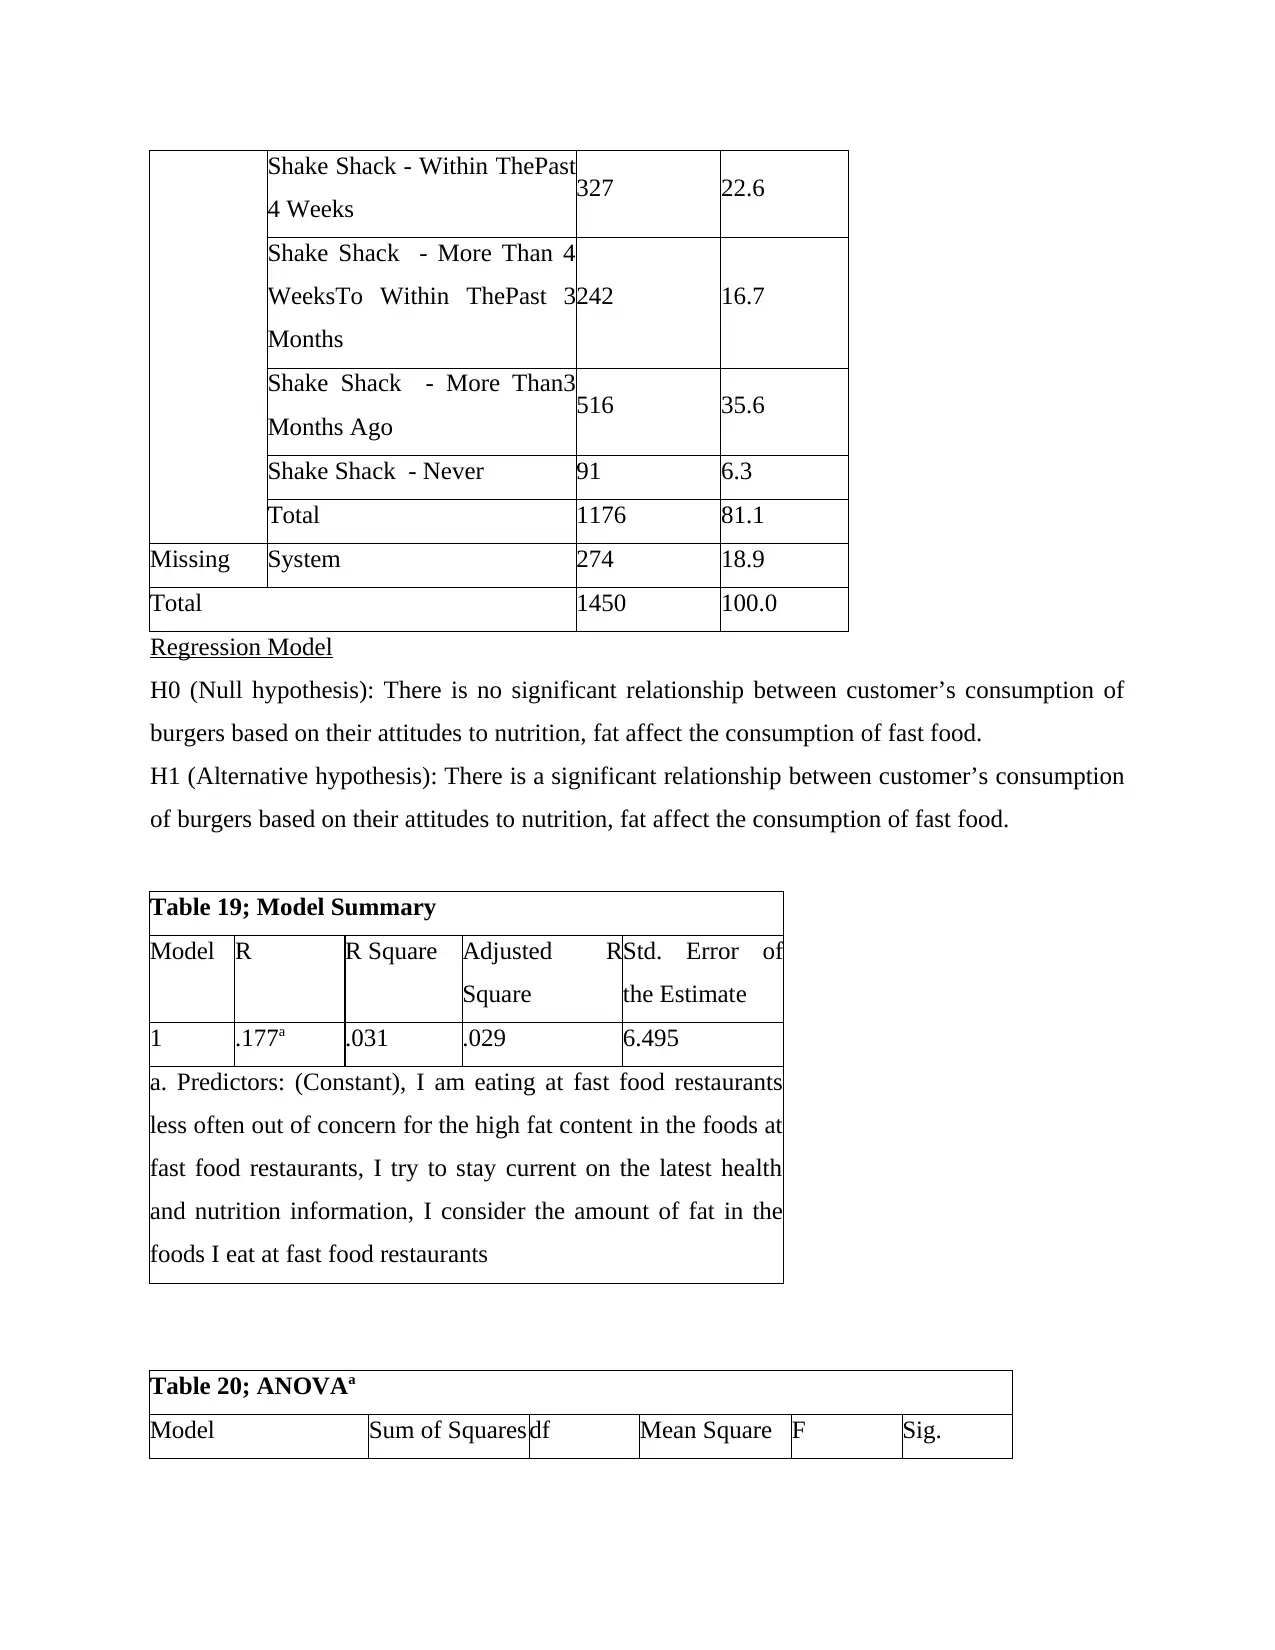
Shake Shack - Within ThePast
4 Weeks 327 22.6
Shake Shack - More Than 4
WeeksTo Within ThePast 3
Months
242 16.7
Shake Shack - More Than3
Months Ago 516 35.6
Shake Shack - Never 91 6.3
Total 1176 81.1
Missing System 274 18.9
Total 1450 100.0
Regression Model
H0 (Null hypothesis): There is no significant relationship between customer’s consumption of
burgers based on their attitudes to nutrition, fat affect the consumption of fast food.
H1 (Alternative hypothesis): There is a significant relationship between customer’s consumption
of burgers based on their attitudes to nutrition, fat affect the consumption of fast food.
Table 19; Model Summary
Model R R Square Adjusted R
Square
Std. Error of
the Estimate
1 .177a .031 .029 6.495
a. Predictors: (Constant), I am eating at fast food restaurants
less often out of concern for the high fat content in the foods at
fast food restaurants, I try to stay current on the latest health
and nutrition information, I consider the amount of fat in the
foods I eat at fast food restaurants
Table 20; ANOVAa
Model Sum of Squaresdf Mean Square F Sig.
⊘ This is a preview!⊘
Do you want full access?
Subscribe today to unlock all pages.
Trusted by 1+ million students worldwide
1 out of 19
Related Documents


Your All-in-One AI-Powered Toolkit for Academic Success.
+13062052269
info@desklib.com
Available 24*7 on WhatsApp / Email
![[object Object]](/_next/static/media/star-bottom.7253800d.svg)
Unlock your academic potential
Copyright © 2020–2026 A2Z Services. All Rights Reserved. Developed and managed by ZUCOL.