Fiction Planet: Enhancing Efficiency with Automation & Pricing

Verified

Added on  2023/06/06

|11
|1605
|419
Project
AI Summary
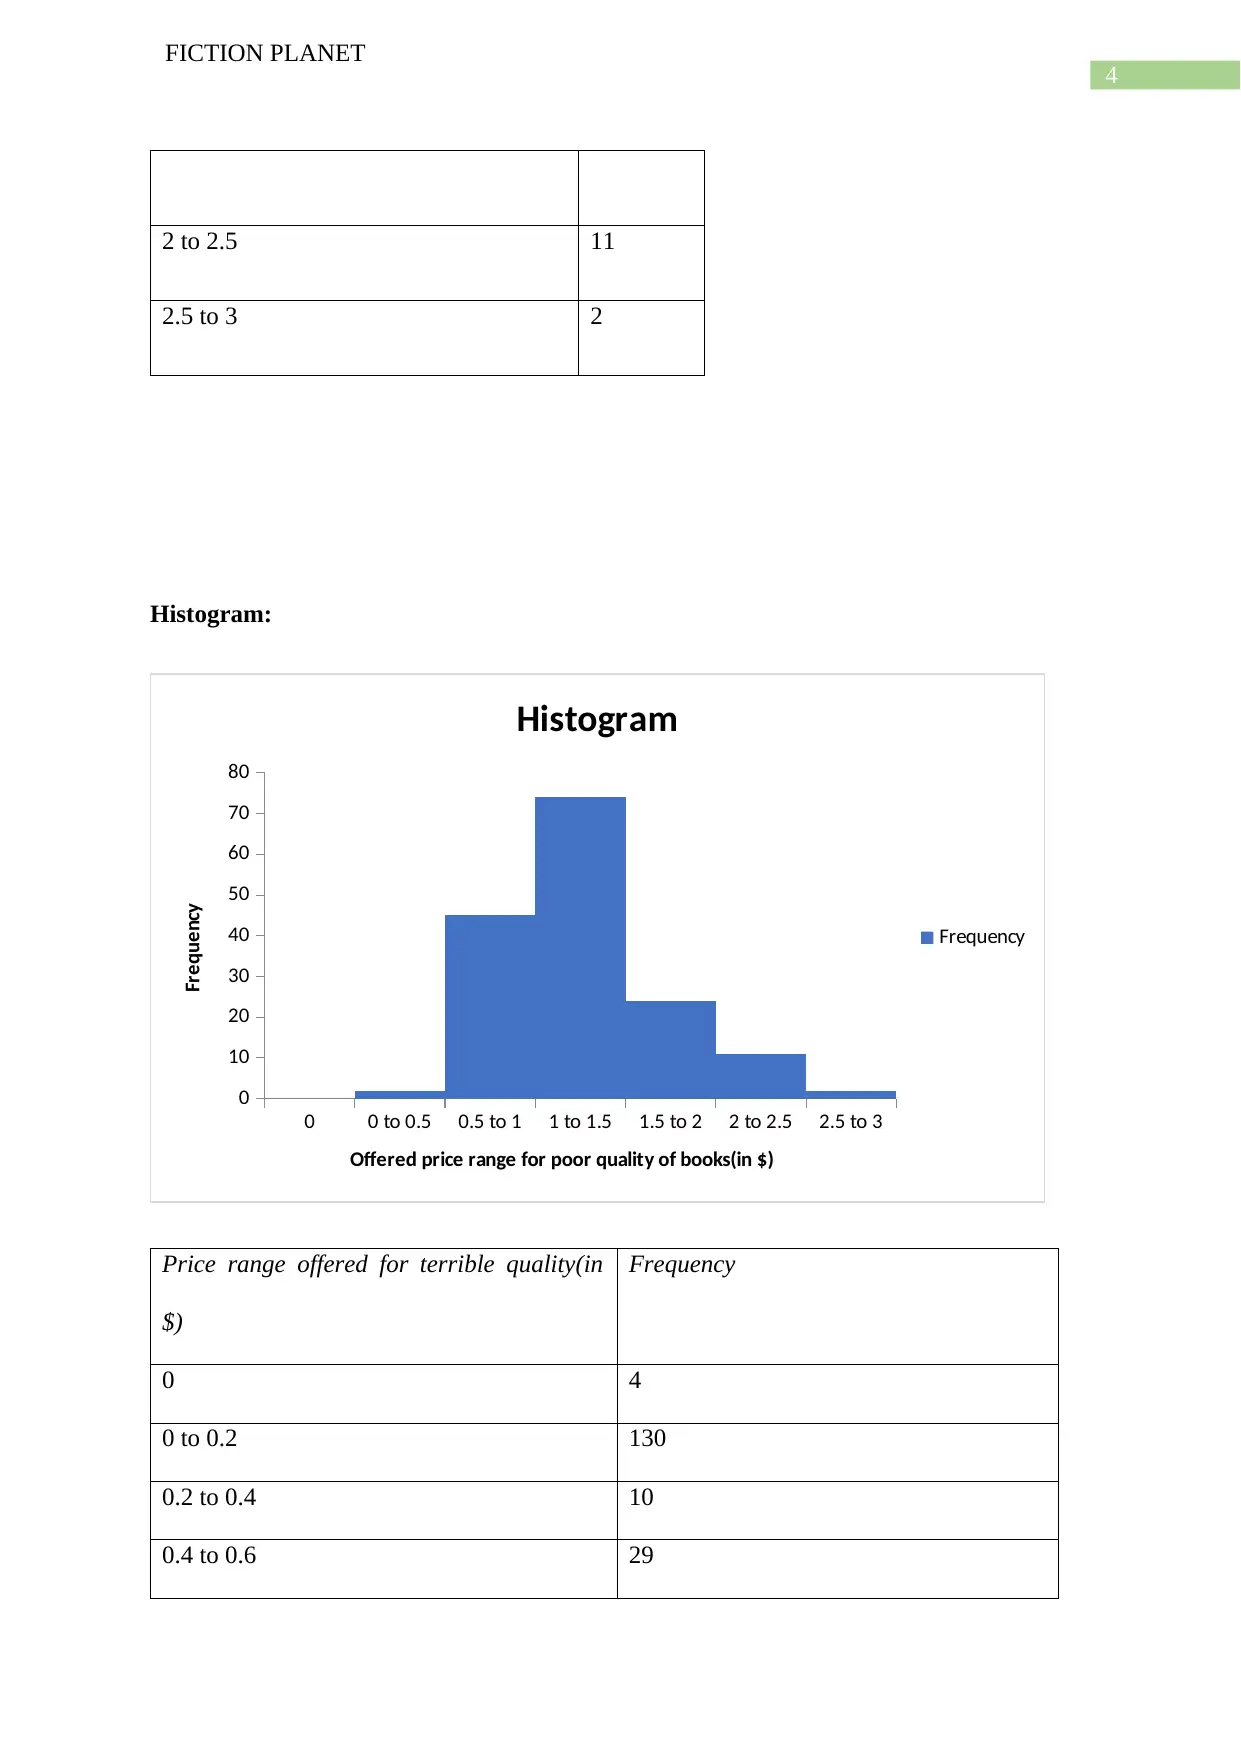
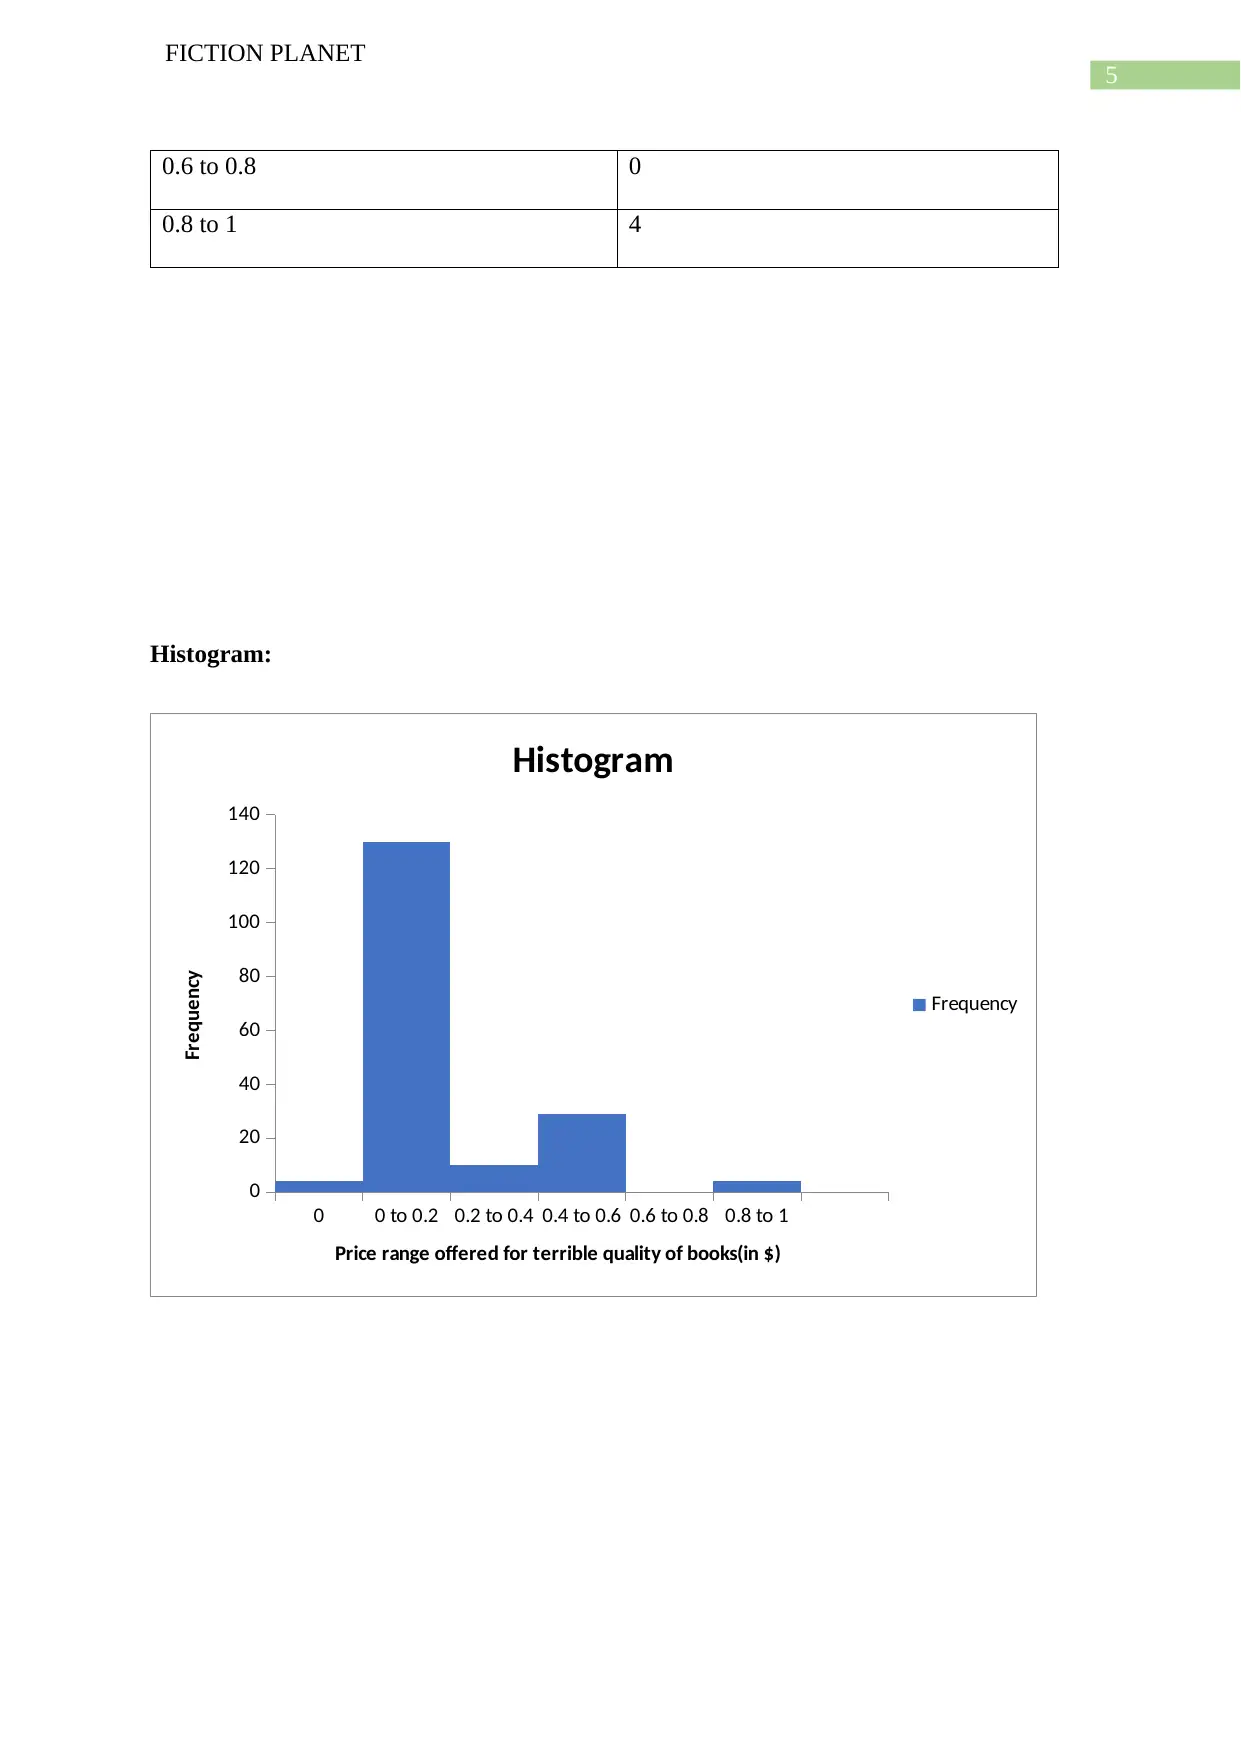
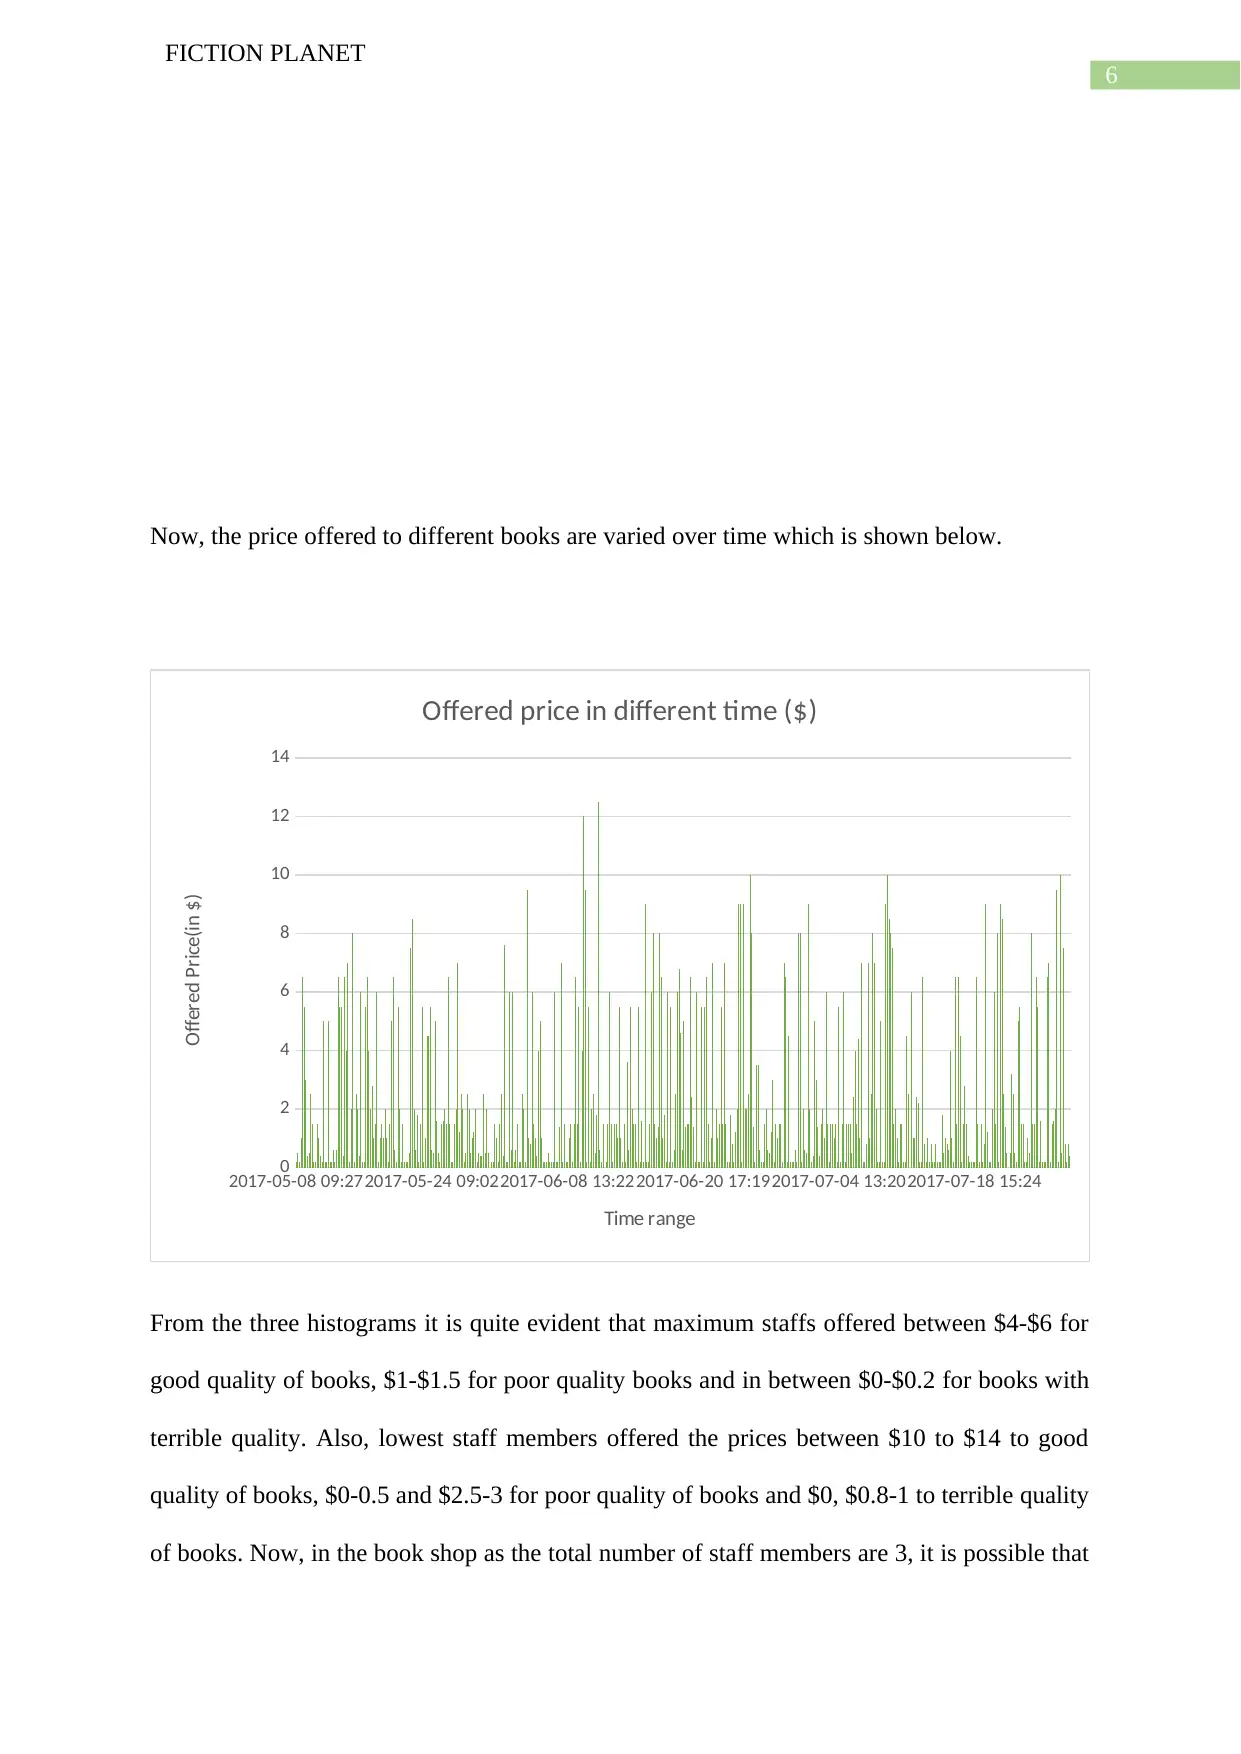
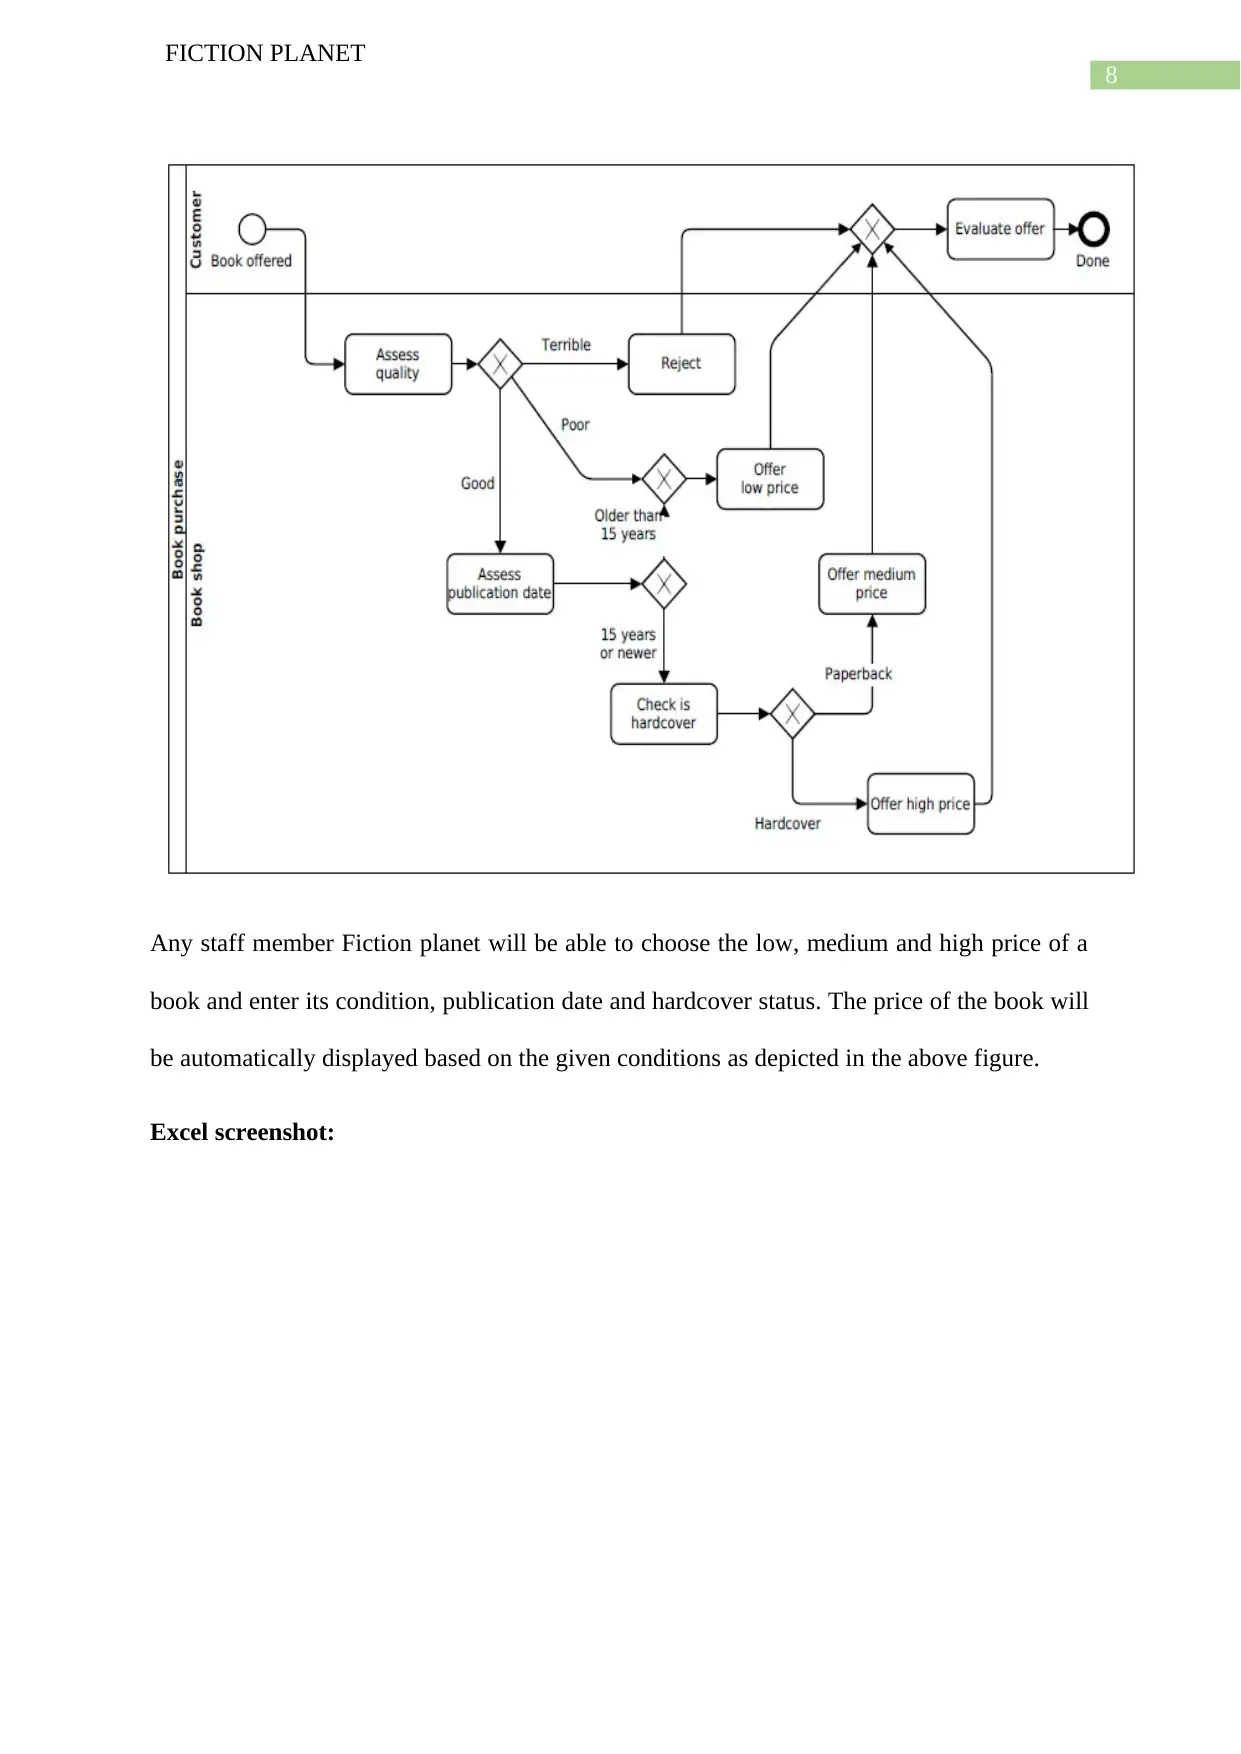
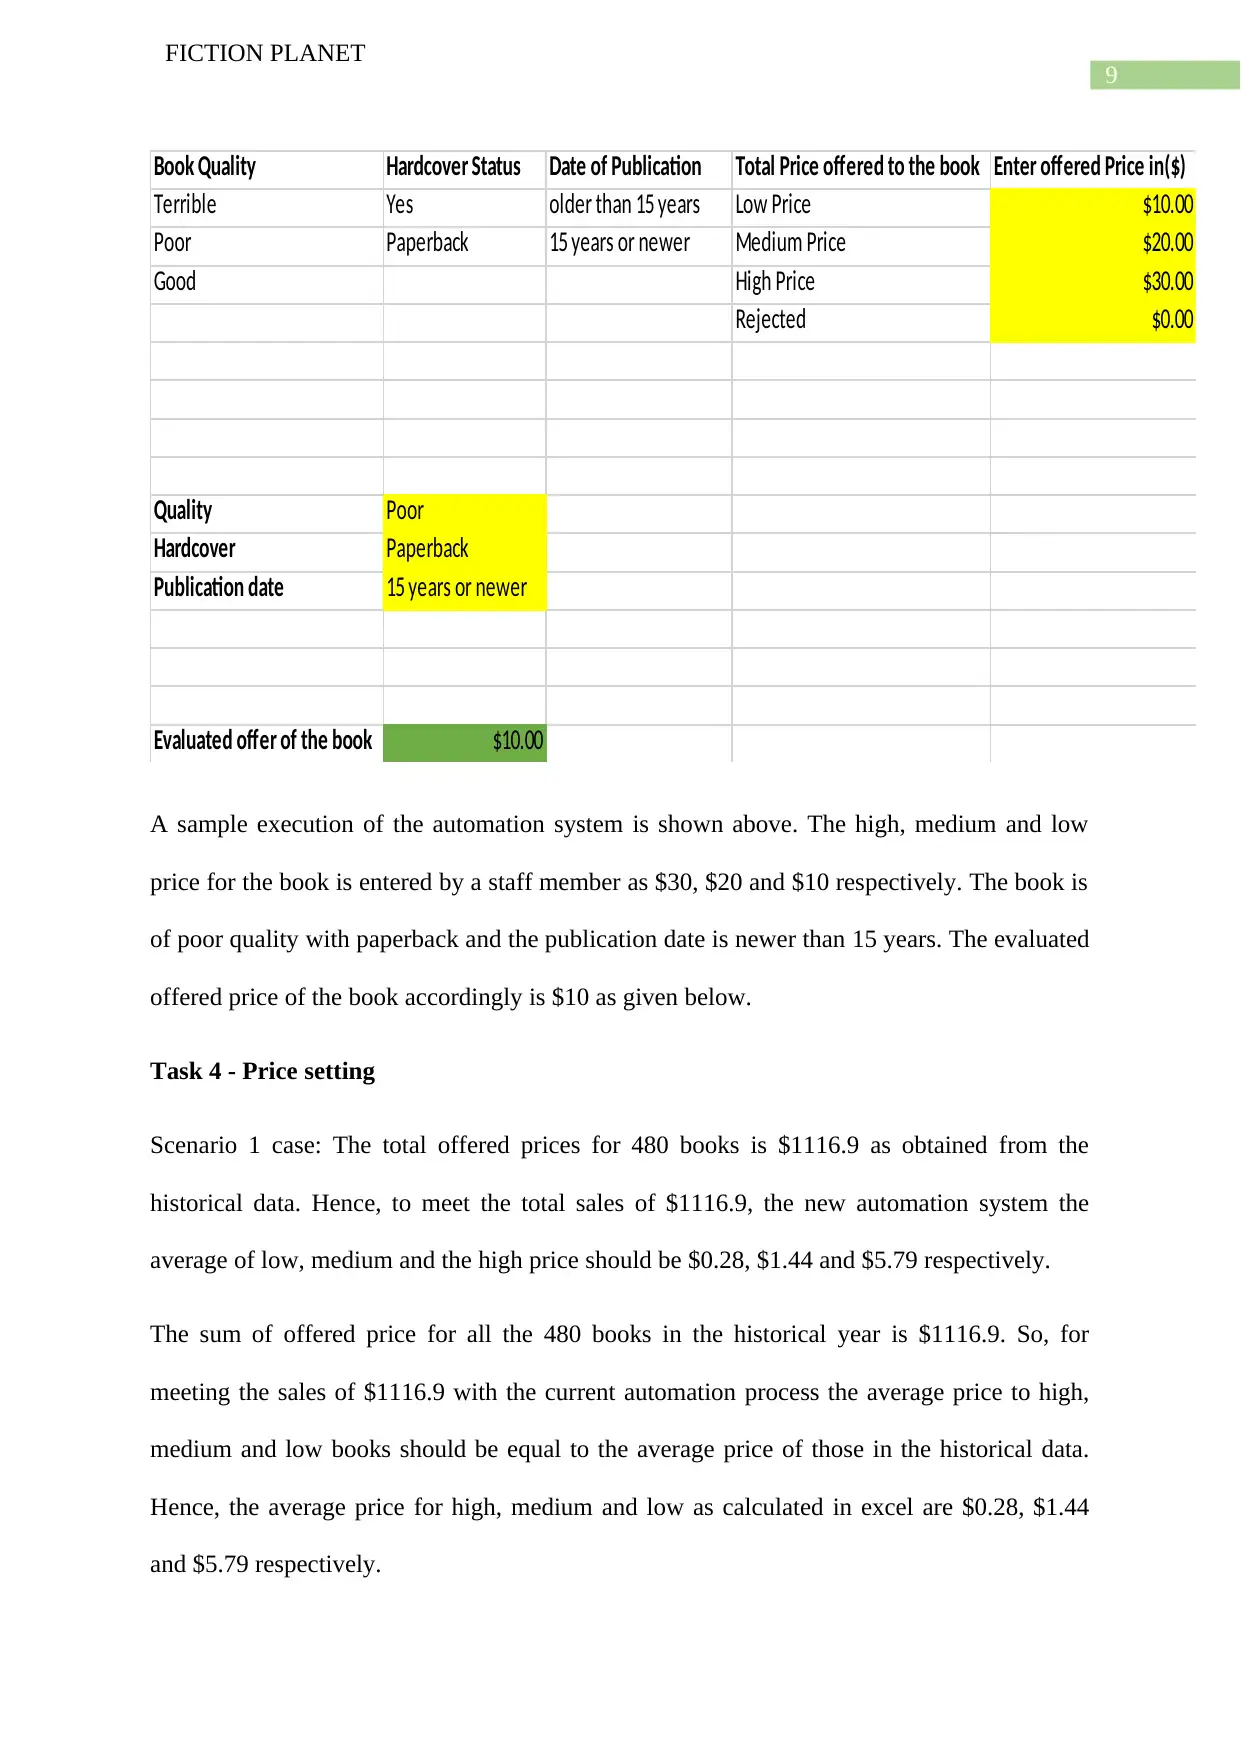
This project analyzes the business operations of a second-hand bookstore, Fiction Planet, focusing on cost analysis, pricing strategies, and the implementation of an automation system. It begins by detailing the staff's working hours and calculating the annual operating costs, including wages, rent, insurance, and utilities. The project then examines the pricing strategies employed by the staff for books in varying conditions, using frequency distributions and histograms to visualize the data. Recognizing inconsistencies in pricing, an automation process is proposed to standardize price offers based on book condition, publication date, and hardcover status. Finally, the project explores price-setting scenarios to meet sales targets and cover operational costs, providing insights into optimizing the bookstore's financial performance. This document is available on Desklib, a platform offering a wide range of study resources for students.
Document Page
Running head: FICTION PLANET
Assignment 1 – Fiction Planet
Name of the Student
Name of the University
Author Note
tabler-icon-diamond-filled.svg

Secure Best Marks with AI Grader

Need help grading? Try our AI Grader for instant feedback on your assignments.
Document Page
1
FICTION PLANET
Task 0:
In a small second hand book shop known as Fiction Planet which is operated by three staff
members Audrey, Bianca, and Christina, the timetable for their working is different. The time
table and working days of each staff member is shown in the table below.
Name of
the staff
Working days Number of
working days
in a week
Working
hours in
a day
Total
Working time
in week(in
hrs)
Total
working
time in a
year
Audrey Monday, Tuesday
and Wednesday
3 3.5 10.5 546
Bianca Thursday, Friday
and Saturday
3 3.5 10.5 546
Christin
a
Monday to Friday 5 5 25 1300
Task 1:
Now, in this particular task the operating costs of running the business is calculated by using
the available information in the ‘Costs’ section. As given below Audrey and Bianca do not
take any wage from the business as they are semi-retired, however, Christina takes wage of
$22 per hour her entire working period and enjoys a paid leave of 4 weeks. During that period
the replacement worker in place of Christina takes $33 per hour. The fixed cost like rent and
insurance are $2900 per year and the utilities cost is $140 in every month.
Document Page
2
FICTION PLANET
Name rate per hour(in USD) Total working hours in week(in hrs) Cost in a week(in USD) Cost in a year(in $)
Audrey 0 10.5 0 0
Bianca 0 10.5 0 0
Christina 22 25 550 28600
Casual replacement individual 33 25 825 3300
Total 31900
Fixed Costs Annual costs(in USD)
Rents and Insurance 2900
Utilities costs 1680
Projected annual Outgoing cost 36480
So, with the information provided the estimated annual cost of running the business is
$36480.
Task 2: Sales team offers
The paid prices are different based on the staffs who offered the price. The books can be
classified in good, poor or in terrible condition. The frequency distributions and histograms
are constructed based on the variation of each quality of books by different staff members.
price range offered for good quality books (in
$)
Frequenc
y
0 0
0 to 2 14
2 to 4 20
4 to 6 50
6 to 8 42
8 to 10 17
10 to 12 1
Document Page
3
FICTION PLANET
12 to 14 1
Histogram:
0 0 to 2 2 to 4 4 to 6 6 to 8 8 to 10 10 to 12 12 to 14
0
10
20
30
40
50
60
Histogram
Frequency
Price range offered for good quality of books(in $)
Frequency
Price range offered for poor quality
books(in $)
Frequenc
y
0 0
0 to 0.5 2
0.5 to 1 45
1 to 1.5 74
1.5 to 2 24
tabler-icon-diamond-filled.svg

Secure Best Marks with AI Grader

Need help grading? Try our AI Grader for instant feedback on your assignments.
Document Page
4
FICTION PLANET
2 to 2.5 11
2.5 to 3 2
Histogram:
0 0 to 0.5 0.5 to 1 1 to 1.5 1.5 to 2 2 to 2.5 2.5 to 3
0
10
20
30
40
50
60
70
80
Histogram
Frequency
Offered price range for poor quality of books(in $)
Frequency
Price range offered for terrible quality(in
$)
Frequency
0 4
0 to 0.2 130
0.2 to 0.4 10
0.4 to 0.6 29
Document Page
5
FICTION PLANET
0.6 to 0.8 0
0.8 to 1 4
Histogram:
0 0 to 0.2 0.2 to 0.4 0.4 to 0.6 0.6 to 0.8 0.8 to 1
0
20
40
60
80
100
120
140
Histogram
Frequency
Price range offered for terrible quality of books(in $)
Frequency
Document Page
6
FICTION PLANET
Now, the price offered to different books are varied over time which is shown below.
2017-05-08 09:272017-05-24 09:022017-06-08 13:222017-06-20 17:192017-07-04 13:202017-07-18 15:24
0
2
4
6
8
10
12
14
Offered price in different time ($)
Time range
Offered Price(in $)
From the three histograms it is quite evident that maximum staffs offered between $4-$6 for
good quality of books, $1-$1.5 for poor quality books and in between $0-$0.2 for books with
terrible quality. Also, lowest staff members offered the prices between $10 to $14 to good
quality of books, $0-0.5 and $2.5-3 for poor quality of books and $0, $0.8-1 to terrible quality
of books. Now, in the book shop as the total number of staff members are 3, it is possible that
tabler-icon-diamond-filled.svg

Paraphrase This Document

Need a fresh take? Get an instant paraphrase of this document with our AI Paraphraser
Document Page
7
FICTION PLANET
the same staff offered different prices to same quality of books. Hence, the histogram
contains repetitive frequencies of prices offered by the same staff members.
The clustered column suggests that the maximum price is offered at 9th June 2017 at 12.39
PM and the prices are minimum in different times like 8th May 2017 and in 29th July 2017 in
the historical year. The price distribution has varied over a wide range as the standard
deviation of the offered prices is $2.65 with an average price of $2.327. Histogram of offered
prices are not approximately normally distributed. This suggests that the price ranges have
varied by an wide range and no specific rules are followed by the staff member while offered
prices to books to the customers. Hence, an automation process with specific rules, for
offering price to books need to be followed which is described in the later section.
Task 3:
Now, an automation process that will automatically calculate the offered price based on book
hardcover condition, publication date and its condition are given below. This automation
process is proposed by Audrey and Bianca who are semi-retired employees.
The automation process flow diagram:
Document Page
8
FICTION PLANET
Any staff member Fiction planet will be able to choose the low, medium and high price of a
book and enter its condition, publication date and hardcover status. The price of the book will
be automatically displayed based on the given conditions as depicted in the above figure.
Excel screenshot:
Document Page
9
FICTION PLANET
Book Quality Hardcover Status Date of Publication Total Price offered to the book Enter offered Price in($)
Terrible Yes older than 15 years Low Price $10.00
Poor Paperback 15 years or newer Medium Price $20.00
Good High Price $30.00
Rejected $0.00
Quality Poor
Hardcover Paperback
Publication date 15 years or newer
Evaluated offer of the book $10.00
A sample execution of the automation system is shown above. The high, medium and low
price for the book is entered by a staff member as $30, $20 and $10 respectively. The book is
of poor quality with paperback and the publication date is newer than 15 years. The evaluated
offered price of the book accordingly is $10 as given below.
Task 4 - Price setting
Scenario 1 case: The total offered prices for 480 books is $1116.9 as obtained from the
historical data. Hence, to meet the total sales of $1116.9, the new automation system the
average of low, medium and the high price should be $0.28, $1.44 and $5.79 respectively.
The sum of offered price for all the 480 books in the historical year is $1116.9. So, for
meeting the sales of $1116.9 with the current automation process the average price to high,
medium and low books should be equal to the average price of those in the historical data.
Hence, the average price for high, medium and low as calculated in excel are $0.28, $1.44
and $5.79 respectively.
tabler-icon-diamond-filled.svg

Secure Best Marks with AI Grader

Need help grading? Try our AI Grader for instant feedback on your assignments.
Document Page
10
FICTION PLANET
Scenario 2 case: The total cost of Christina in a year is $28600. So, when all the 3 staffs
charge the same wage as Christina then the total cost of three staffs will be
(10.5*22*52)*2 + 28600 = $52624
The casual replacement costs and the fixed cost with utilities cost will remain the same.
Hence, the total cost in a year will be $52624 + $3300 + $2900 + $1680 = $60524.
Now, it is given that a book sold is in a double rate than it is purchased. So, the average of
selling price for high, medium and low price books sold is $0.28*2 = $0.56, $1.44*2 = $2.88
and $5.79*2 = $11.58 respectively.
Now, the exact number of books that are to be required to sold at the above high, medium and
low prices can be calculated by mathematical optimization process if other given constraints
are known. However, it can be predicted that the number of books sold must be higher than
the number of books sold in the historical data to meet the annual cost of $60524 of the shop.
chevron_up_icon
1 out of 11
circle_padding
hide_on_mobile
zoom_out_icon
[object Object]