Business Communication for Managers: Data Visualization Report

Verified

Added on  2020/04/15

|4
|429
|499
Report
AI Summary
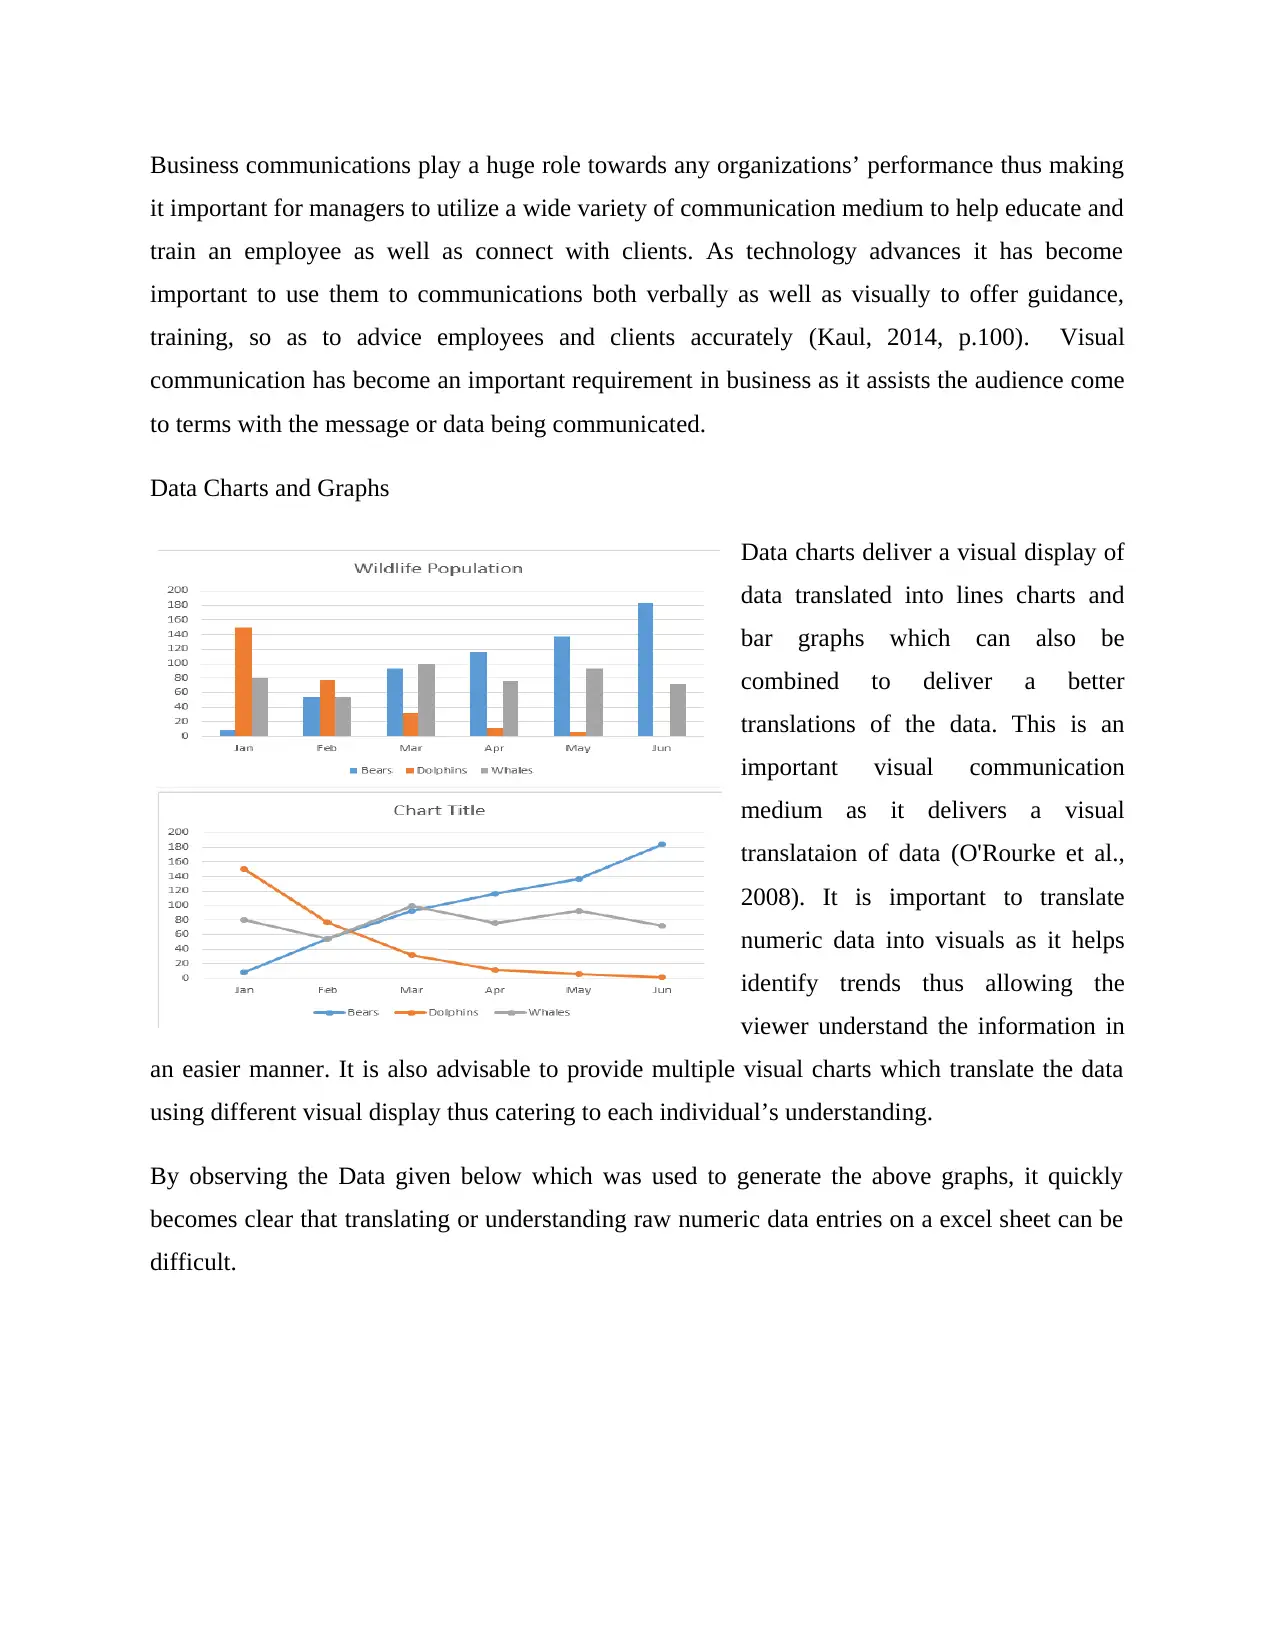
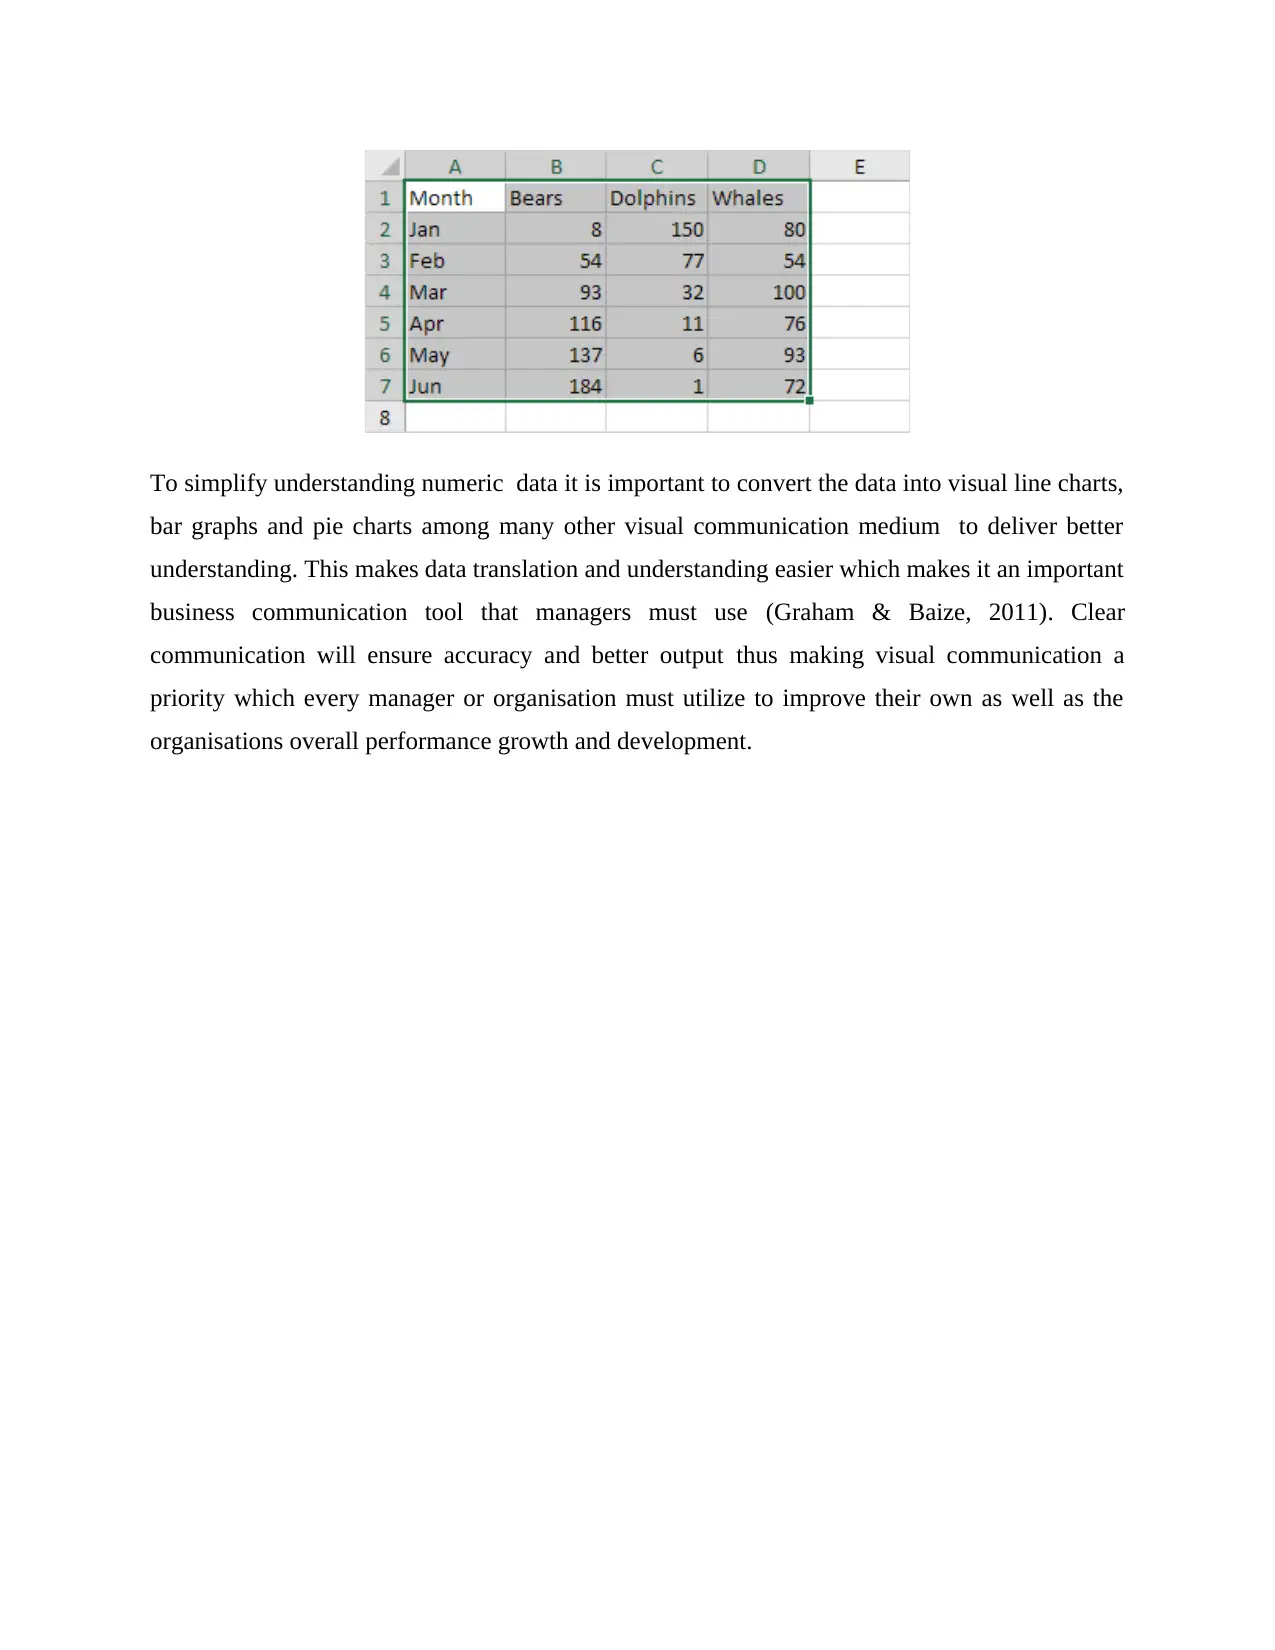
This report focuses on the importance of effective business communication, particularly for managers. It highlights the significance of visual communication, such as data charts and graphs, in conveying information clearly and efficiently. The report emphasizes how translating raw numeric data into visual formats like line charts, bar graphs, and pie charts can significantly improve understanding and facilitate better decision-making. By using visual aids, managers can enhance their ability to communicate complex information, improve employee training, and better engage with clients. The report also references key literature to support its arguments, underscoring the need for clear and accurate communication in driving organizational performance and growth. This report is available on Desklib, a platform providing students with AI-based study tools and resources.
Document Page
12/7/2017
Student Name
Business Communication for Managers
tabler-icon-diamond-filled.svg

Paraphrase This Document

Need a fresh take? Get an instant paraphrase of this document with our AI Paraphraser
Document Page
Business communications play a huge role towards any organizations’ performance thus making
it important for managers to utilize a wide variety of communication medium to help educate and
train an employee as well as connect with clients. As technology advances it has become
important to use them to communications both verbally as well as visually to offer guidance,
training, so as to advice employees and clients accurately (Kaul, 2014, p.100). Visual
communication has become an important requirement in business as it assists the audience come
to terms with the message or data being communicated.
Data Charts and Graphs
Data charts deliver a visual display of
data translated into lines charts and
bar graphs which can also be
combined to deliver a better
translations of the data. This is an
important visual communication
medium as it delivers a visual
translataion of data (O'Rourke et al.,
2008). It is important to translate
numeric data into visuals as it helps
identify trends thus allowing the
viewer understand the information in
an easier manner. It is also advisable to provide multiple visual charts which translate the data
using different visual display thus catering to each individual’s understanding.
By observing the Data given below which was used to generate the above graphs, it quickly
becomes clear that translating or understanding raw numeric data entries on a excel sheet can be
difficult.
Document Page
To simplify understanding numeric data it is important to convert the data into visual line charts,
bar graphs and pie charts among many other visual communication medium to deliver better
understanding. This makes data translation and understanding easier which makes it an important
business communication tool that managers must use (Graham & Baize, 2011). Clear
communication will ensure accuracy and better output thus making visual communication a
priority which every manager or organisation must utilize to improve their own as well as the
organisations overall performance growth and development.
Document Page
References:
Graham, M. & Baize, K., 2011. Executive Thinking: From Brightness to Brilliance.
Bloomington: iUniverse.
Kaul, A., 2014. Effective Business Communication. 2nd ed. New Delhi: PHI Learning Pvt. Ltd.
O'Rourke, J., Sedlack, R., Shwom, B. & Keller, K., 2008. Module 2: Graphics and Visual
Communication for Managers. Mason: Cengage Learning.
chevron_up_icon
1 out of 4
circle_padding
hide_on_mobile
zoom_out_icon
[object Object]