Business Data Analysis: Gender and Salary Case Study, BU1007

Verified

Added on  2020/03/04

|13
|840
|46
Case Study
AI Summary
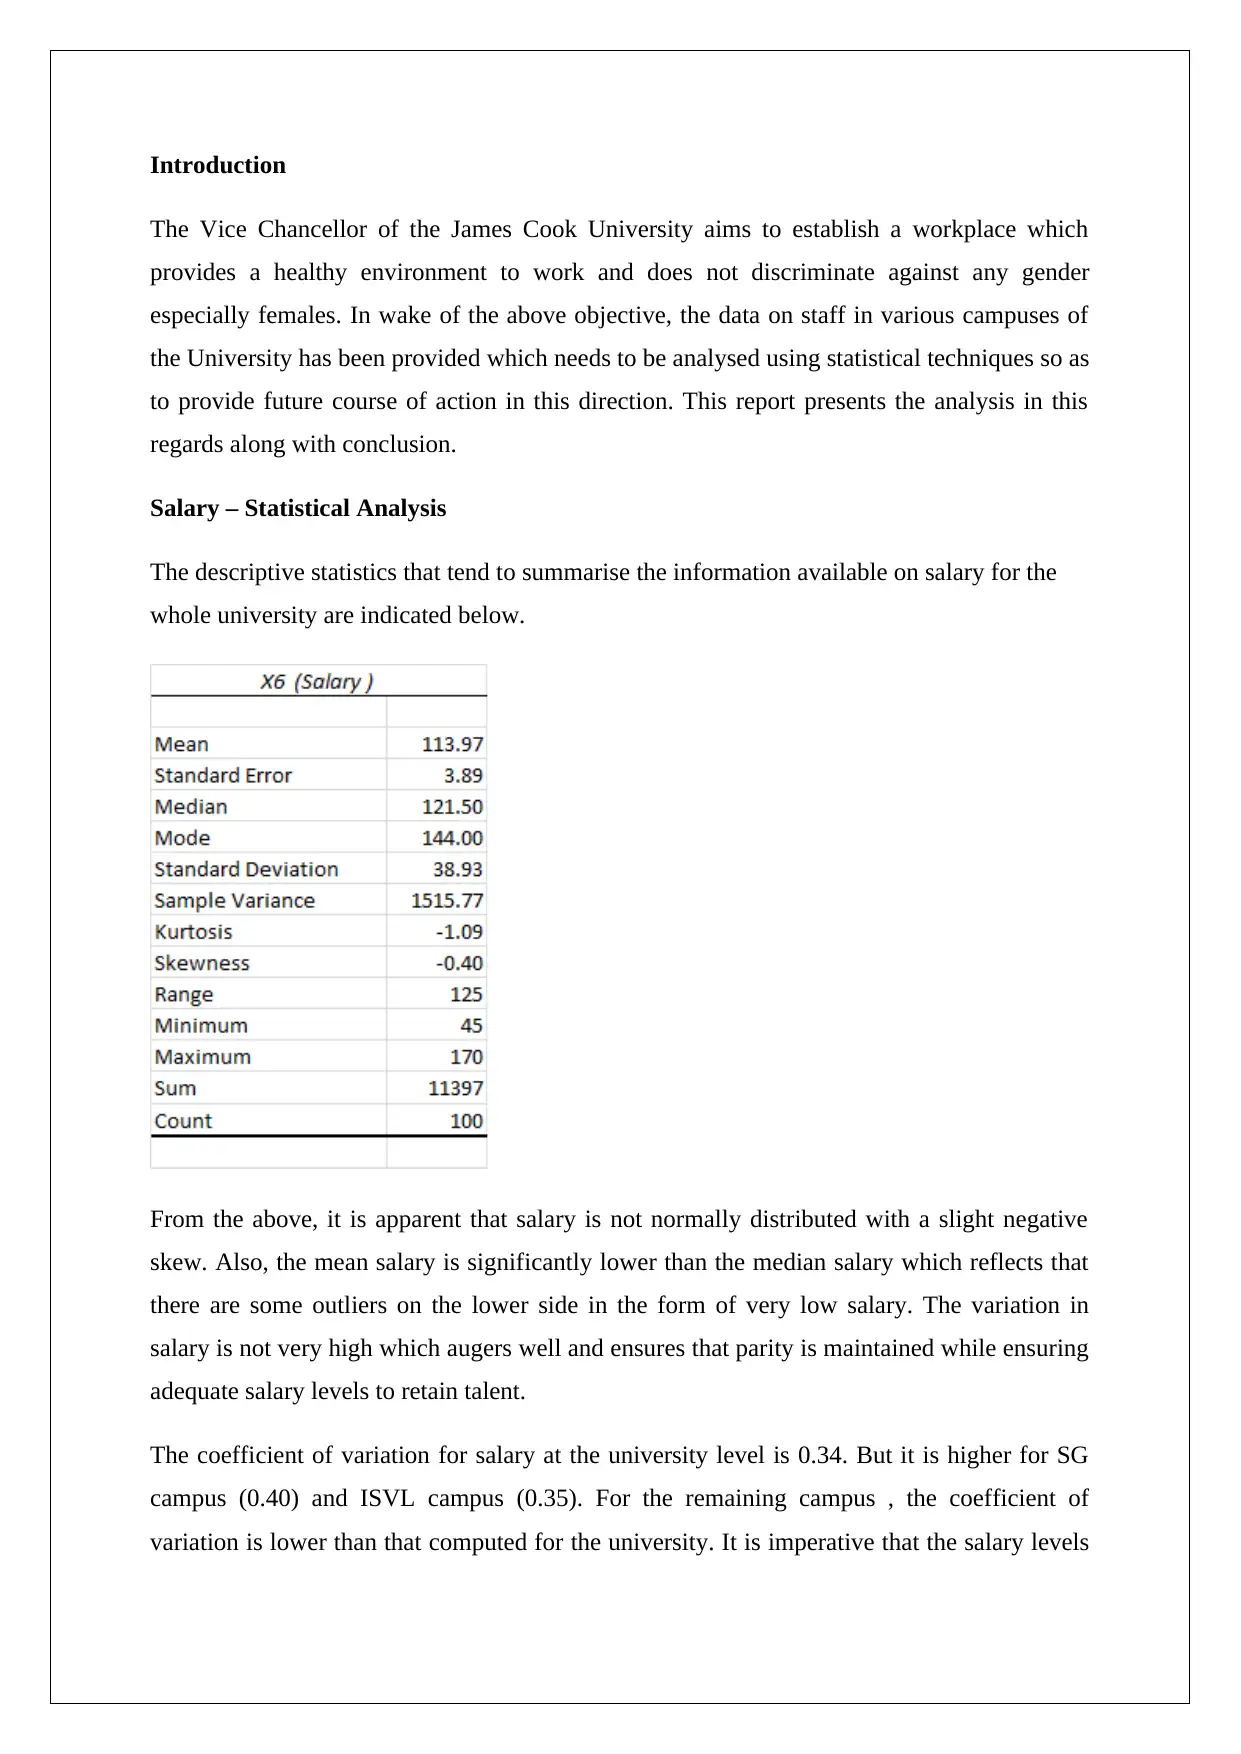
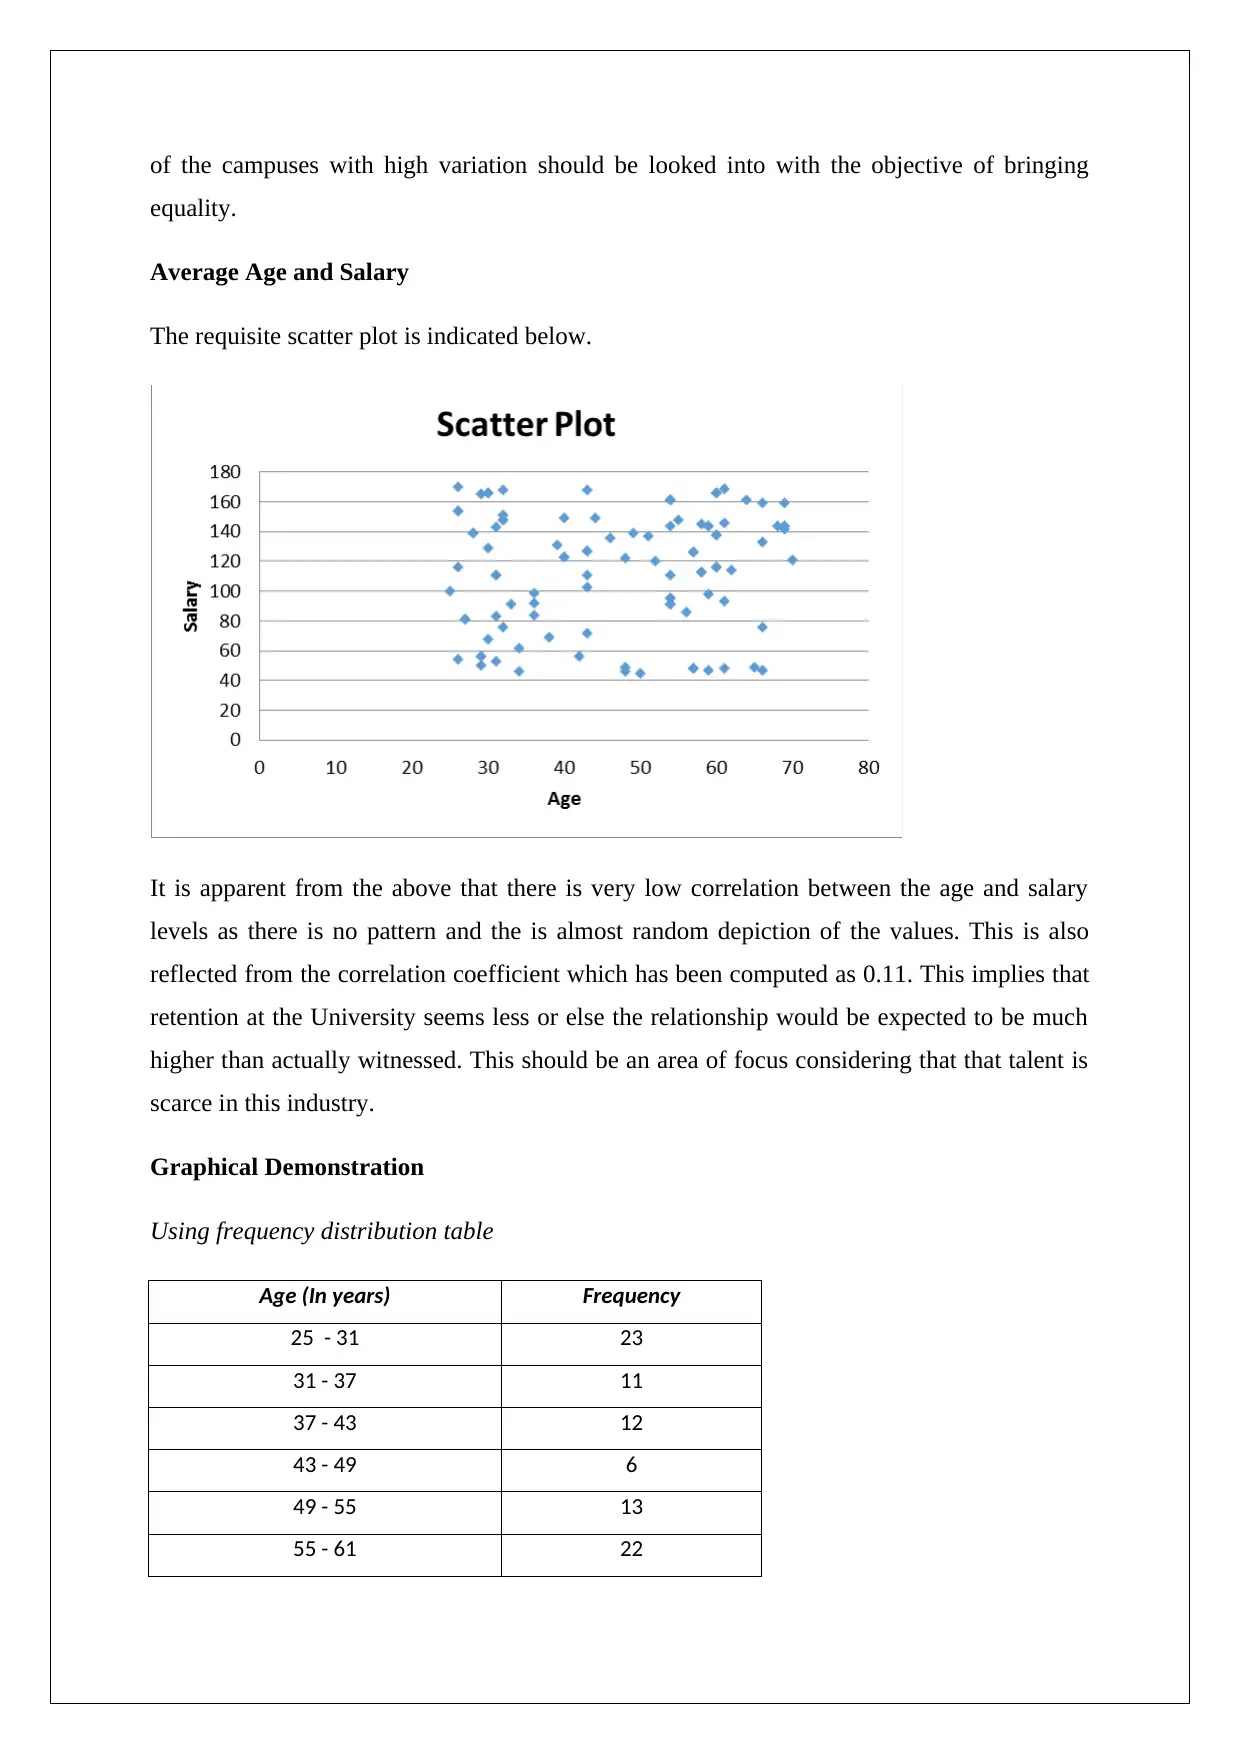
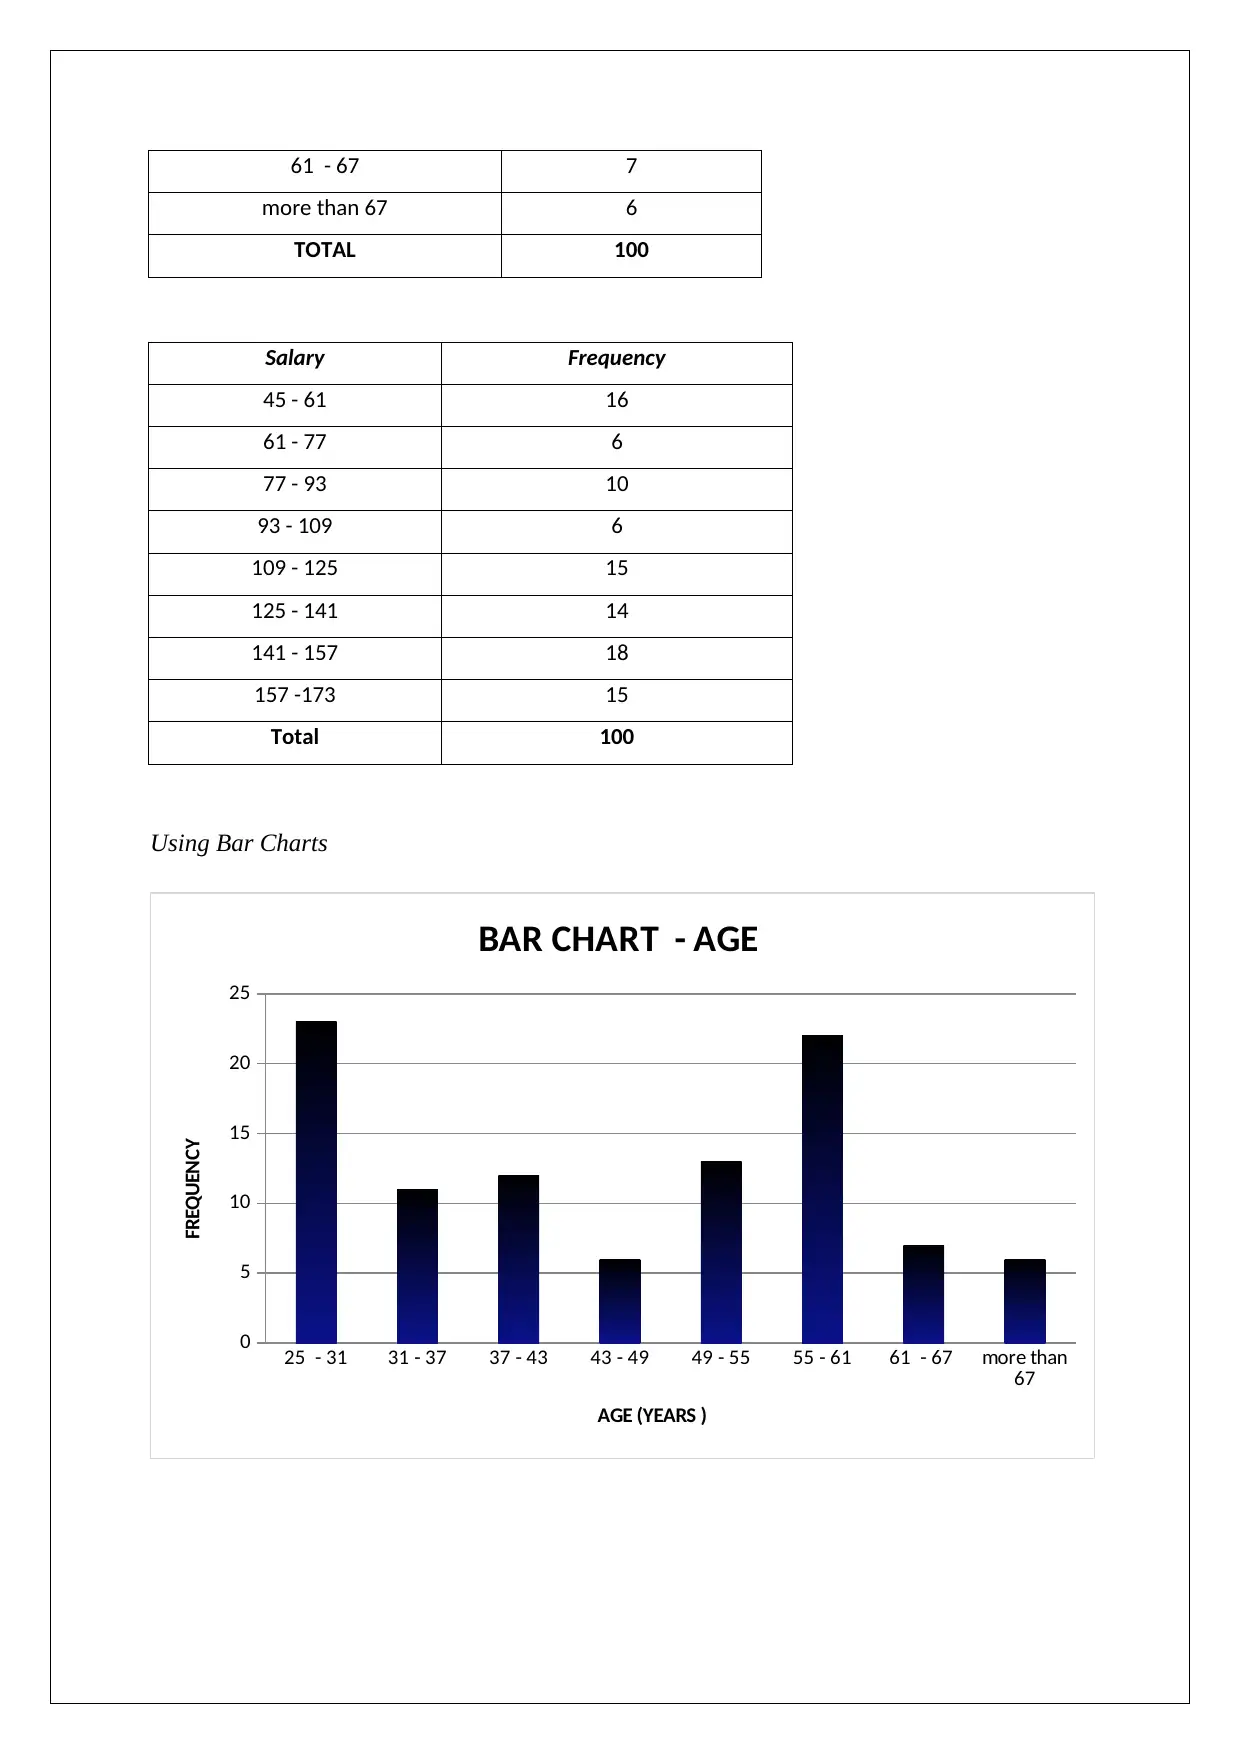
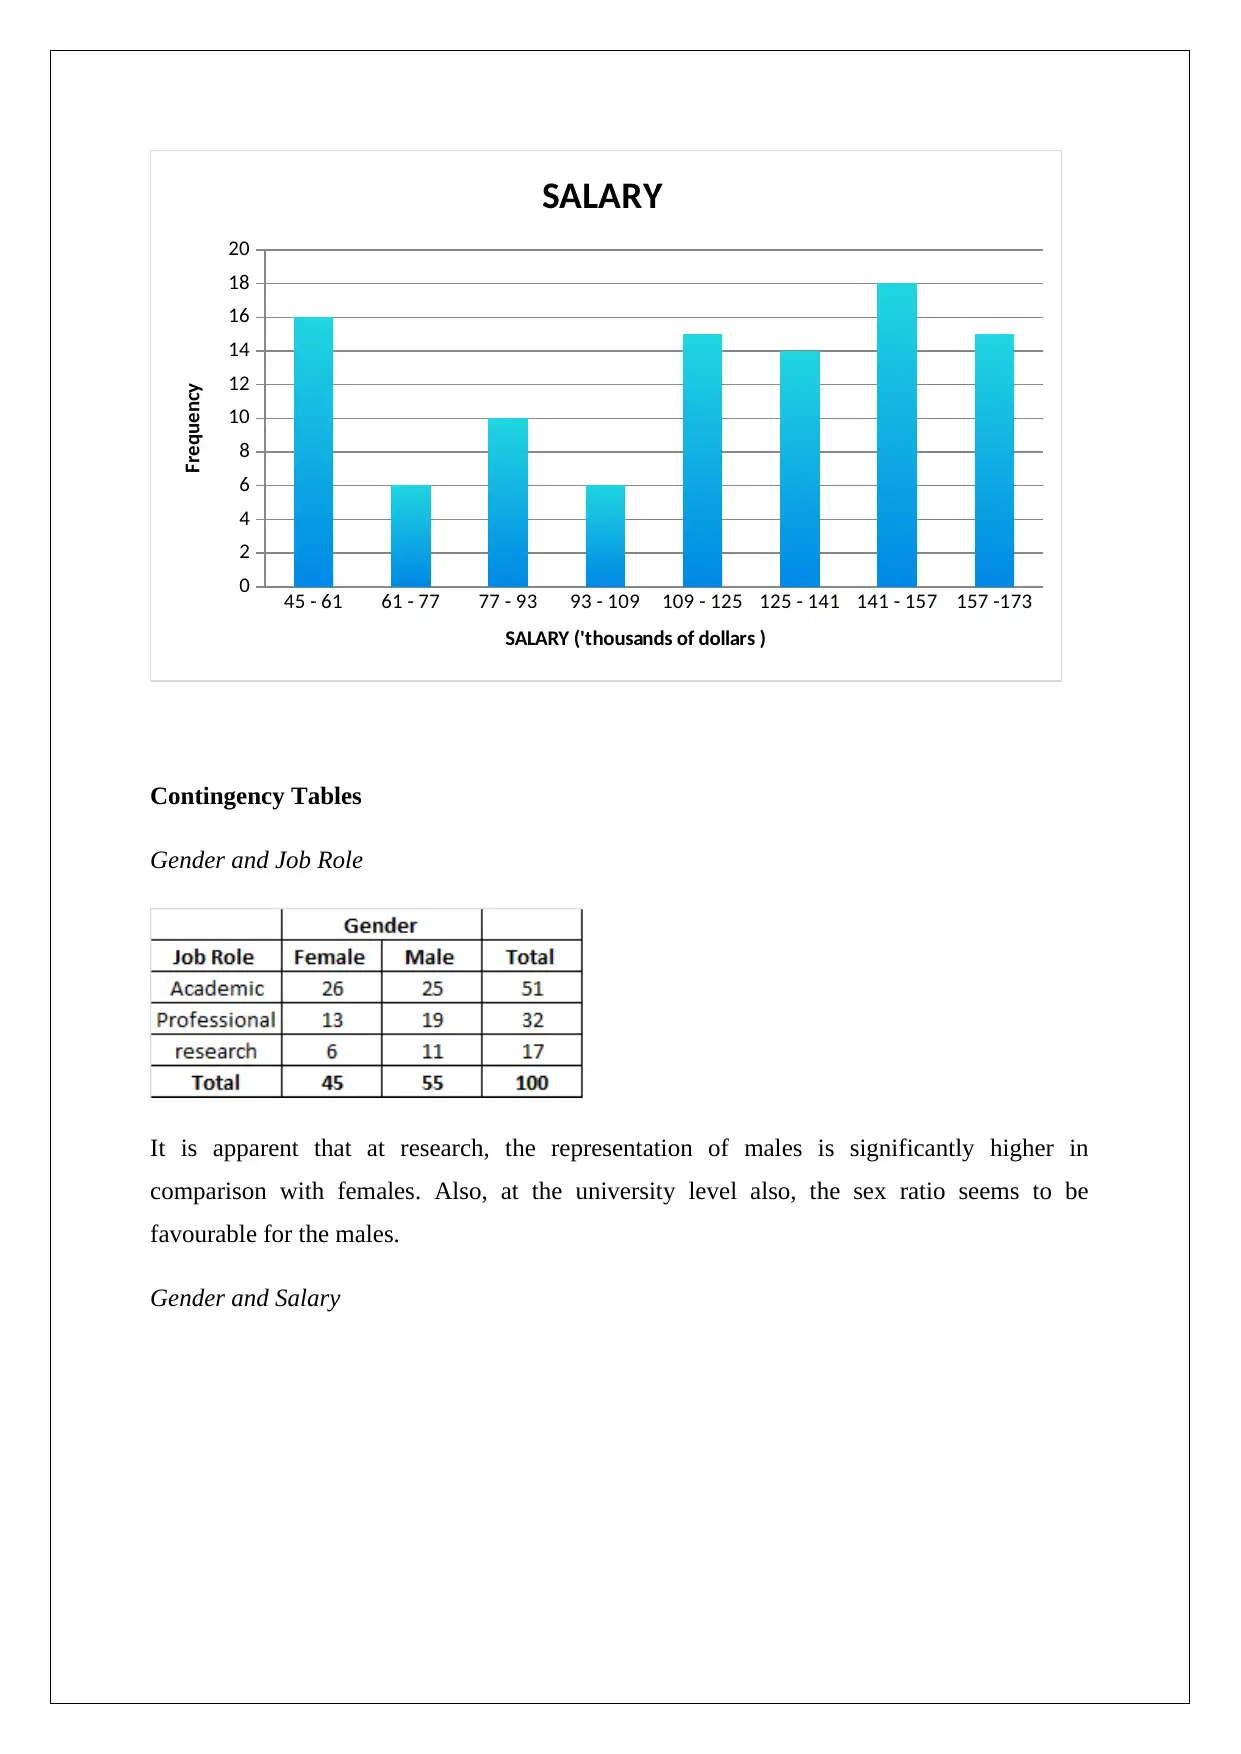
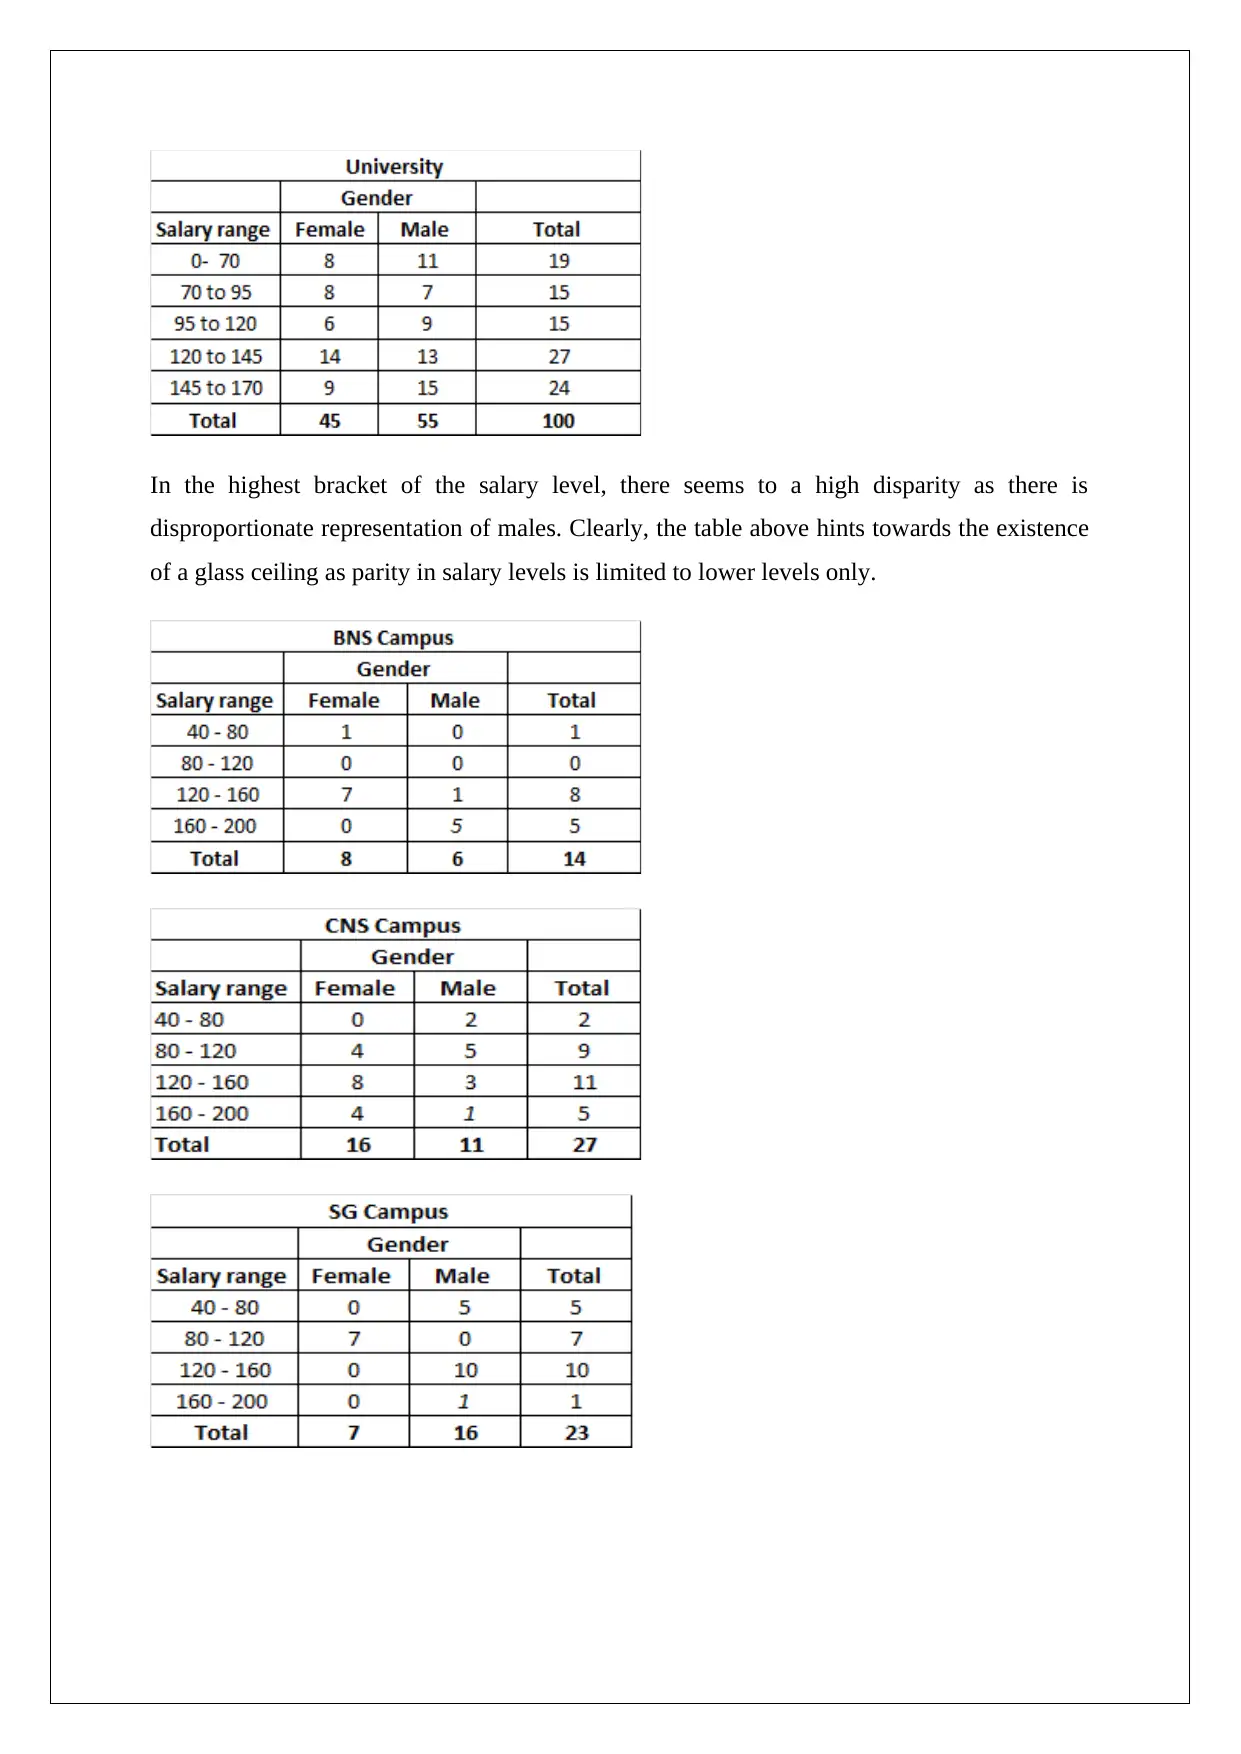
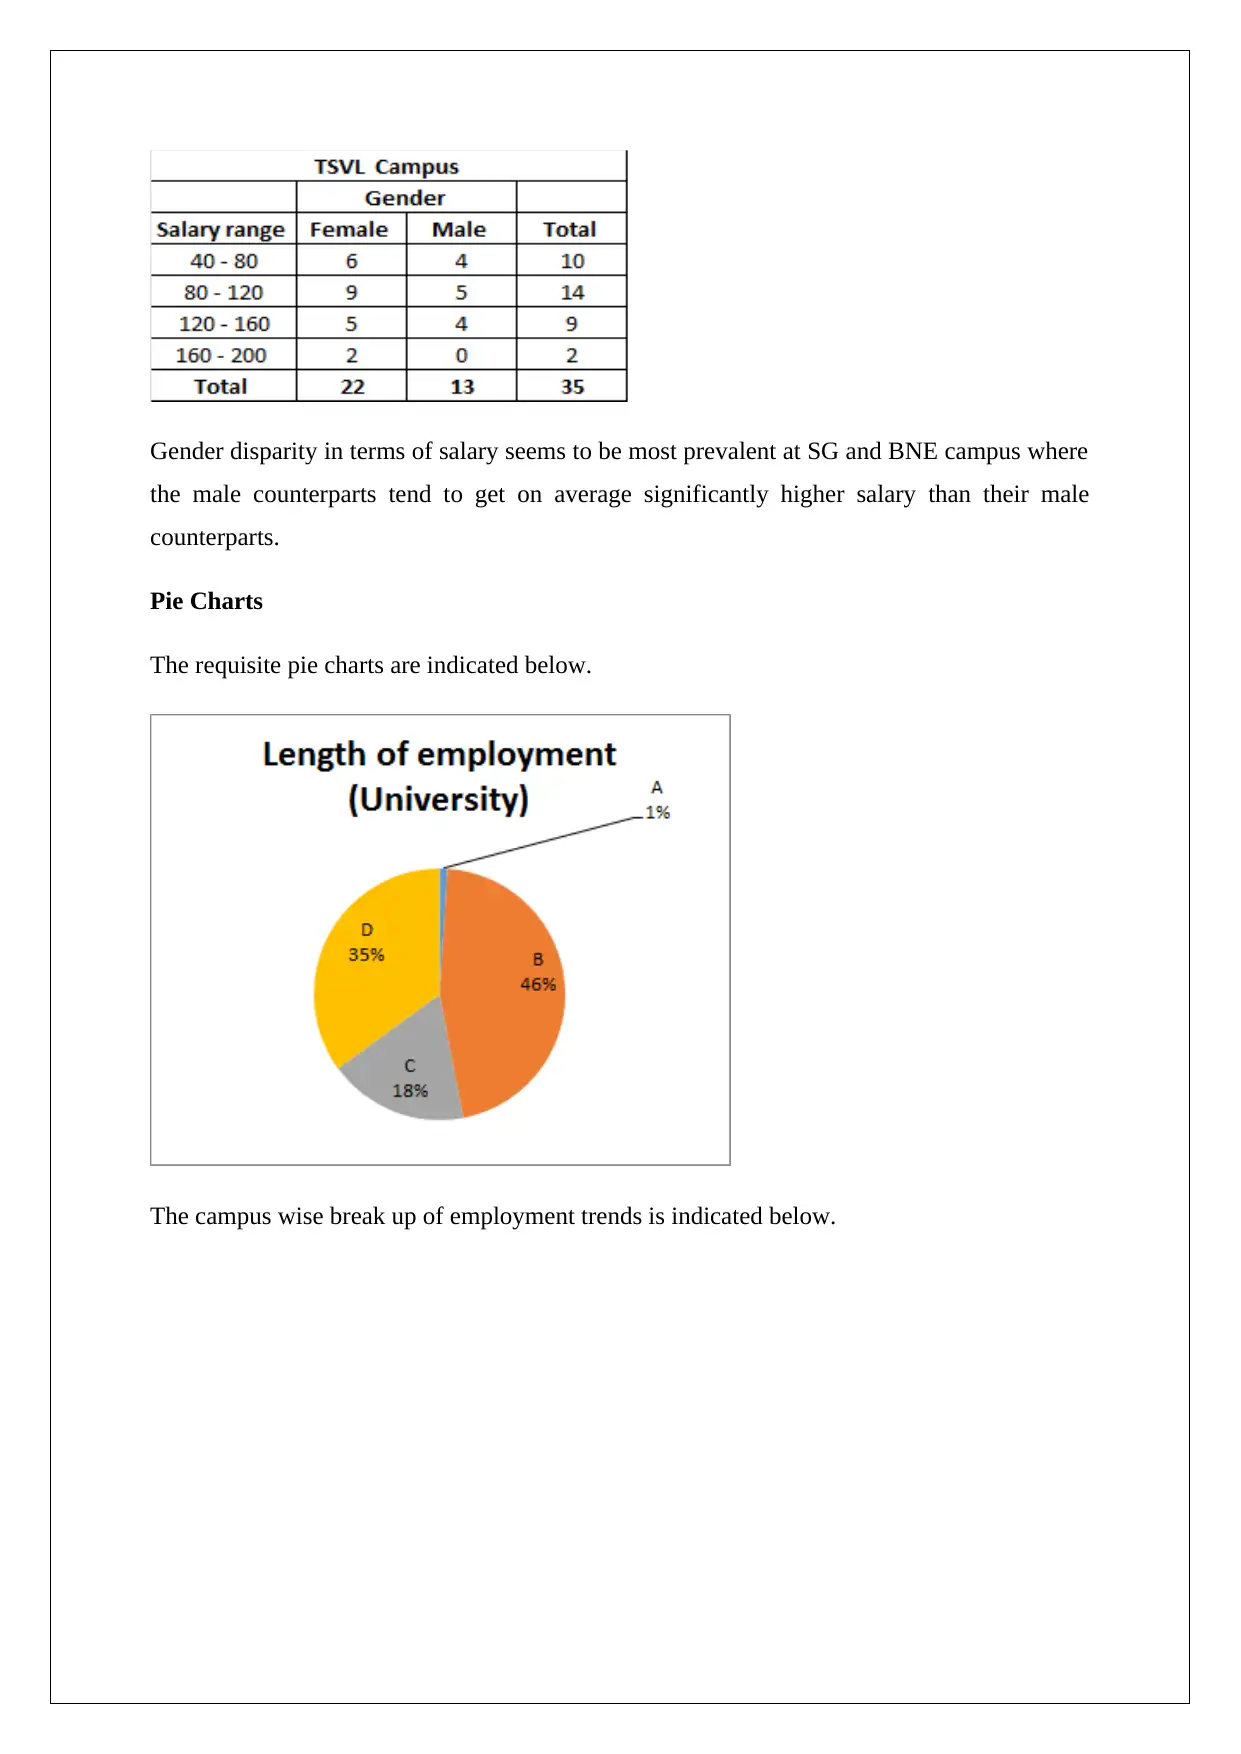
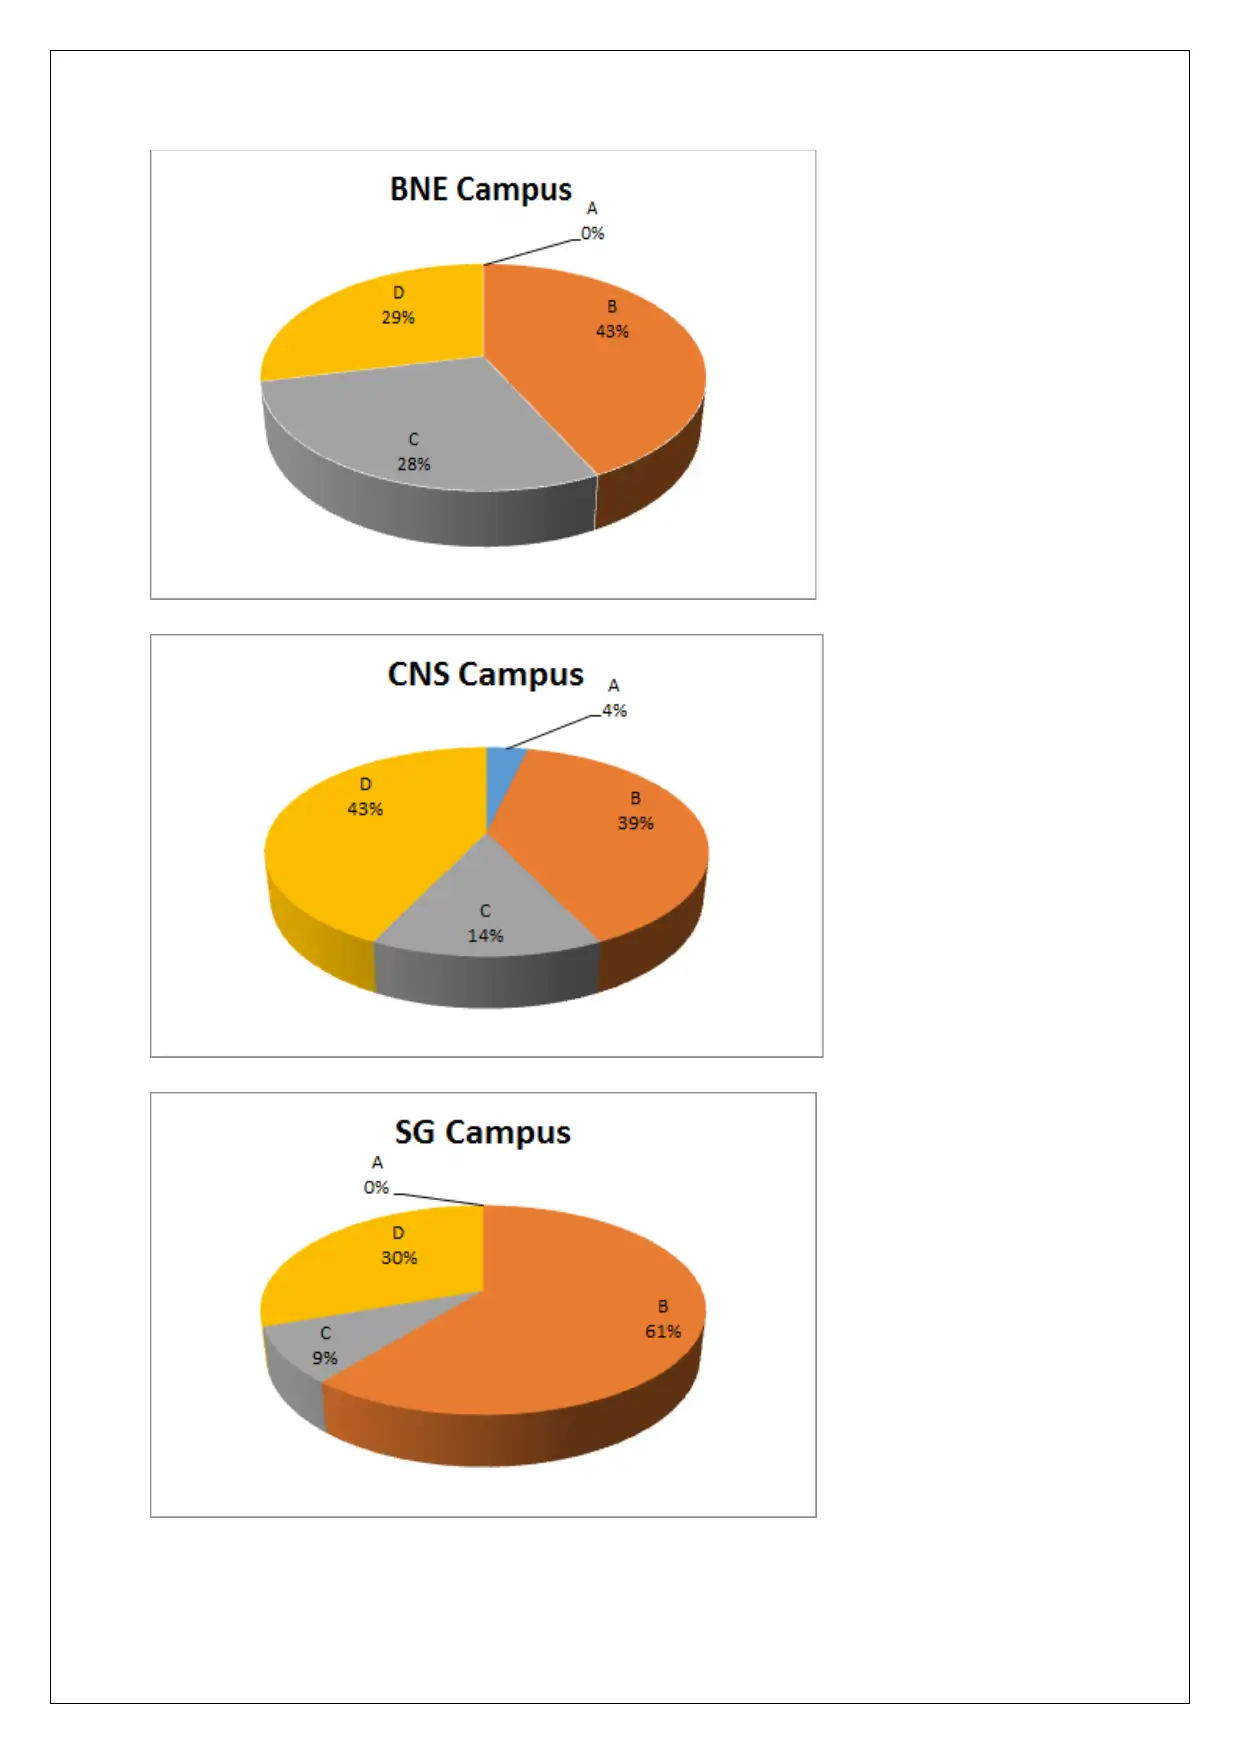
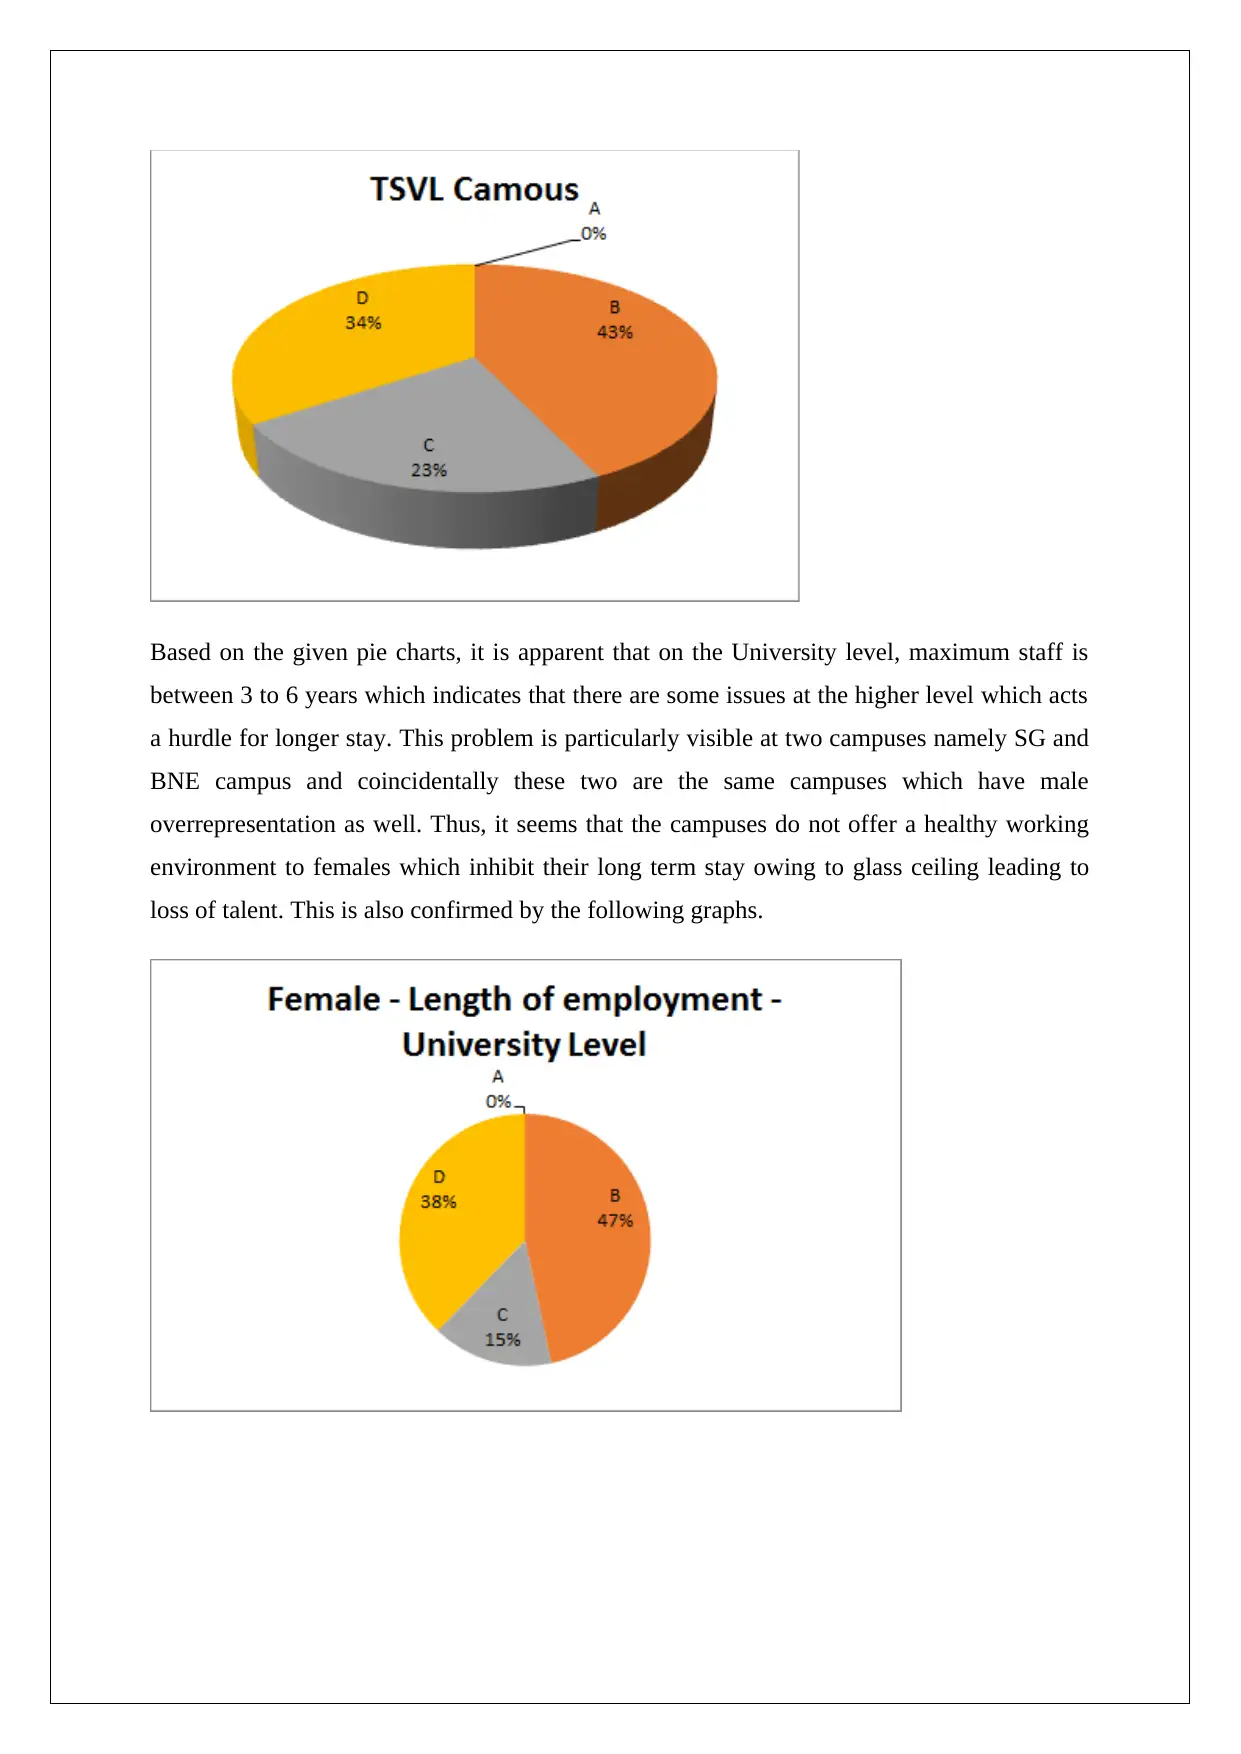
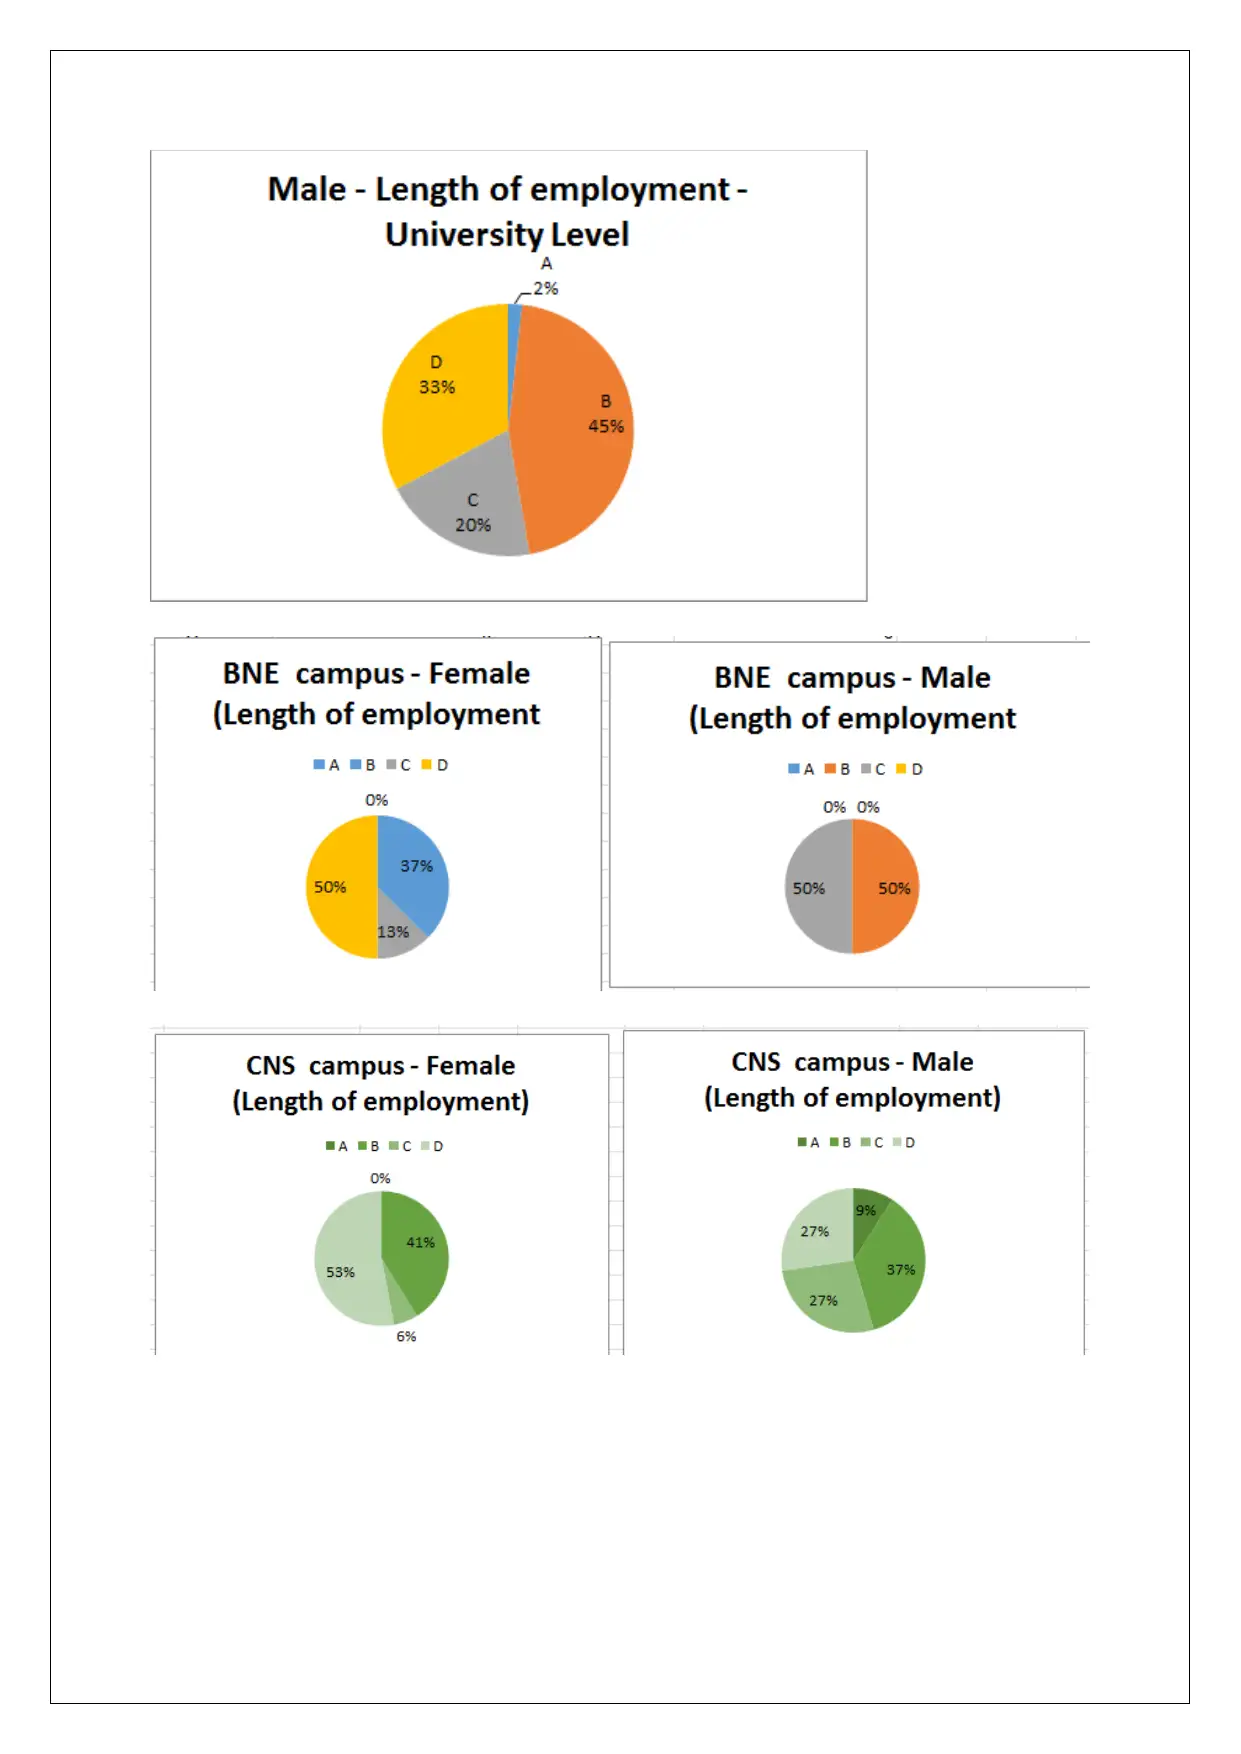
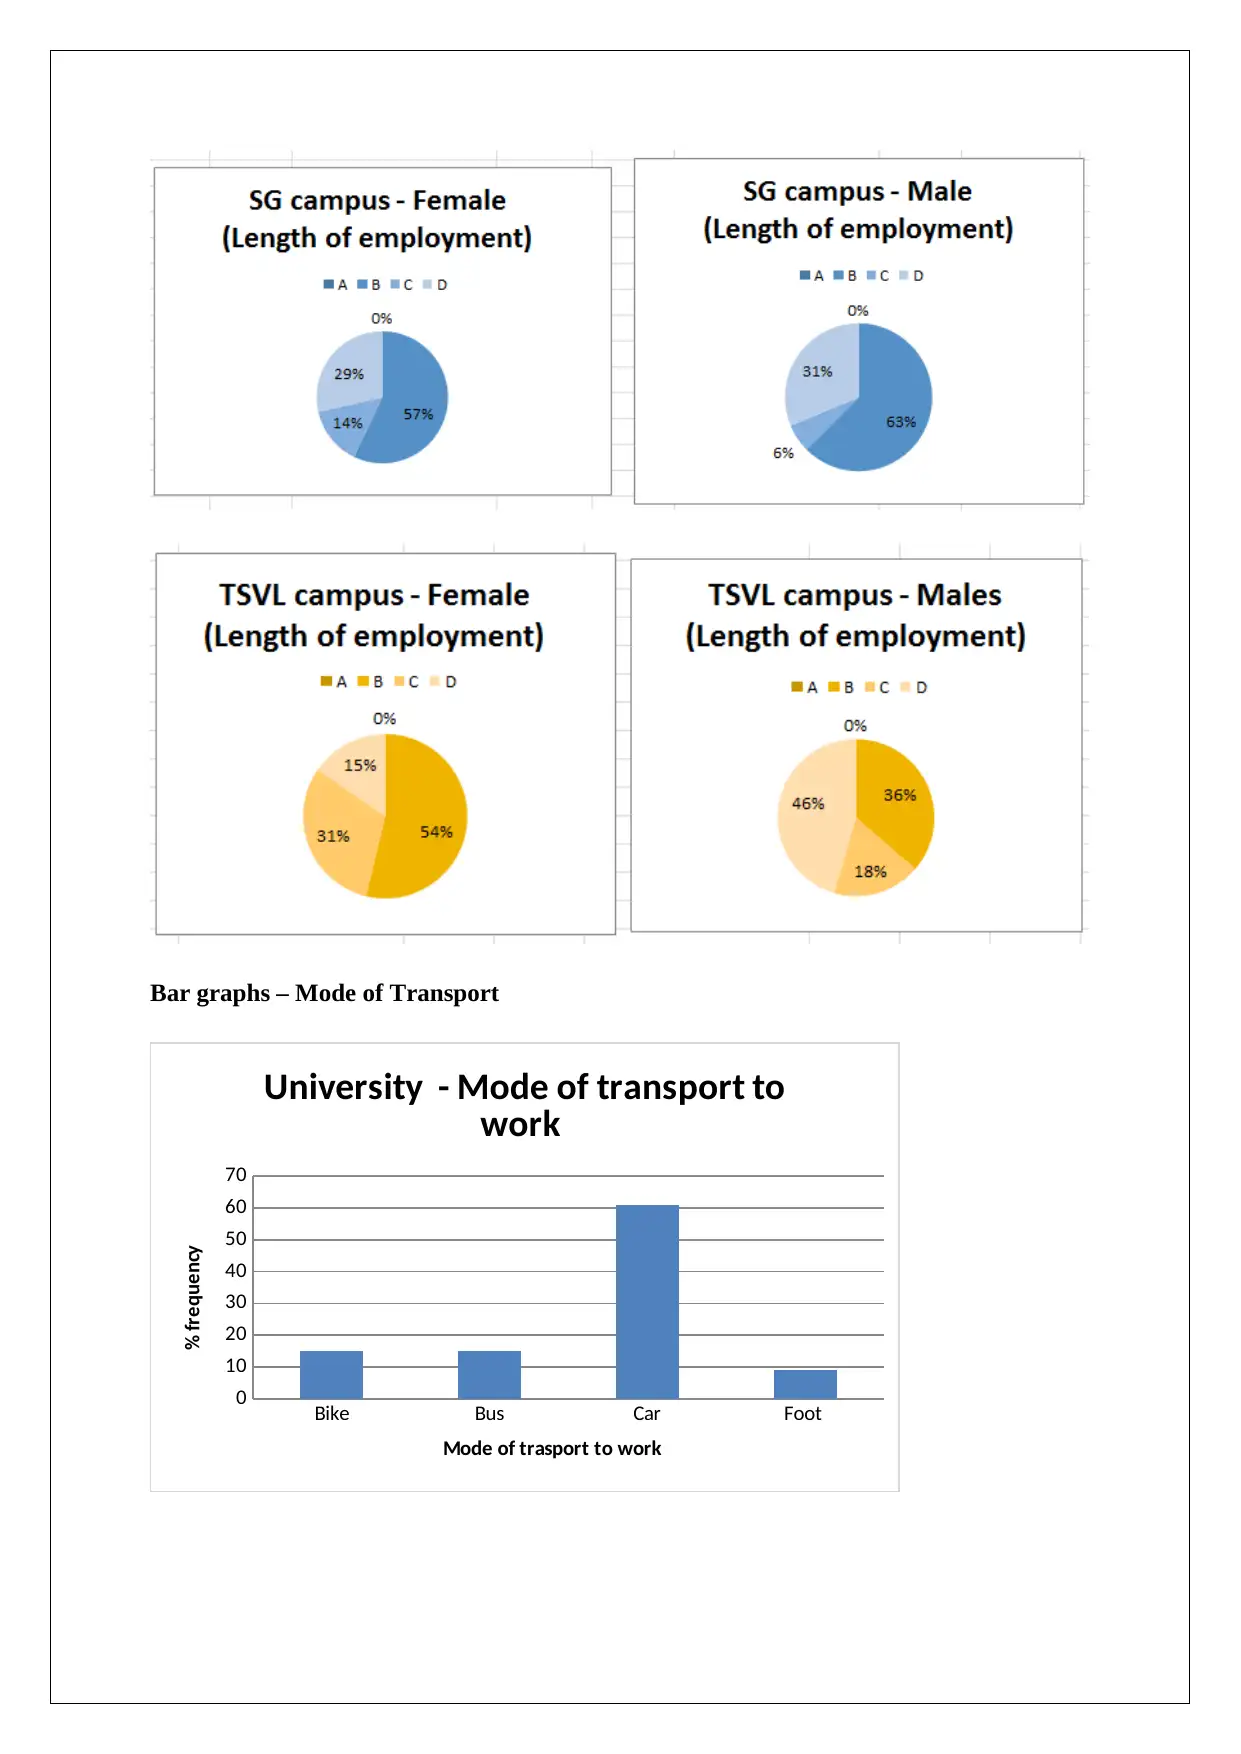
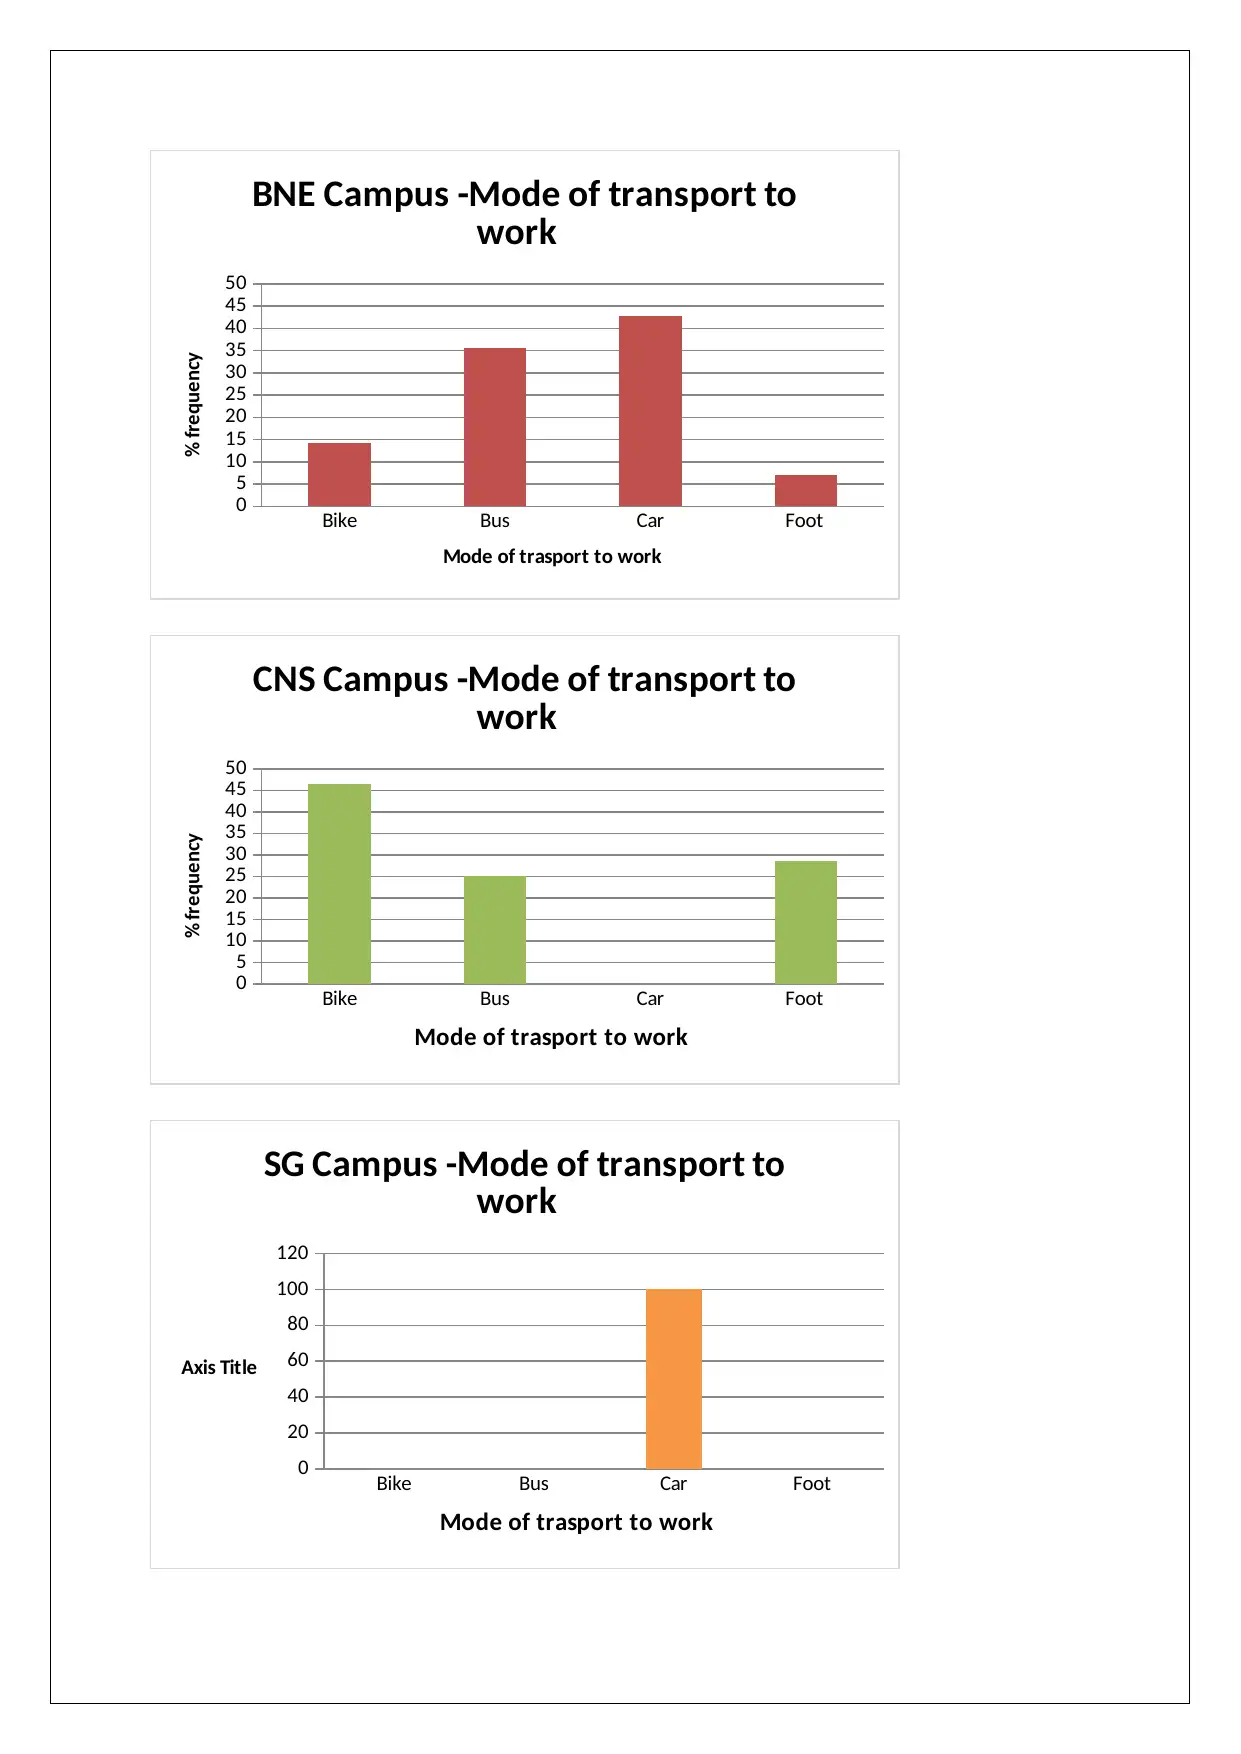
This case study analyzes staff data from James Cook University to assess gender equality in the workplace, focusing on salary disparities and workplace environment. The analysis includes descriptive statistics of salary, revealing a negative skew and lower mean compared to median, indicating potential outliers. Scatter plots and correlation coefficients examine the relationship between age and salary. Frequency distribution tables, bar charts, and contingency tables are used to illustrate gender representation across job roles and salary levels, highlighting potential gender imbalances and the existence of a "glass ceiling" in certain campuses. Pie charts show campus-wise employment trends, indicating issues that inhibit long-term female staff retention. The study concludes that while lower-level gender parity exists, disparities appear at higher levels, with specific campuses showing significant differences in treatment between genders. The report recommends addressing these concerns and providing incentives to retain staff, a crucial resource for the university.
Document Page
BUSINESS DATA ANALYSIS AND INTERPRETATION
CASE STUDY FOR BU1007
STUDENT ID
[Pick the date]
tabler-icon-diamond-filled.svg

Paraphrase This Document

Need a fresh take? Get an instant paraphrase of this document with our AI Paraphraser
Document Page
Introduction
The Vice Chancellor of the James Cook University aims to establish a workplace which
provides a healthy environment to work and does not discriminate against any gender
especially females. In wake of the above objective, the data on staff in various campuses of
the University has been provided which needs to be analysed using statistical techniques so as
to provide future course of action in this direction. This report presents the analysis in this
regards along with conclusion.
Salary – Statistical Analysis
The descriptive statistics that tend to summarise the information available on salary for the
whole university are indicated below.
From the above, it is apparent that salary is not normally distributed with a slight negative
skew. Also, the mean salary is significantly lower than the median salary which reflects that
there are some outliers on the lower side in the form of very low salary. The variation in
salary is not very high which augers well and ensures that parity is maintained while ensuring
adequate salary levels to retain talent.
The coefficient of variation for salary at the university level is 0.34. But it is higher for SG
campus (0.40) and ISVL campus (0.35). For the remaining campus , the coefficient of
variation is lower than that computed for the university. It is imperative that the salary levels
Document Page
of the campuses with high variation should be looked into with the objective of bringing
equality.
Average Age and Salary
The requisite scatter plot is indicated below.
It is apparent from the above that there is very low correlation between the age and salary
levels as there is no pattern and the is almost random depiction of the values. This is also
reflected from the correlation coefficient which has been computed as 0.11. This implies that
retention at the University seems less or else the relationship would be expected to be much
higher than actually witnessed. This should be an area of focus considering that that talent is
scarce in this industry.
Graphical Demonstration
Using frequency distribution table
Age (In years) Frequency
25 - 31 23
31 - 37 11
37 - 43 12
43 - 49 6
49 - 55 13
55 - 61 22
Document Page
61 - 67 7
more than 67 6
TOTAL 100
Salary Frequency
45 - 61 16
61 - 77 6
77 - 93 10
93 - 109 6
109 - 125 15
125 - 141 14
141 - 157 18
157 -173 15
Total 100
Using Bar Charts
25 - 31 31 - 37 37 - 43 43 - 49 49 - 55 55 - 61 61 - 67 more than
67
0
5
10
15
20
25
BAR CHART - AGE
AGE (YEARS )
FREQUENCY
tabler-icon-diamond-filled.svg

Paraphrase This Document

Need a fresh take? Get an instant paraphrase of this document with our AI Paraphraser
Document Page
45 - 61 61 - 77 77 - 93 93 - 109 109 - 125 125 - 141 141 - 157 157 -173
0
2
4
6
8
10
12
14
16
18
20
SALARY
SALARY ('thousands of dollars )
Frequency
Contingency Tables
Gender and Job Role
It is apparent that at research, the representation of males is significantly higher in
comparison with females. Also, at the university level also, the sex ratio seems to be
favourable for the males.
Gender and Salary
Document Page
In the highest bracket of the salary level, there seems to a high disparity as there is
disproportionate representation of males. Clearly, the table above hints towards the existence
of a glass ceiling as parity in salary levels is limited to lower levels only.
Document Page
Gender disparity in terms of salary seems to be most prevalent at SG and BNE campus where
the male counterparts tend to get on average significantly higher salary than their male
counterparts.
Pie Charts
The requisite pie charts are indicated below.
The campus wise break up of employment trends is indicated below.
tabler-icon-diamond-filled.svg

Paraphrase This Document

Need a fresh take? Get an instant paraphrase of this document with our AI Paraphraser
Document Page
Document Page
Based on the given pie charts, it is apparent that on the University level, maximum staff is
between 3 to 6 years which indicates that there are some issues at the higher level which acts
a hurdle for longer stay. This problem is particularly visible at two campuses namely SG and
BNE campus and coincidentally these two are the same campuses which have male
overrepresentation as well. Thus, it seems that the campuses do not offer a healthy working
environment to females which inhibit their long term stay owing to glass ceiling leading to
loss of talent. This is also confirmed by the following graphs.
Document Page
tabler-icon-diamond-filled.svg

Paraphrase This Document

Need a fresh take? Get an instant paraphrase of this document with our AI Paraphraser
Document Page
Bar graphs – Mode of Transport
Bike Bus Car Foot
0
10
20
30
40
50
60
70
University - Mode of transport to
work
Mode of trasport to work
% frequency
Document Page
Bike Bus Car Foot
0
5
10
15
20
25
30
35
40
45
50
BNE Campus -Mode of transport to
work
Mode of trasport to work
% frequency
Bike Bus Car Foot
0
5
10
15
20
25
30
35
40
45
50
CNS Campus -Mode of transport to
work
Mode of trasport to work
% frequency
Bike Bus Car Foot
0
20
40
60
80
100
120
SG Campus -Mode of transport to
work
Mode of trasport to work
Axis Title
chevron_up_icon
1 out of 13
circle_padding
hide_on_mobile
zoom_out_icon
[object Object]