Business Practice Data Analysis Report: Insights and Recommendations
VerifiedAdded on 2023/01/11
|14
|2665
|77
Report
AI Summary
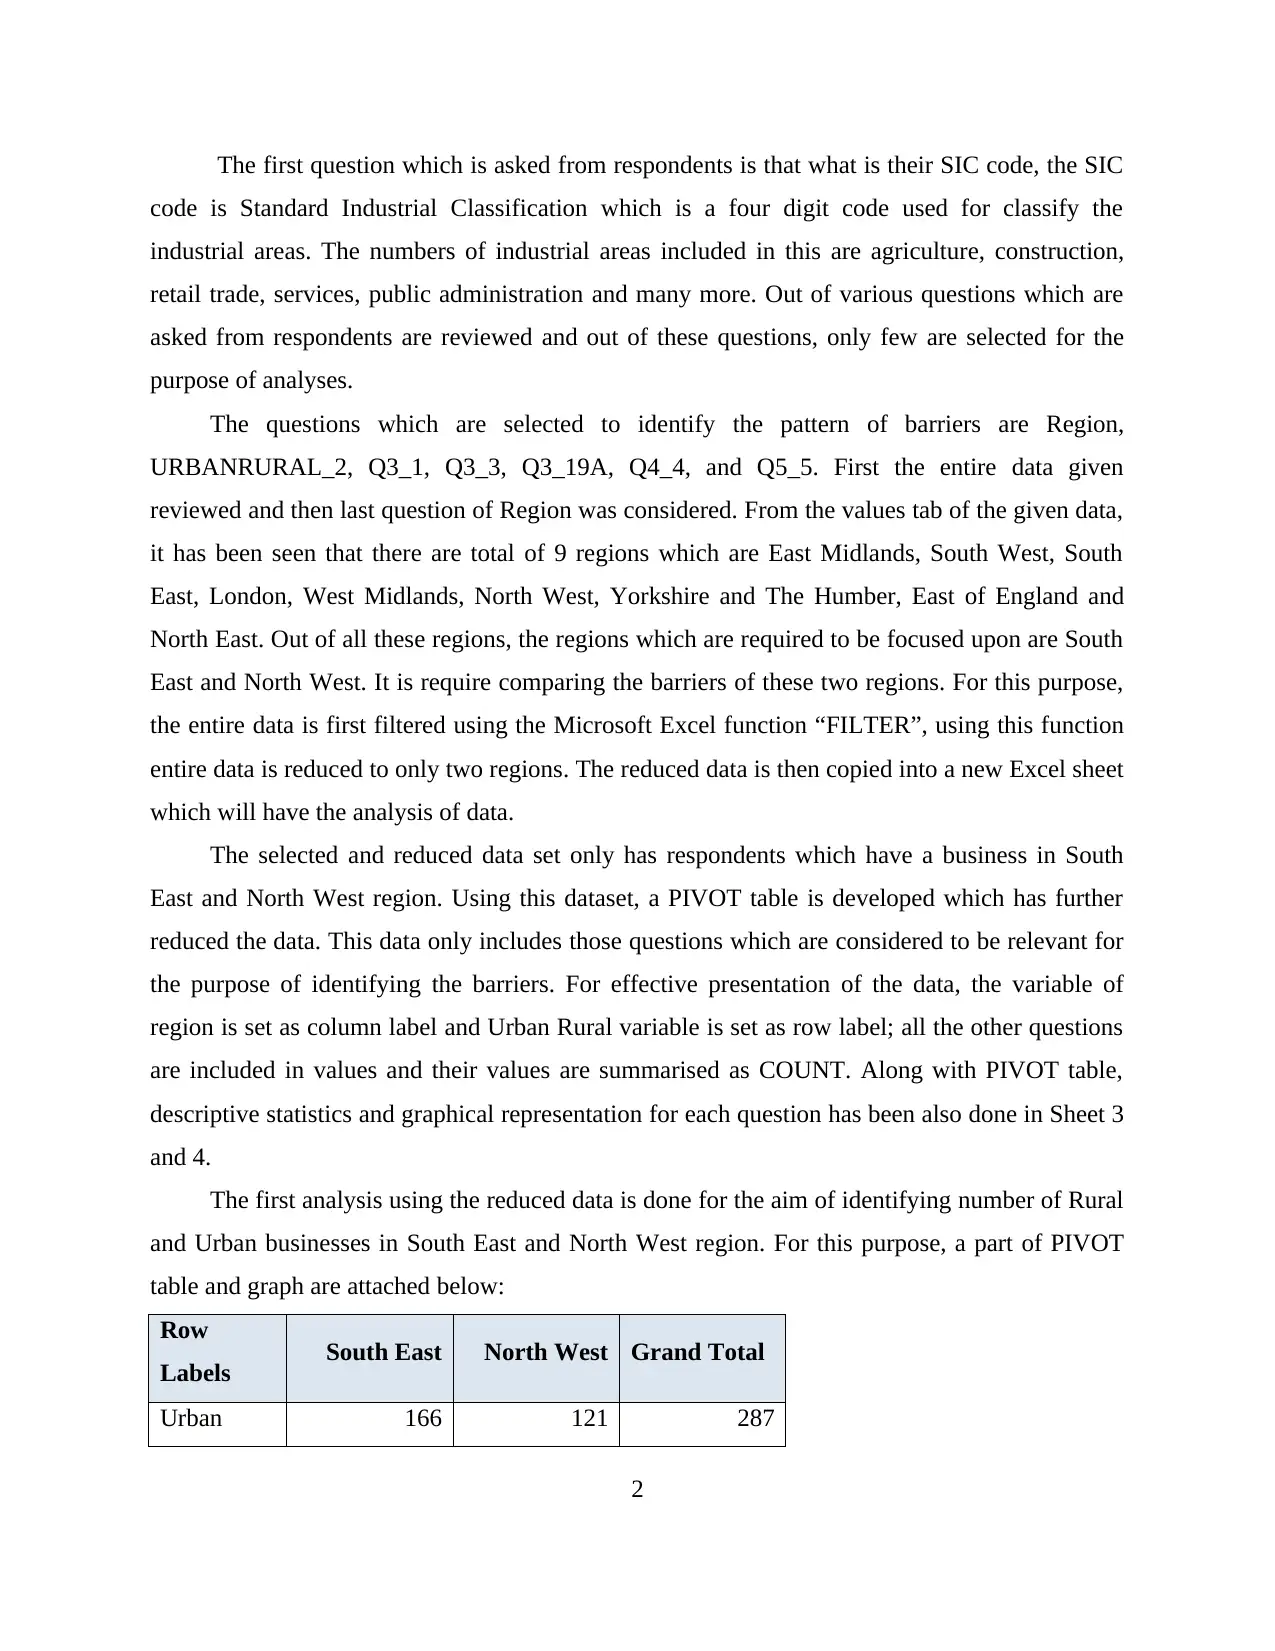
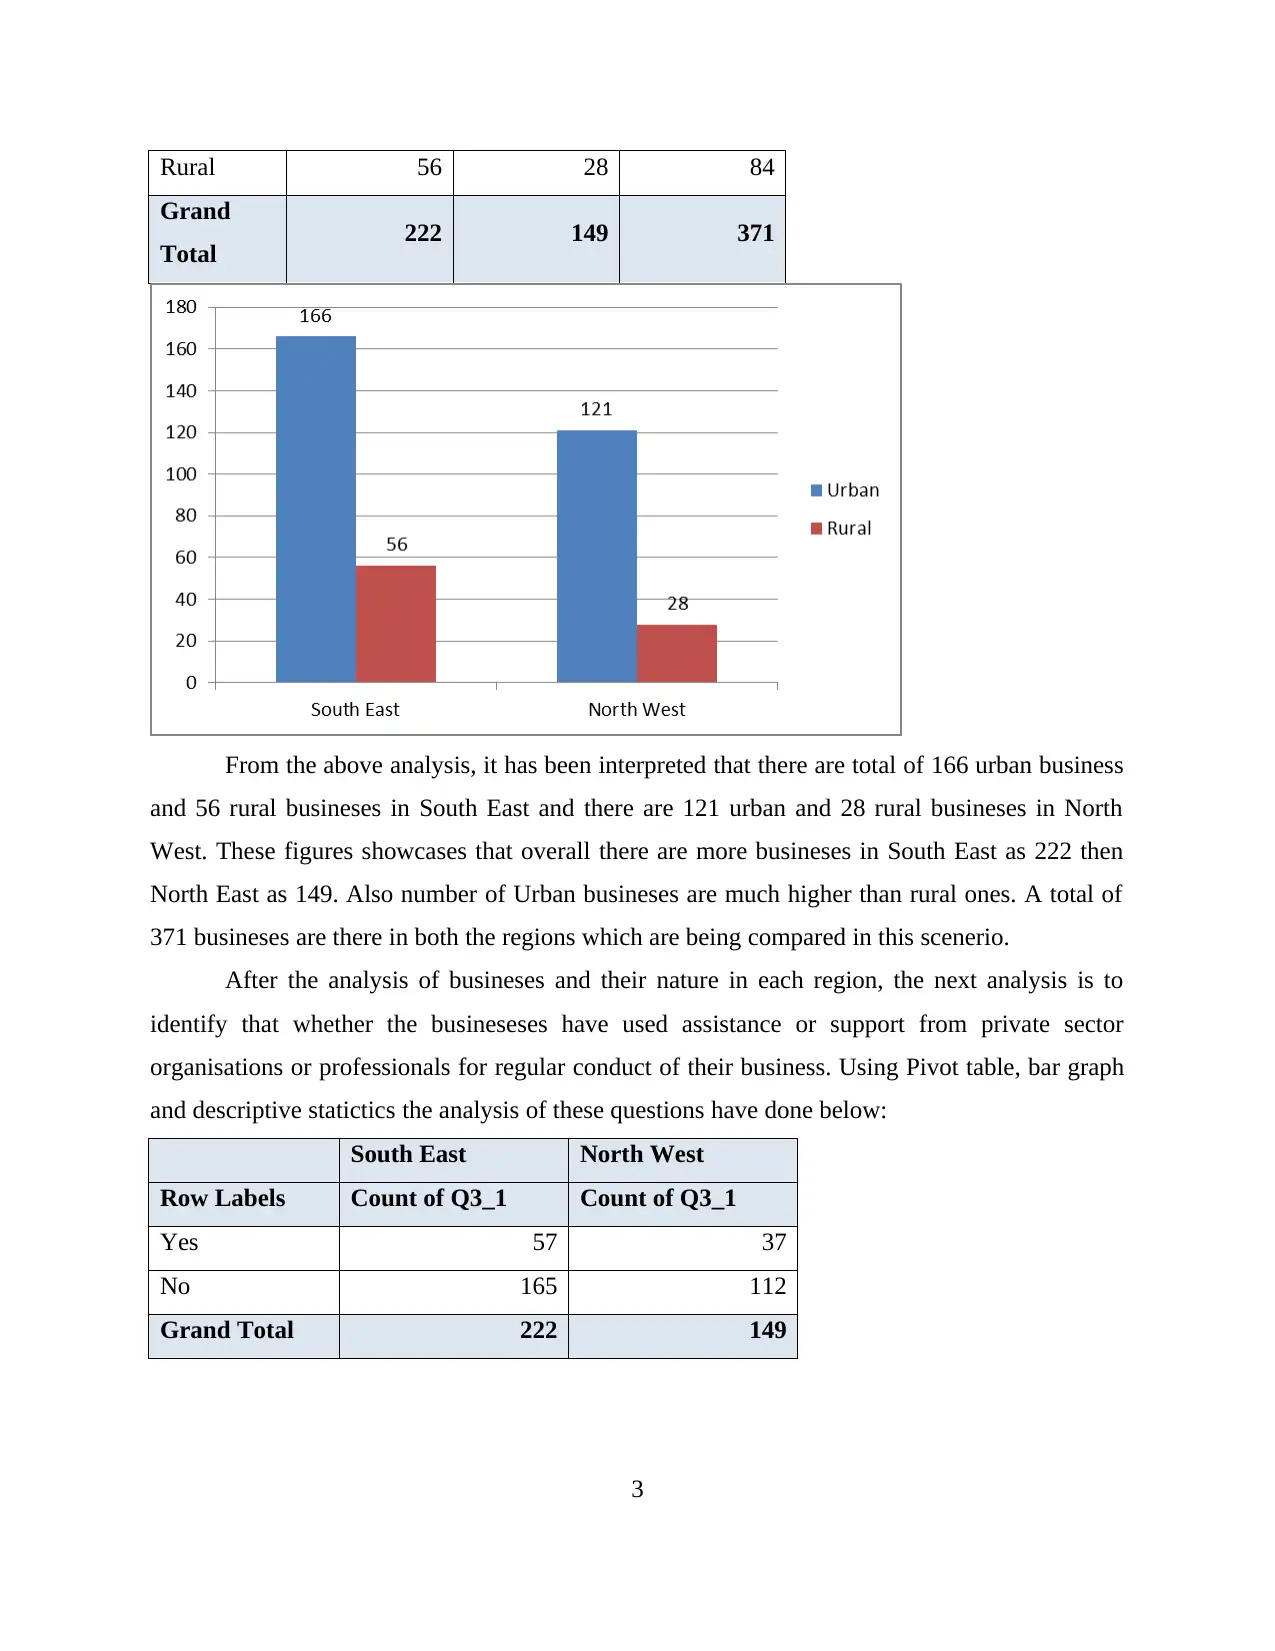
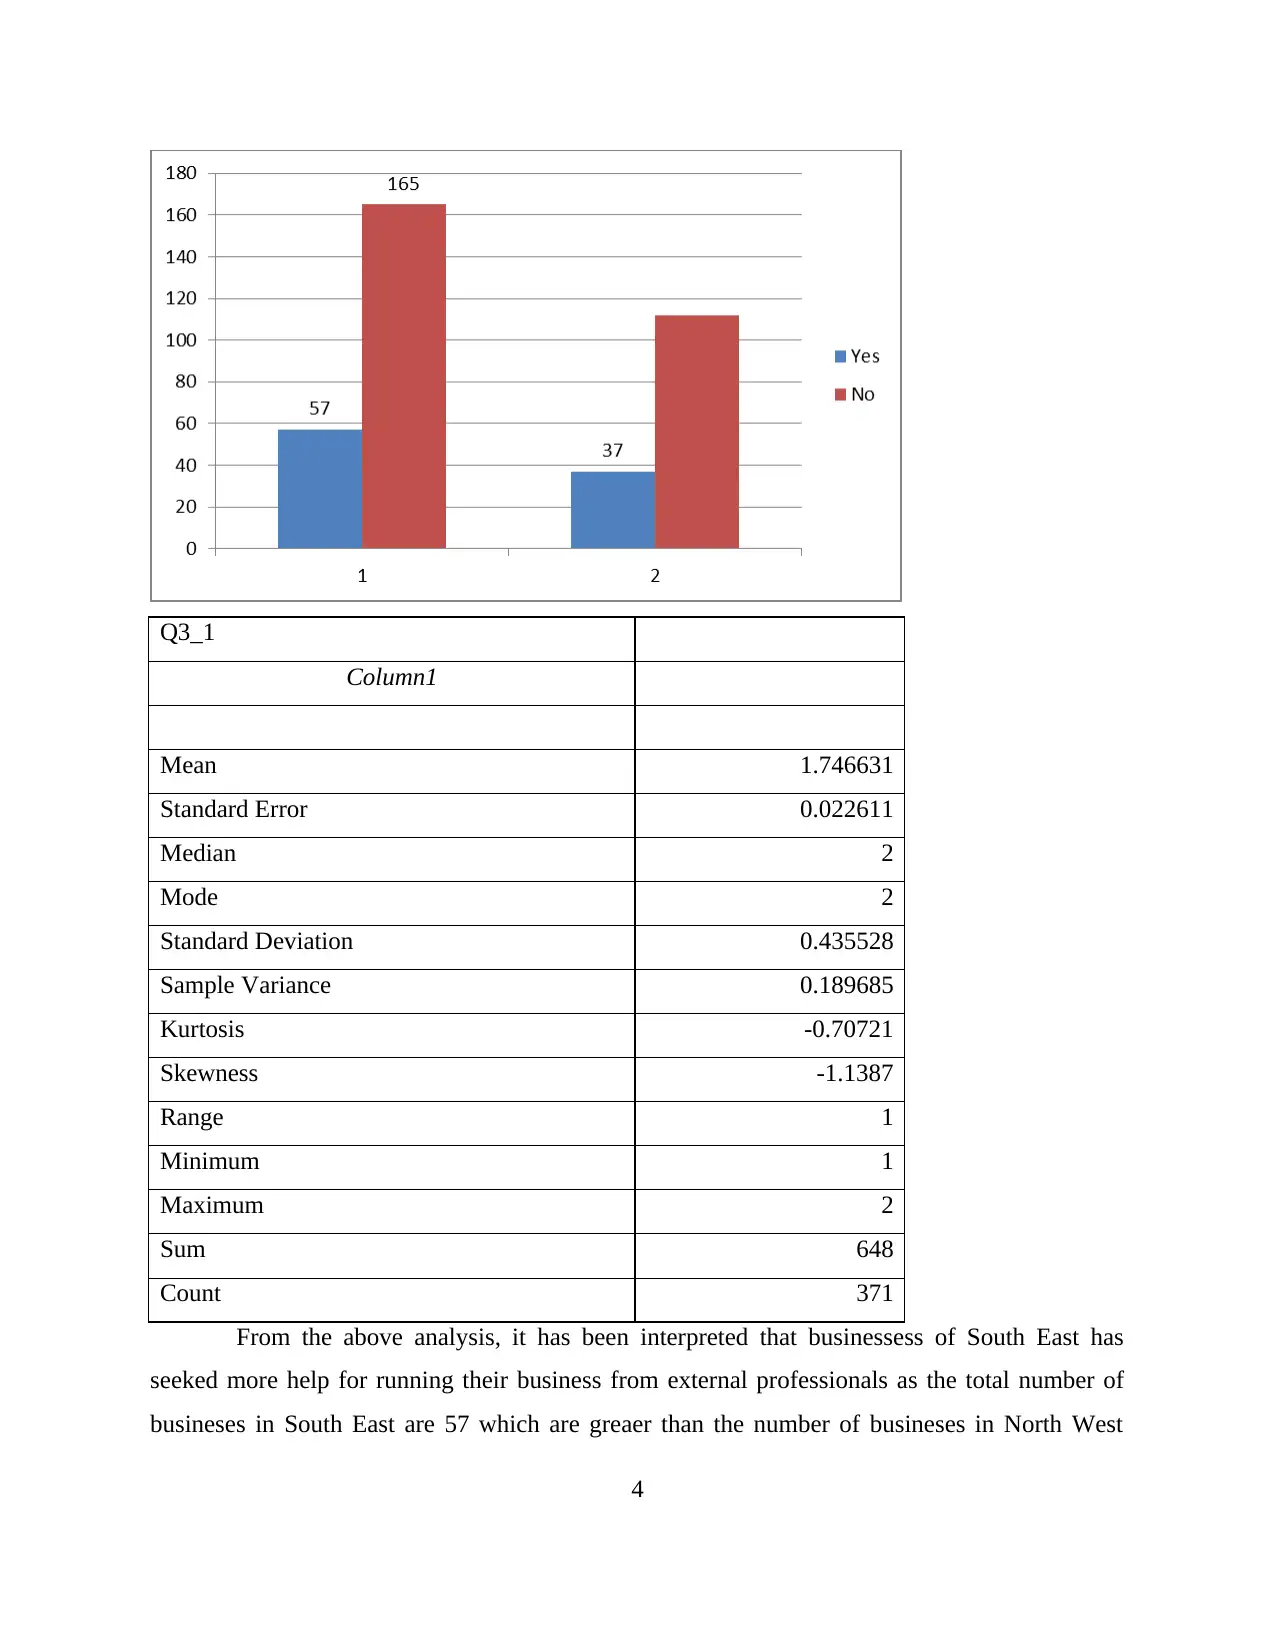
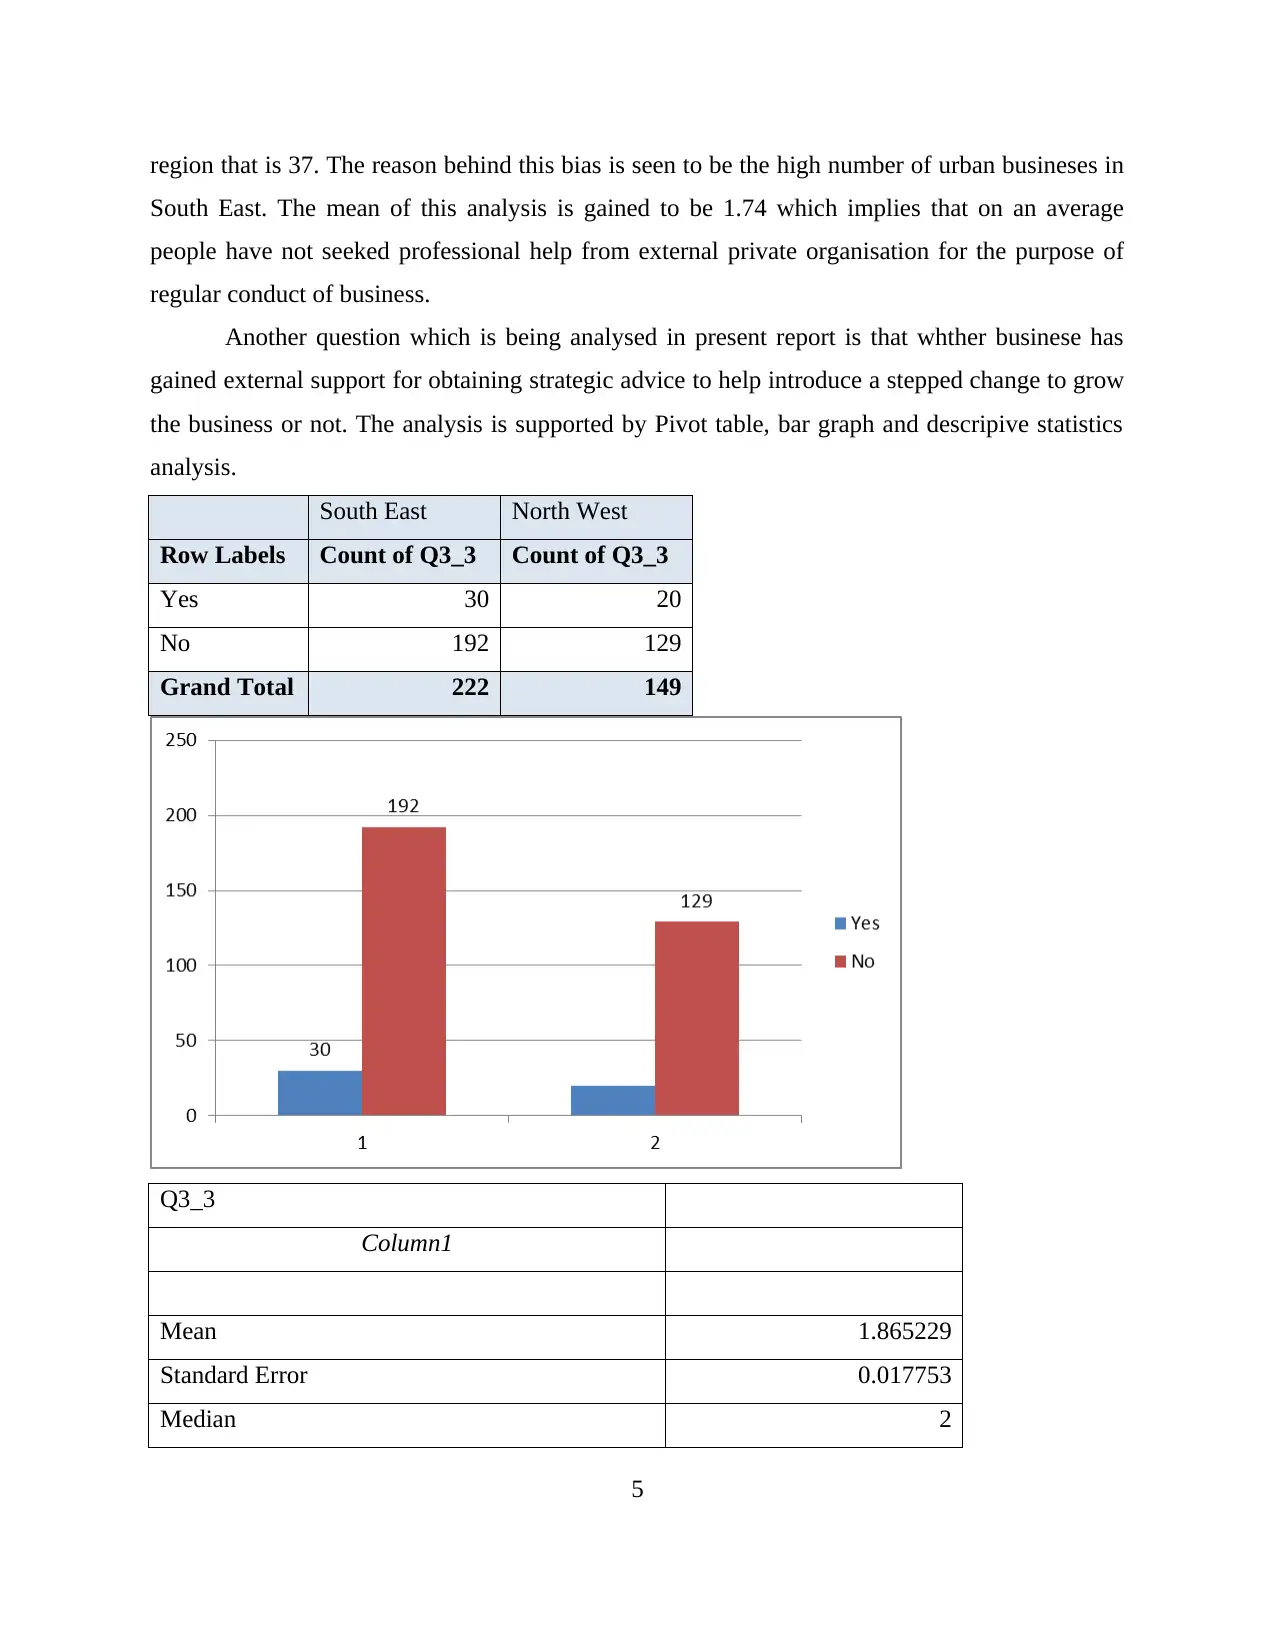
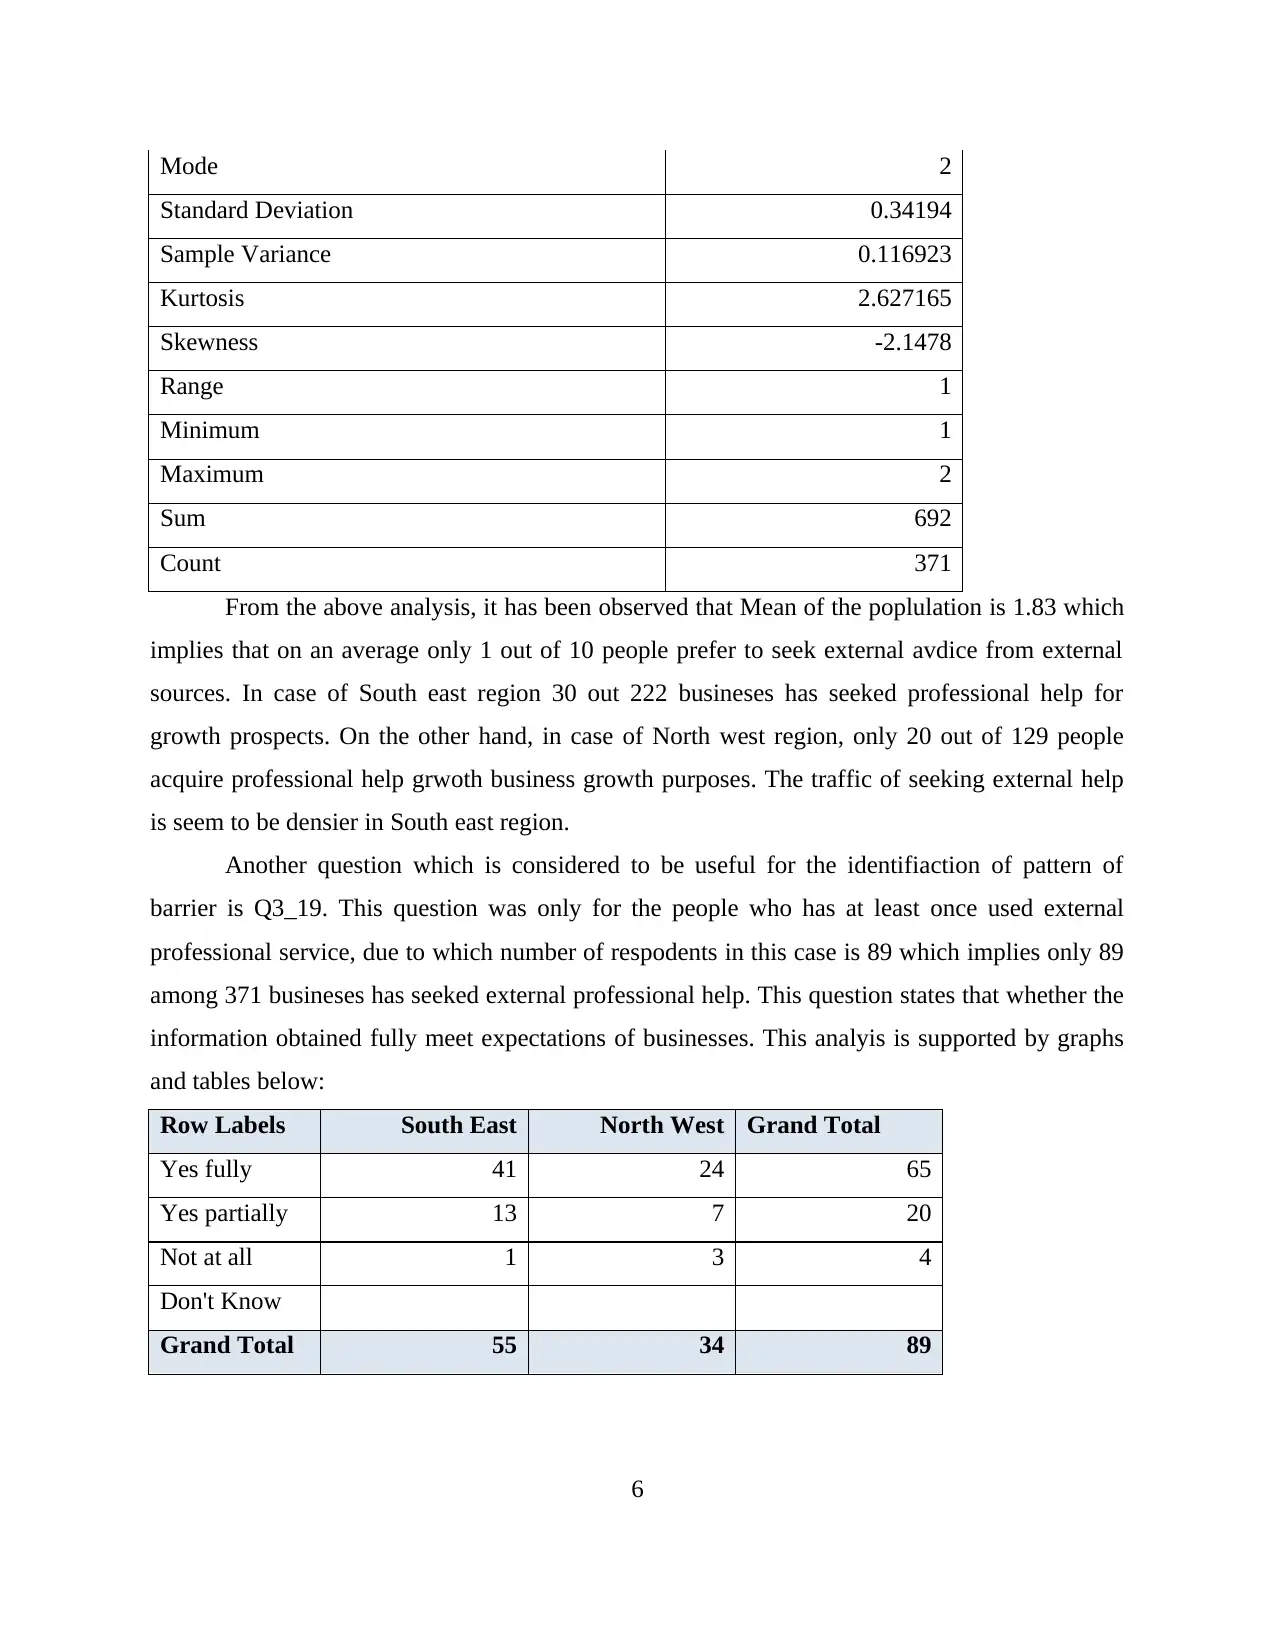
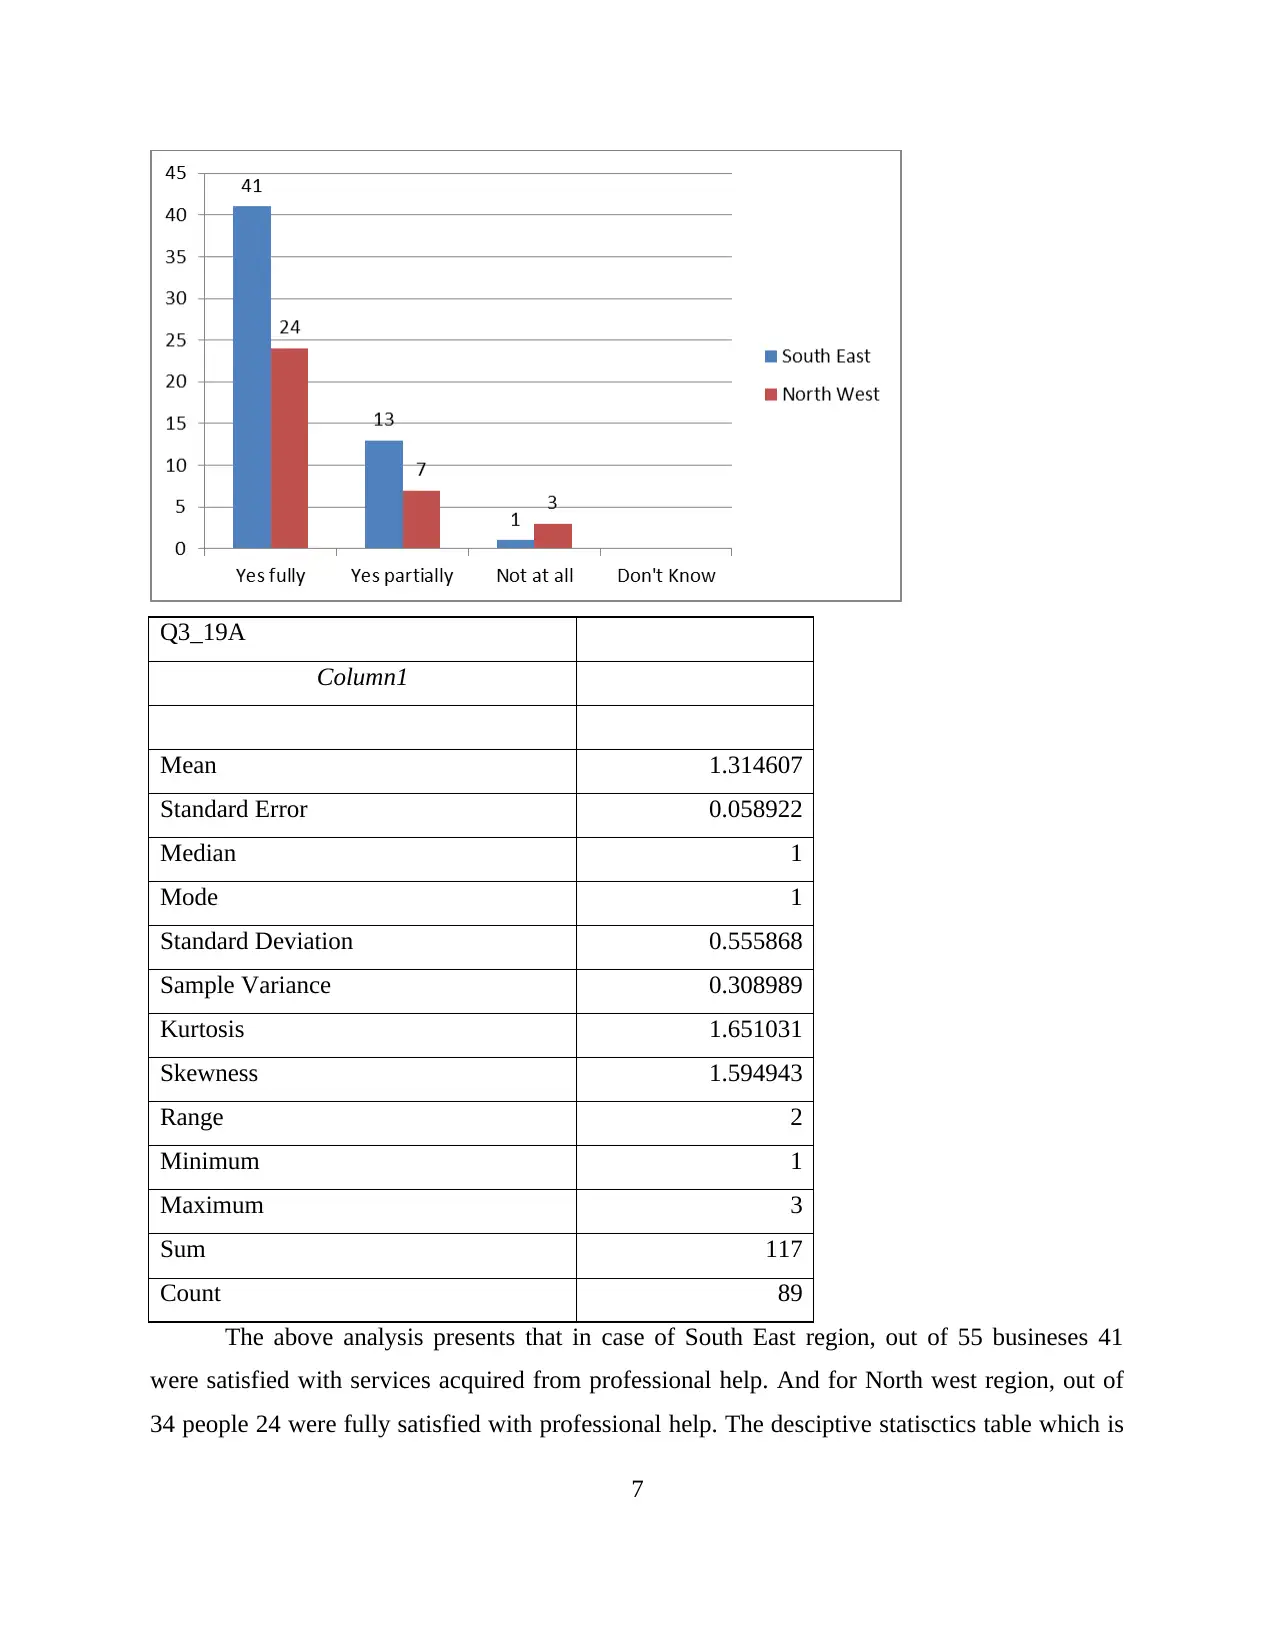
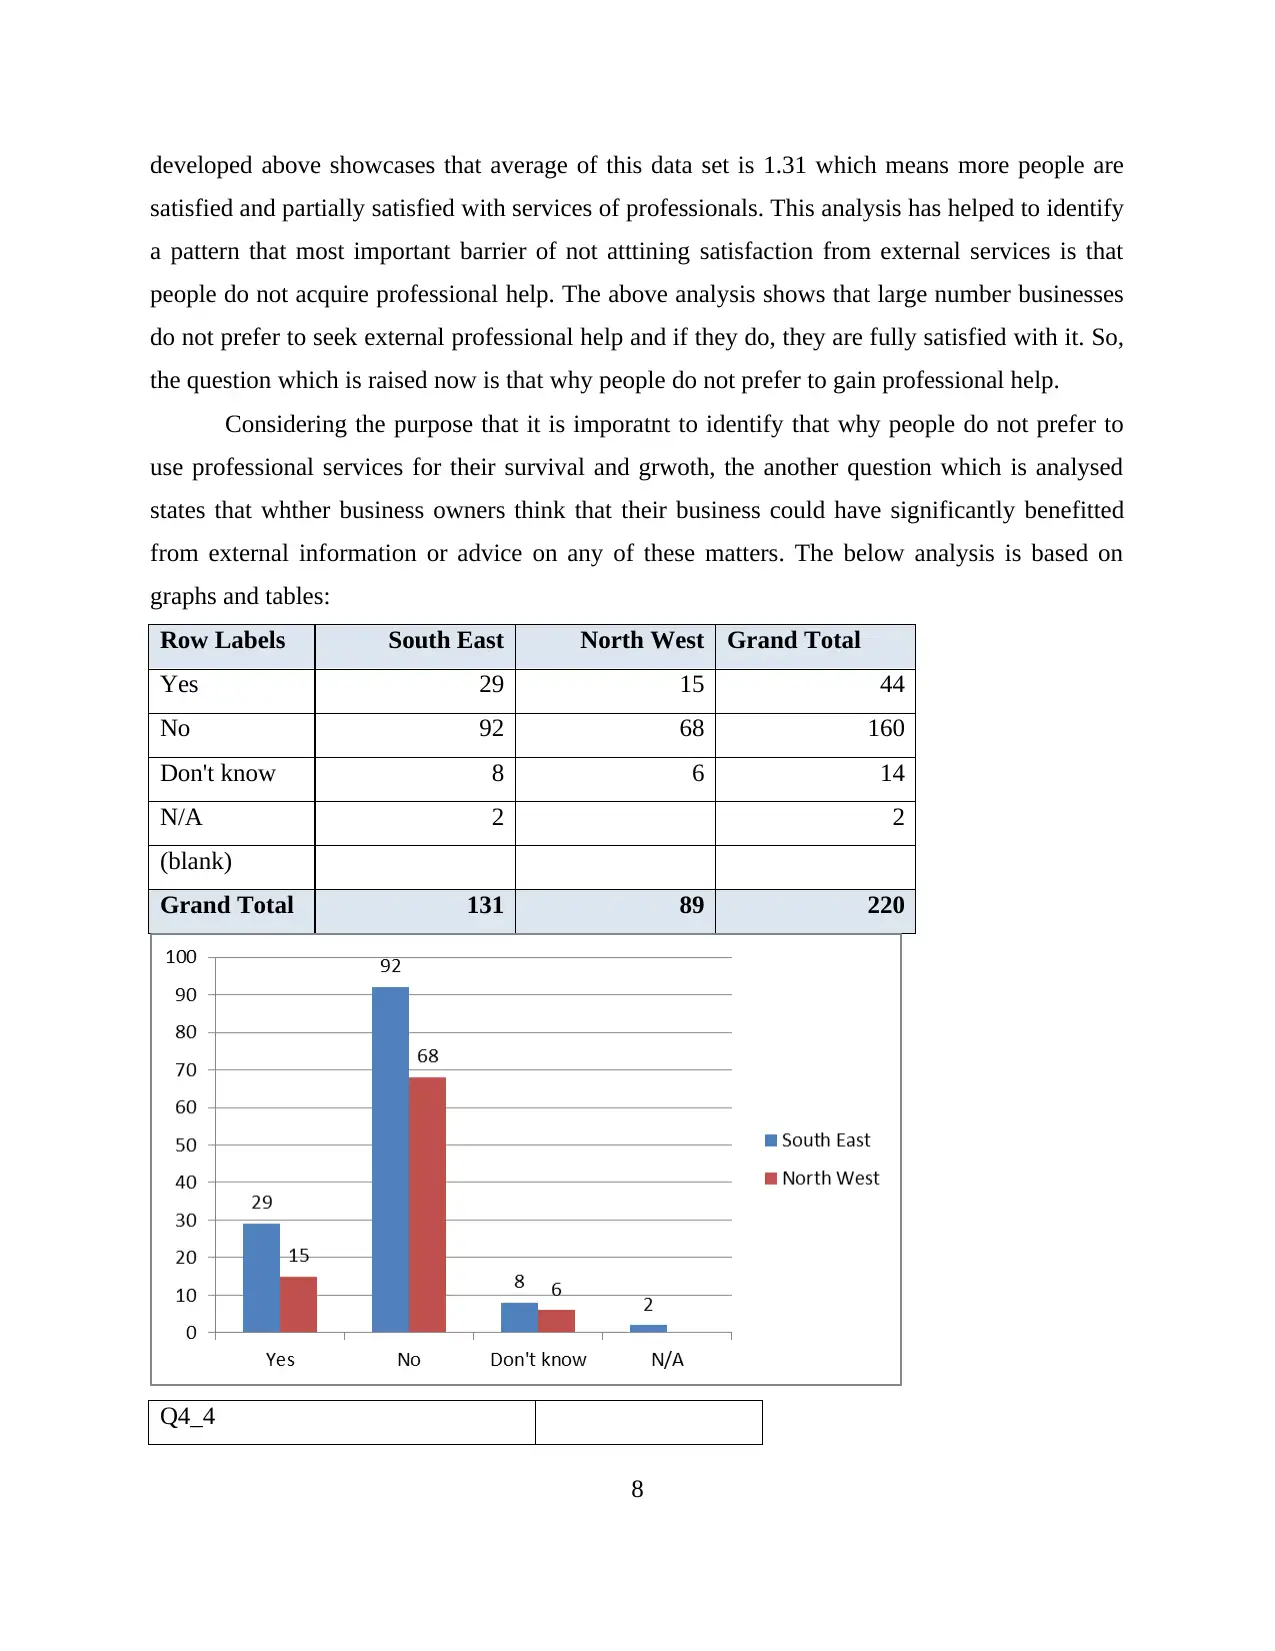
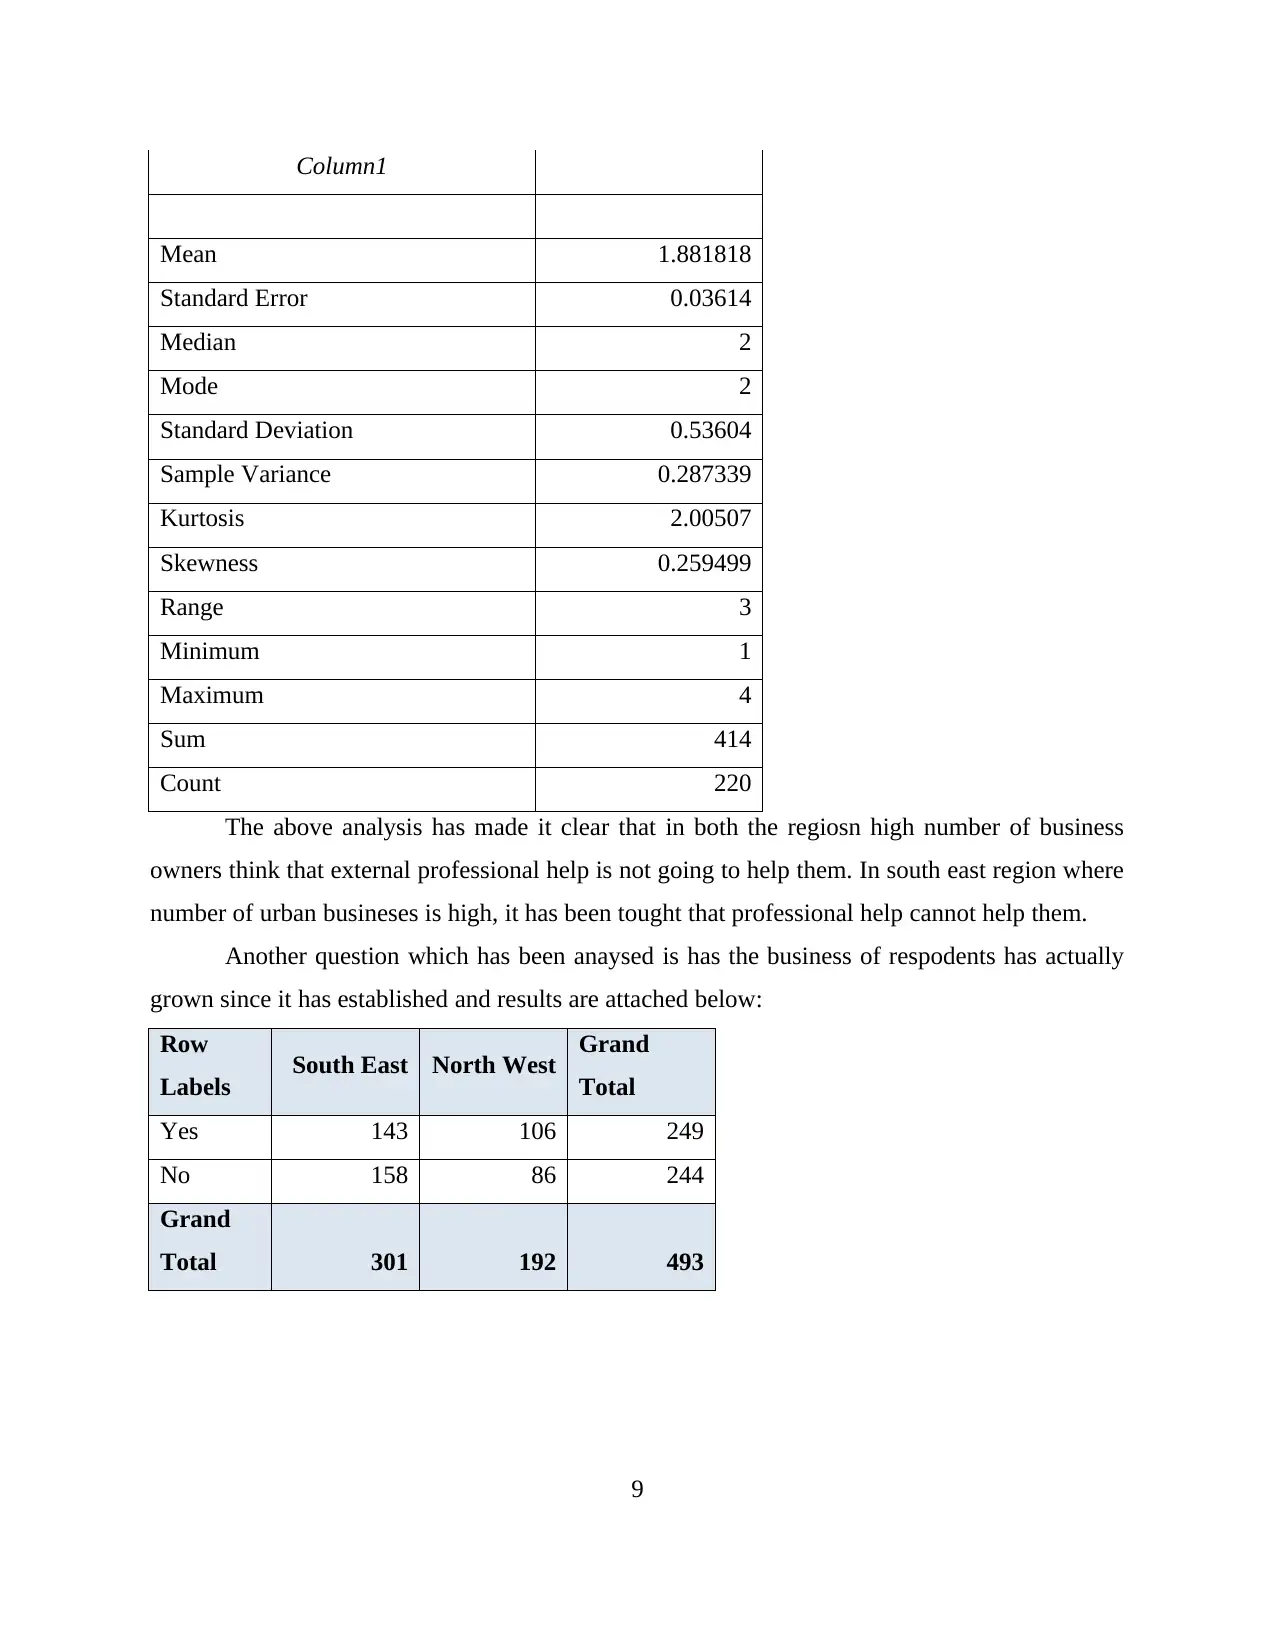
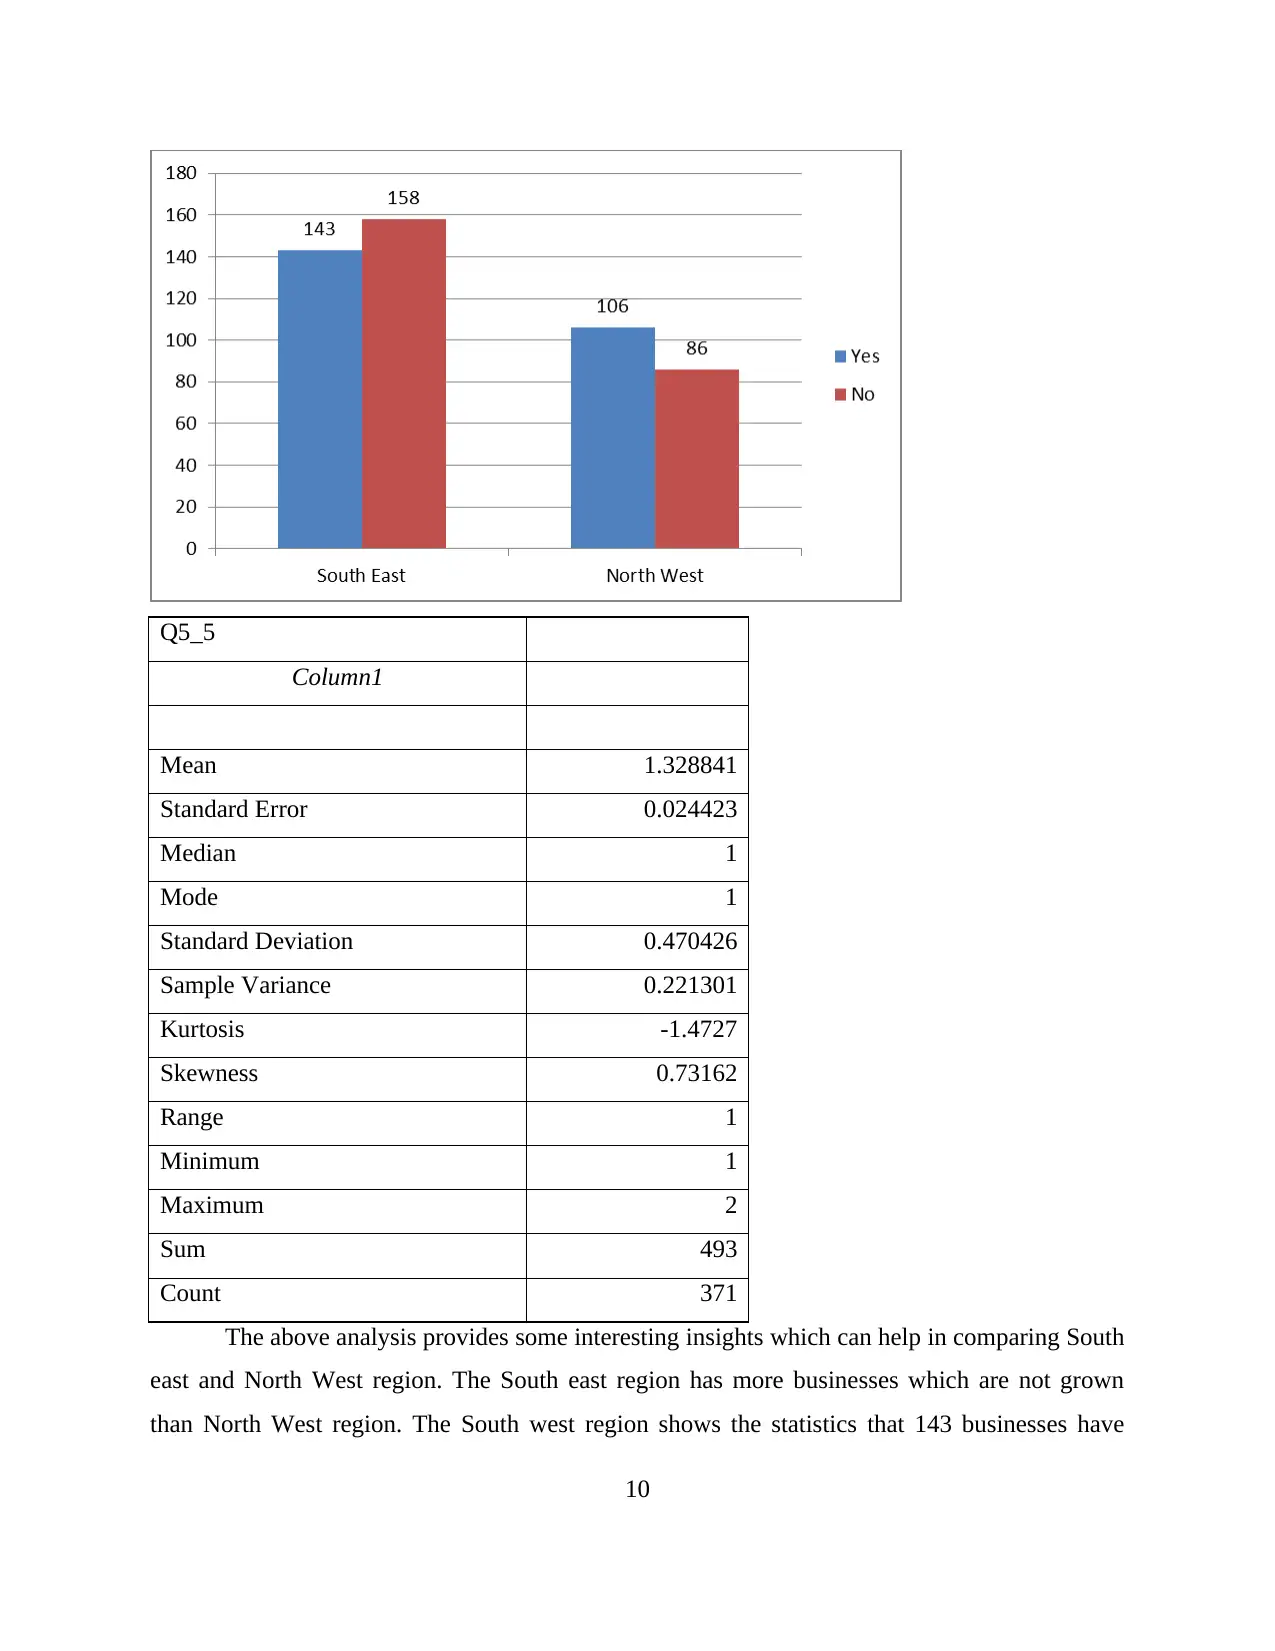
This report presents a data analysis of business practices, focusing on identifying barriers to seeking external professional advice for business owners. The analysis utilizes data from the Department for Business Innovation and Skills (BIS), comparing businesses in the South East and North West regions. The study examines various factors, including the use of professional services for business conduct, strategic advice, and the perceived benefits of external support. The report employs pivot tables, descriptive statistics, and graphical representations to highlight key findings, such as the prevalence of urban versus rural businesses and the varying degrees of satisfaction with professional services. The analysis reveals patterns of barriers, including regional differences in business practices and preferences for seeking external help. The report concludes with recommendations for areas requiring further support, aiming to improve business decision-making and foster growth. The data suggests that businesses in North West are restricted from seeking professional help. The businesses of South East have a barrier of preference due to which they do not prefer to use professional help further.

Using Data to Build Business
Practice
Practice
Paraphrase This Document
Need a fresh take? Get an instant paraphrase of this document with our AI Paraphraser

Contents
INTRODUCTION...........................................................................................................................1
MAIN BODY..................................................................................................................................1
Pattern of barriers........................................................................................................................1
Highlighting interesting findings...............................................................................................11
Recommendations......................................................................................................................12
CONCLUSION..............................................................................................................................12

INTRODUCTION
Data analytics is the concept of analysing the raw data in order to mine meaningful insights
from that data. This concept acts as a procedure in which raw data is first cleaned, then
transformed so that it could be used for analysis. Using the tools and methods of business
intelligence, this data is then analysed and for the purpose of effective communication, data is
presented and visualised into graphs charts and tables. The main aim of this report is to identify
the data requirements for effective business decision making and developing an understating
regarding appropriate analysis.
In this report, the data of Department for Business Innovation and Skills (BIS) is used.
Using this data, patterns of barriers to take up external advice are identified by highlighting
interesting findings. At last, recommendations about areas which require further support are also
devised.
MAIN BODY
Pattern of barriers
The research data of Department for Business Innovation and Skills is given which is a big
data. This data has total of 6 tabs which has the data that is acquired from owners of small
entrepreneurial services. By analysing the questions asked in this research from respondents, it
has been observed that the data is gathered from total of 1203 individuals. These respondents are
6 questions having sub 356 sub questions and 3 demographic questions. The aim main of this
report is to compare the businesses of South East region with the North West region. The data is
analysed by reviewing each and every question which is asked from the respondents.
From the data provided, it has been observed that the aim of this research is to gain
information from entrepreneurs about how frequently they have seek external professional help
for smooth business conduct, survival and growth. This information is gained by BIS to analyse
why entrepreneurs do not prefer to take professional help when they are unable to run their
business smoothly and earn profit. BIS is a ministerial department which invests in skills and
education to promote trade, boost innovation and help inspiring entrepreneurs to start their own
business. This specific research of which data is given was conducted to ask people whether they
have used external help or not and if not then what are the reasons.
1
⊘ This is a preview!⊘
Do you want full access?
Subscribe today to unlock all pages.

Trusted by 1+ million students worldwide

The first question which is asked from respondents is that what is their SIC code, the SIC
code is Standard Industrial Classification which is a four digit code used for classify the
industrial areas. The numbers of industrial areas included in this are agriculture, construction,
retail trade, services, public administration and many more. Out of various questions which are
asked from respondents are reviewed and out of these questions, only few are selected for the
purpose of analyses.
The questions which are selected to identify the pattern of barriers are Region,
URBANRURAL_2, Q3_1, Q3_3, Q3_19A, Q4_4, and Q5_5. First the entire data given
reviewed and then last question of Region was considered. From the values tab of the given data,
it has been seen that there are total of 9 regions which are East Midlands, South West, South
East, London, West Midlands, North West, Yorkshire and The Humber, East of England and
North East. Out of all these regions, the regions which are required to be focused upon are South
East and North West. It is require comparing the barriers of these two regions. For this purpose,
the entire data is first filtered using the Microsoft Excel function “FILTER”, using this function
entire data is reduced to only two regions. The reduced data is then copied into a new Excel sheet
which will have the analysis of data.
The selected and reduced data set only has respondents which have a business in South
East and North West region. Using this dataset, a PIVOT table is developed which has further
reduced the data. This data only includes those questions which are considered to be relevant for
the purpose of identifying the barriers. For effective presentation of the data, the variable of
region is set as column label and Urban Rural variable is set as row label; all the other questions
are included in values and their values are summarised as COUNT. Along with PIVOT table,
descriptive statistics and graphical representation for each question has been also done in Sheet 3
and 4.
The first analysis using the reduced data is done for the aim of identifying number of Rural
and Urban businesses in South East and North West region. For this purpose, a part of PIVOT
table and graph are attached below:
Row
Labels South East North West Grand Total
Urban 166 121 287
2
Paraphrase This Document
Need a fresh take? Get an instant paraphrase of this document with our AI Paraphraser

Rural 56 28 84
Grand
Total 222 149 371
From the above analysis, it has been interpreted that there are total of 166 urban business
and 56 rural busineses in South East and there are 121 urban and 28 rural busineses in North
West. These figures showcases that overall there are more busineses in South East as 222 then
North East as 149. Also number of Urban busineses are much higher than rural ones. A total of
371 busineses are there in both the regions which are being compared in this scenerio.
After the analysis of busineses and their nature in each region, the next analysis is to
identify that whether the busineseses have used assistance or support from private sector
organisations or professionals for regular conduct of their business. Using Pivot table, bar graph
and descriptive statictics the analysis of these questions have done below:
South East North West
Row Labels Count of Q3_1 Count of Q3_1
Yes 57 37
No 165 112
Grand Total 222 149
3

Q3_1
Column1
Mean 1.746631
Standard Error 0.022611
Median 2
Mode 2
Standard Deviation 0.435528
Sample Variance 0.189685
Kurtosis -0.70721
Skewness -1.1387
Range 1
Minimum 1
Maximum 2
Sum 648
Count 371
From the above analysis, it has been interpreted that businessess of South East has
seeked more help for running their business from external professionals as the total number of
busineses in South East are 57 which are greaer than the number of busineses in North West
4
⊘ This is a preview!⊘
Do you want full access?
Subscribe today to unlock all pages.

Trusted by 1+ million students worldwide

region that is 37. The reason behind this bias is seen to be the high number of urban busineses in
South East. The mean of this analysis is gained to be 1.74 which implies that on an average
people have not seeked professional help from external private organisation for the purpose of
regular conduct of business.
Another question which is being analysed in present report is that whther businese has
gained external support for obtaining strategic advice to help introduce a stepped change to grow
the business or not. The analysis is supported by Pivot table, bar graph and descripive statistics
analysis.
South East North West
Row Labels Count of Q3_3 Count of Q3_3
Yes 30 20
No 192 129
Grand Total 222 149
Q3_3
Column1
Mean 1.865229
Standard Error 0.017753
Median 2
5
Paraphrase This Document
Need a fresh take? Get an instant paraphrase of this document with our AI Paraphraser

Mode 2
Standard Deviation 0.34194
Sample Variance 0.116923
Kurtosis 2.627165
Skewness -2.1478
Range 1
Minimum 1
Maximum 2
Sum 692
Count 371
From the above analysis, it has been observed that Mean of the poplulation is 1.83 which
implies that on an average only 1 out of 10 people prefer to seek external avdice from external
sources. In case of South east region 30 out 222 busineses has seeked professional help for
growth prospects. On the other hand, in case of North west region, only 20 out of 129 people
acquire professional help grwoth business growth purposes. The traffic of seeking external help
is seem to be densier in South east region.
Another question which is considered to be useful for the identifiaction of pattern of
barrier is Q3_19. This question was only for the people who has at least once used external
professional service, due to which number of respodents in this case is 89 which implies only 89
among 371 busineses has seeked external professional help. This question states that whether the
information obtained fully meet expectations of businesses. This analyis is supported by graphs
and tables below:
Row Labels South East North West Grand Total
Yes fully 41 24 65
Yes partially 13 7 20
Not at all 1 3 4
Don't Know
Grand Total 55 34 89
6

Q3_19A
Column1
Mean 1.314607
Standard Error 0.058922
Median 1
Mode 1
Standard Deviation 0.555868
Sample Variance 0.308989
Kurtosis 1.651031
Skewness 1.594943
Range 2
Minimum 1
Maximum 3
Sum 117
Count 89
The above analysis presents that in case of South East region, out of 55 busineses 41
were satisfied with services acquired from professional help. And for North west region, out of
34 people 24 were fully satisfied with professional help. The desciptive statisctics table which is
7
⊘ This is a preview!⊘
Do you want full access?
Subscribe today to unlock all pages.

Trusted by 1+ million students worldwide

developed above showcases that average of this data set is 1.31 which means more people are
satisfied and partially satisfied with services of professionals. This analysis has helped to identify
a pattern that most important barrier of not atttining satisfaction from external services is that
people do not acquire professional help. The above analysis shows that large number businesses
do not prefer to seek external professional help and if they do, they are fully satisfied with it. So,
the question which is raised now is that why people do not prefer to gain professional help.
Considering the purpose that it is imporatnt to identify that why people do not prefer to
use professional services for their survival and grwoth, the another question which is analysed
states that whther business owners think that their business could have significantly benefitted
from external information or advice on any of these matters. The below analysis is based on
graphs and tables:
Row Labels South East North West Grand Total
Yes 29 15 44
No 92 68 160
Don't know 8 6 14
N/A 2 2
(blank)
Grand Total 131 89 220
Q4_4
8
Paraphrase This Document
Need a fresh take? Get an instant paraphrase of this document with our AI Paraphraser

Column1
Mean 1.881818
Standard Error 0.03614
Median 2
Mode 2
Standard Deviation 0.53604
Sample Variance 0.287339
Kurtosis 2.00507
Skewness 0.259499
Range 3
Minimum 1
Maximum 4
Sum 414
Count 220
The above analysis has made it clear that in both the regiosn high number of business
owners think that external professional help is not going to help them. In south east region where
number of urban busineses is high, it has been tought that professional help cannot help them.
Another question which has been anaysed is has the business of respodents has actually
grown since it has established and results are attached below:
Row
Labels South East North West Grand
Total
Yes 143 106 249
No 158 86 244
Grand
Total 301 192 493
9

Q5_5
Column1
Mean 1.328841
Standard Error 0.024423
Median 1
Mode 1
Standard Deviation 0.470426
Sample Variance 0.221301
Kurtosis -1.4727
Skewness 0.73162
Range 1
Minimum 1
Maximum 2
Sum 493
Count 371
The above analysis provides some interesting insights which can help in comparing South
east and North West region. The South east region has more businesses which are not grown
than North West region. The South west region shows the statistics that 143 businesses have
10
⊘ This is a preview!⊘
Do you want full access?
Subscribe today to unlock all pages.

Trusted by 1+ million students worldwide
1 out of 14
Related Documents

Your All-in-One AI-Powered Toolkit for Academic Success.
+13062052269
info@desklib.com
Available 24*7 on WhatsApp / Email
Unlock your academic potential
Copyright © 2020–2025 A2Z Services. All Rights Reserved. Developed and managed by ZUCOL.