Business Decision Making Assignment: Data Analysis and Interpretation

Verified

Added on  2023/02/03

|10
|605
|42
Report
AI Summary
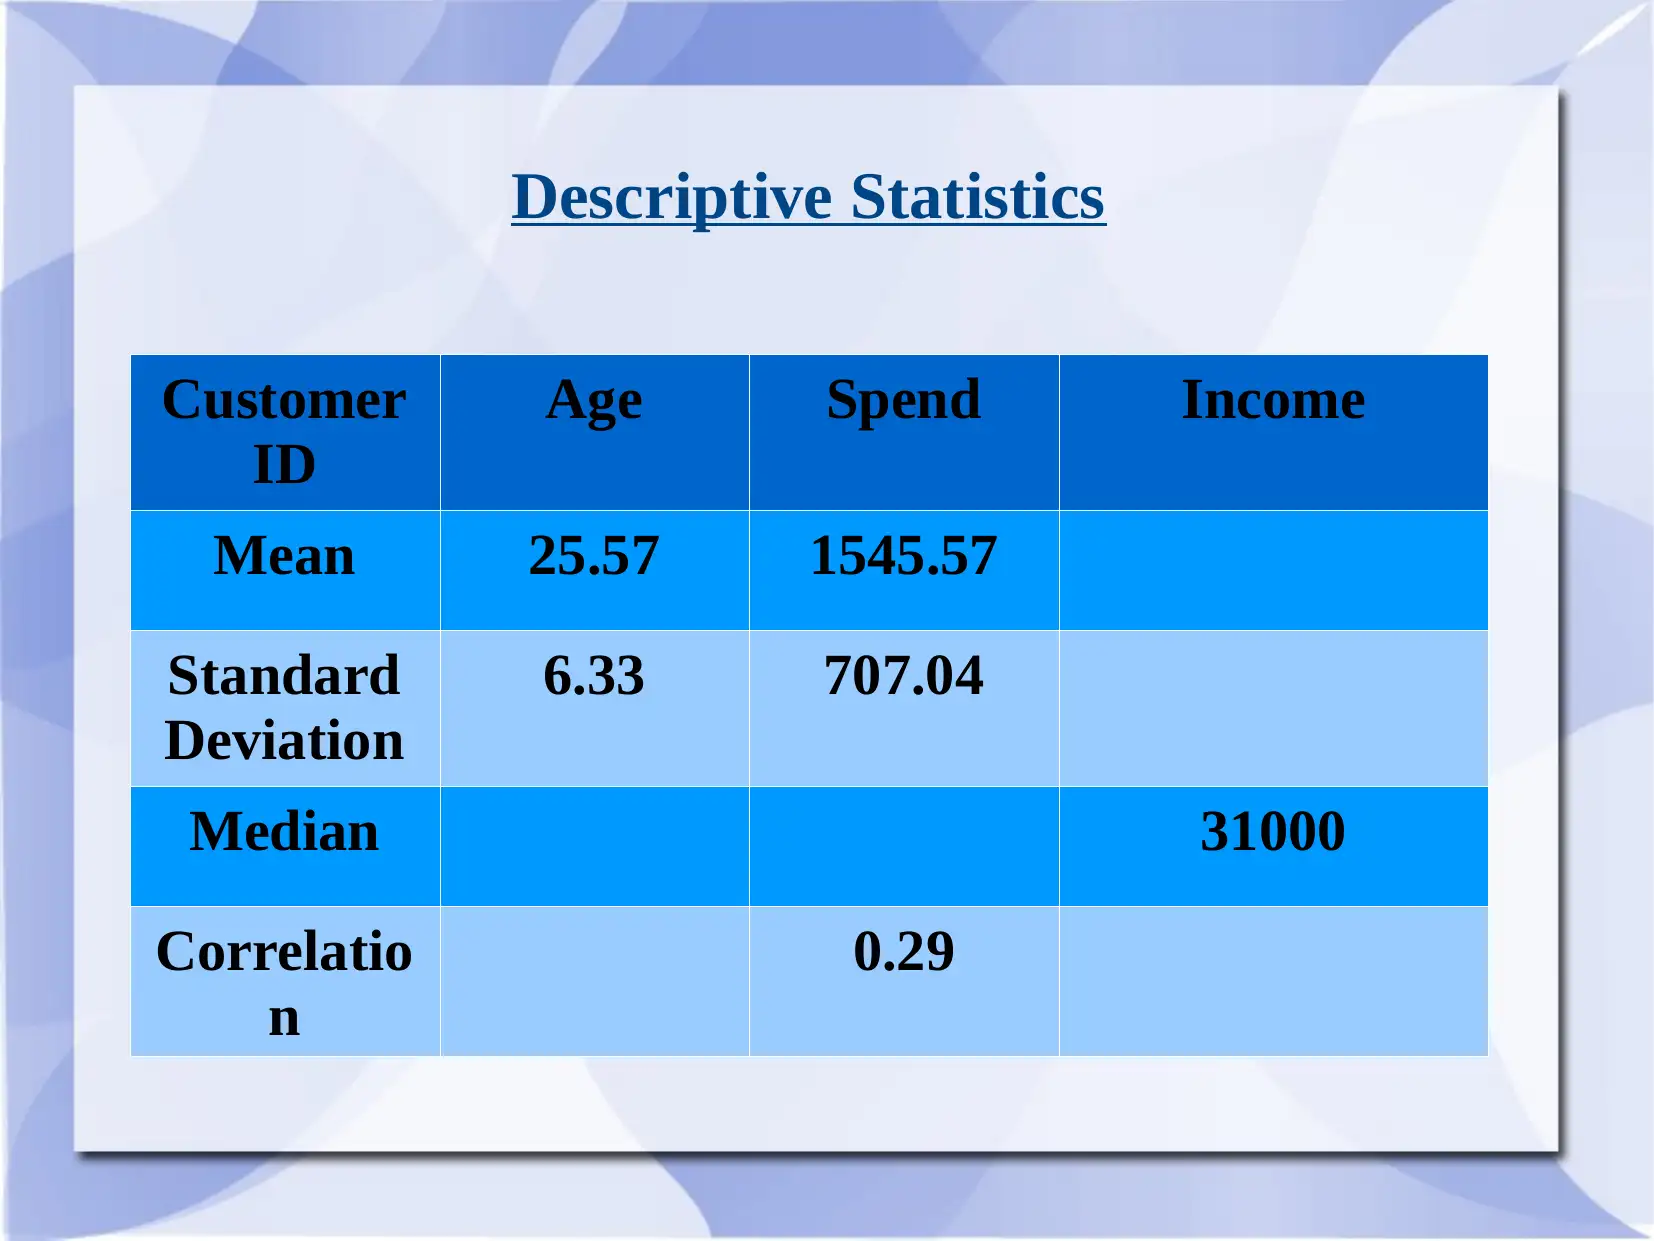
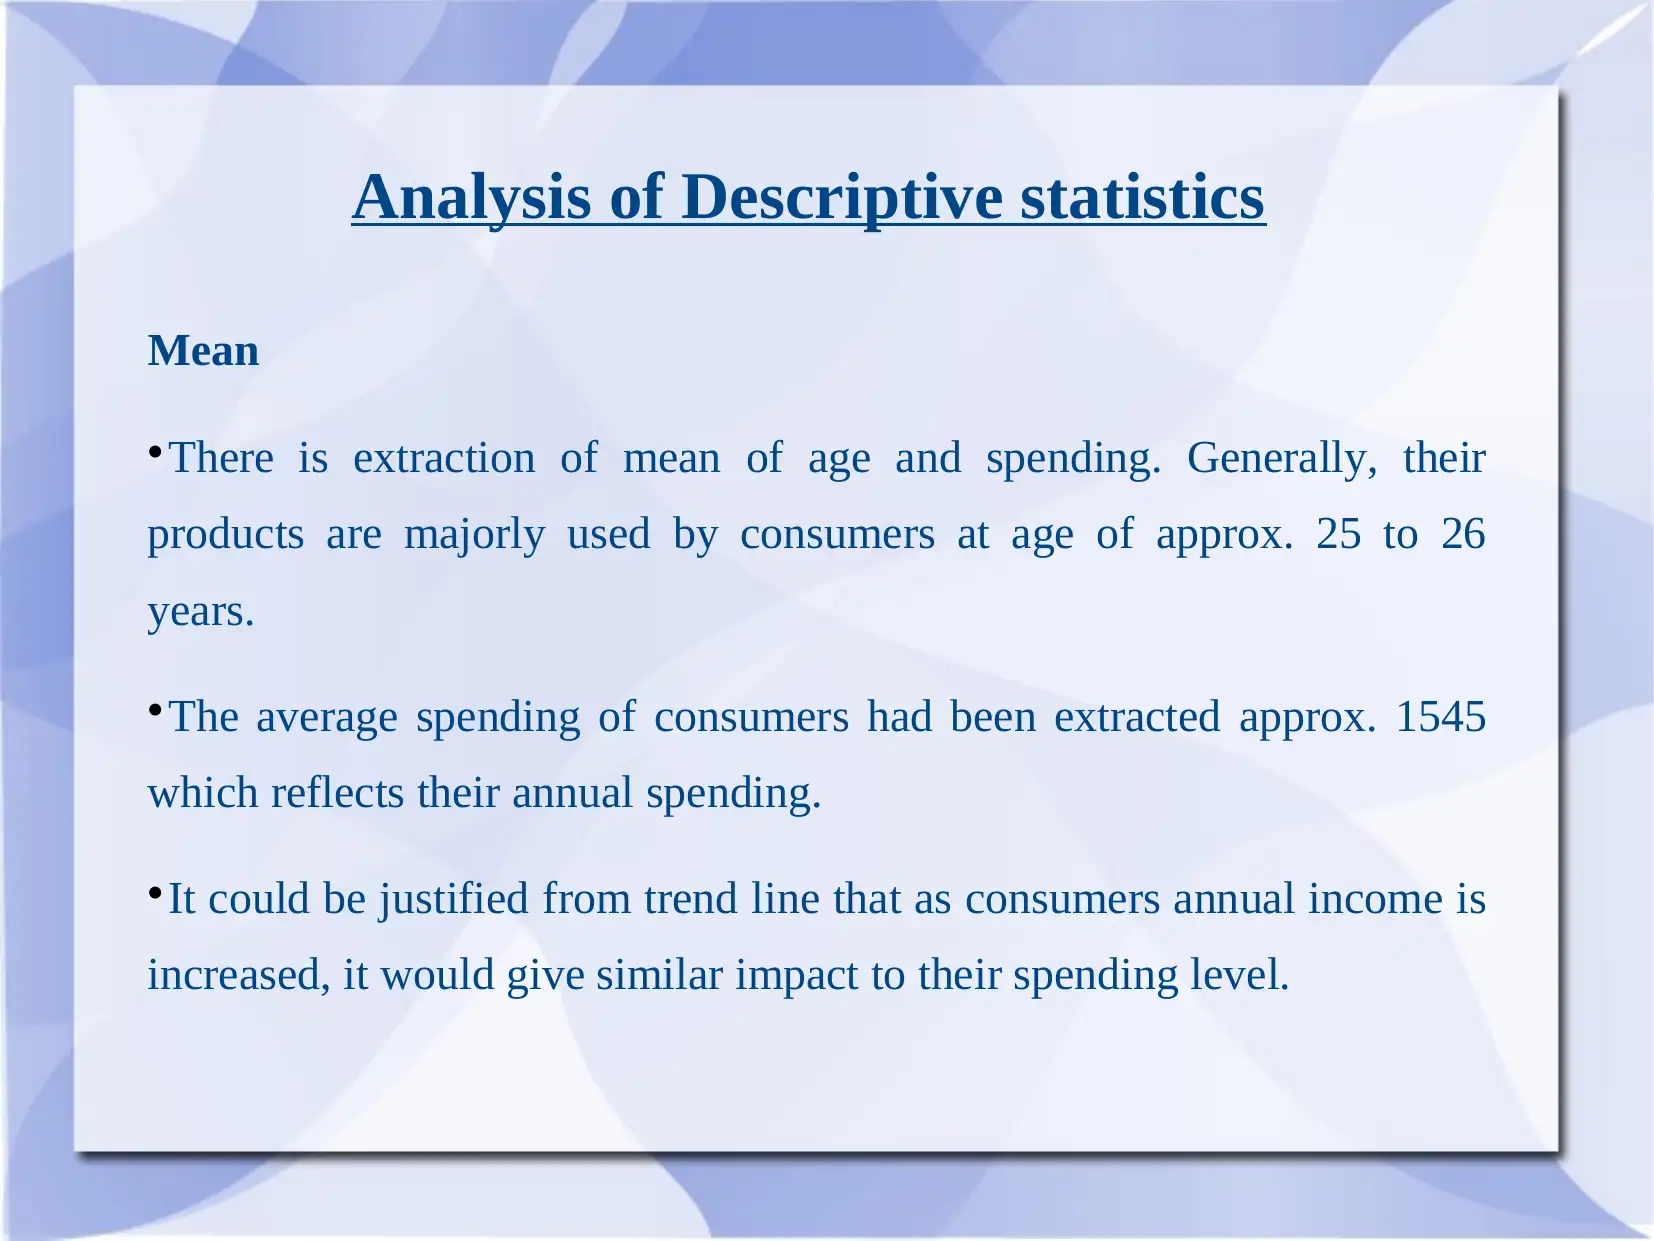
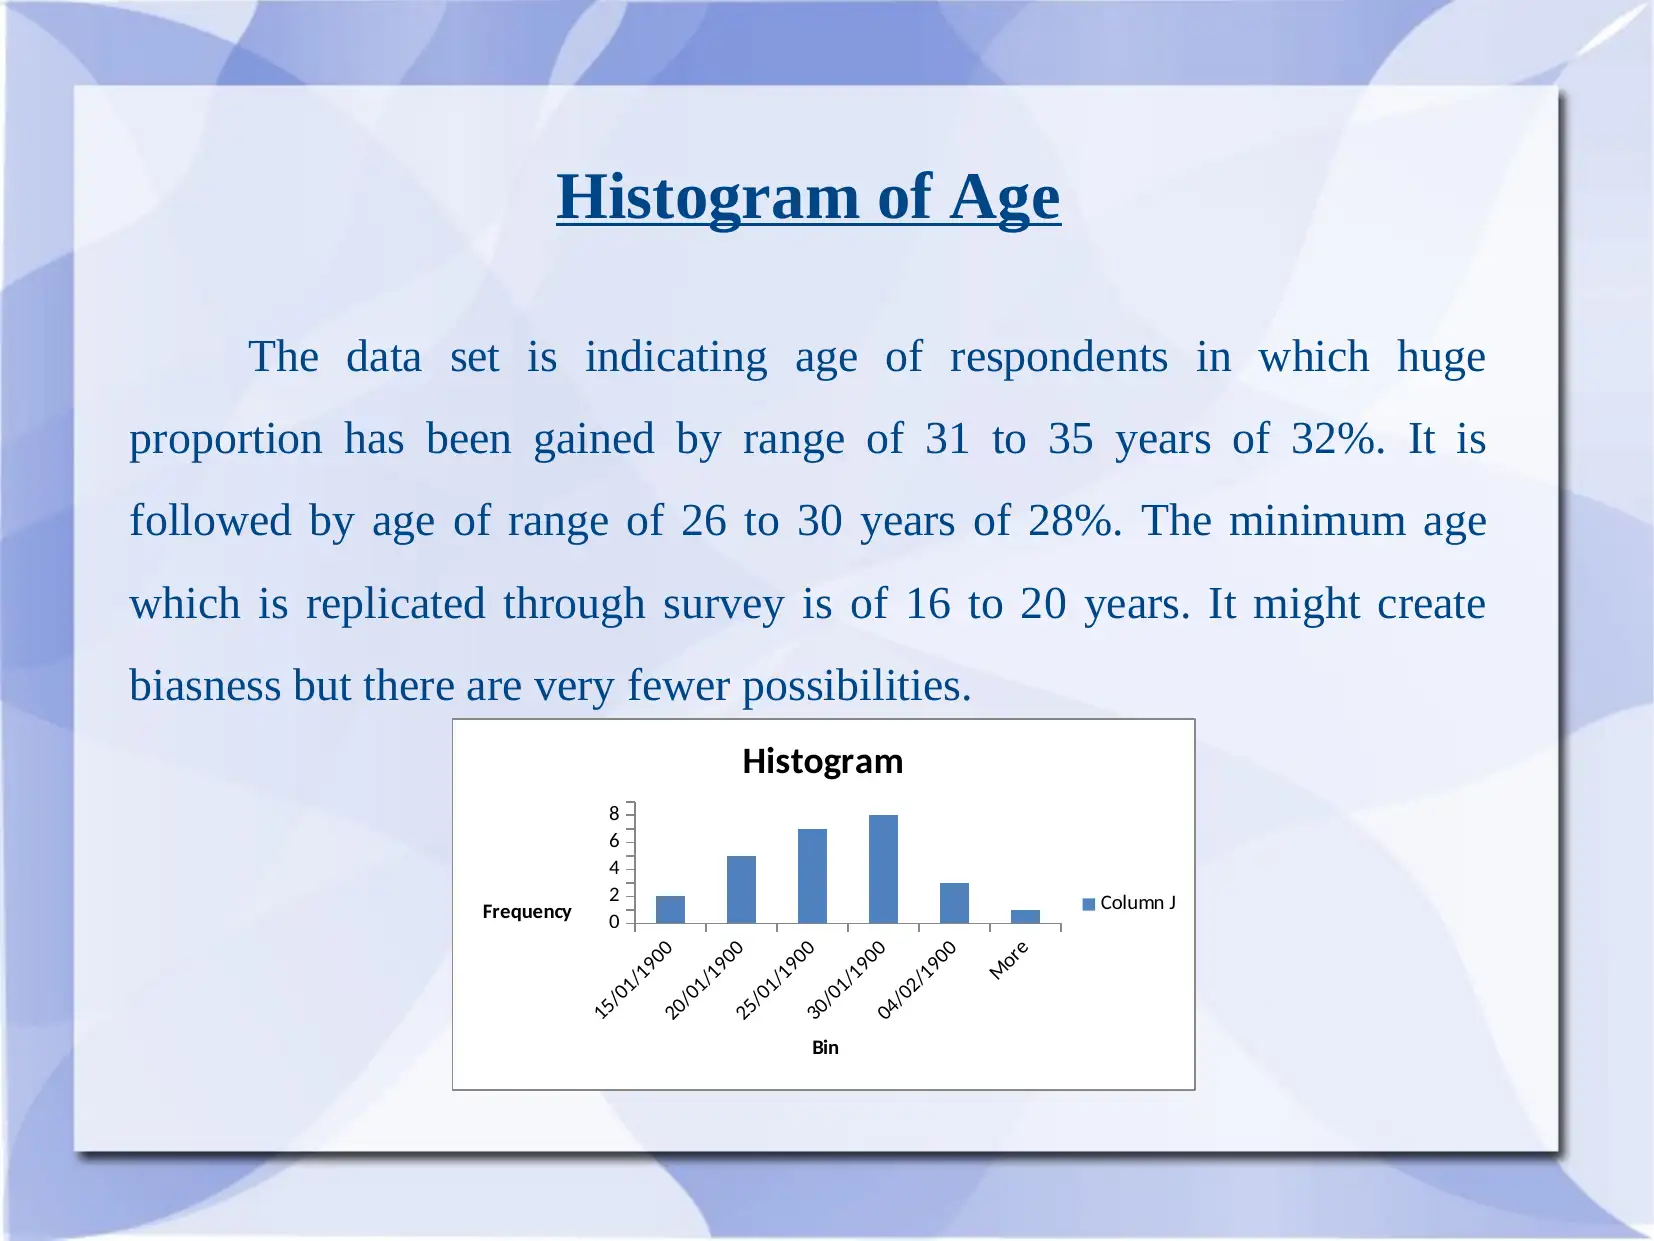
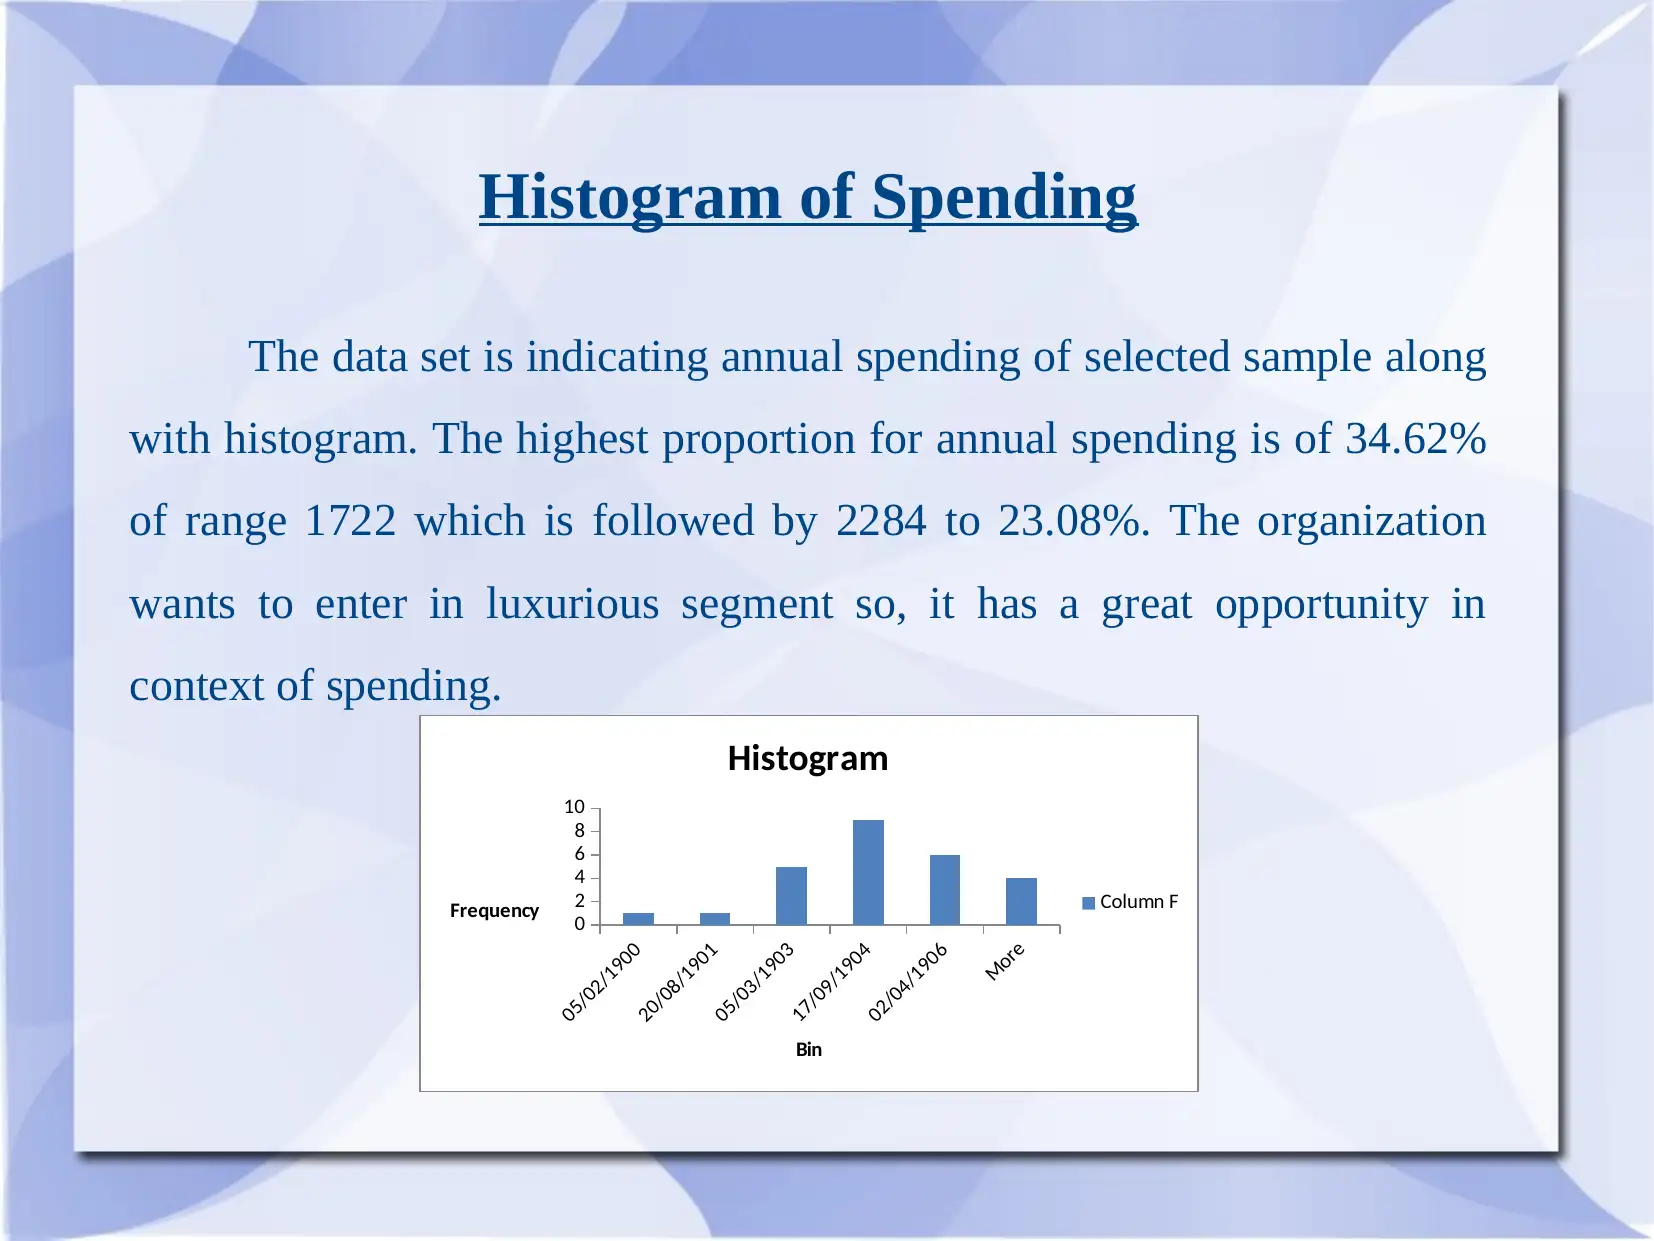
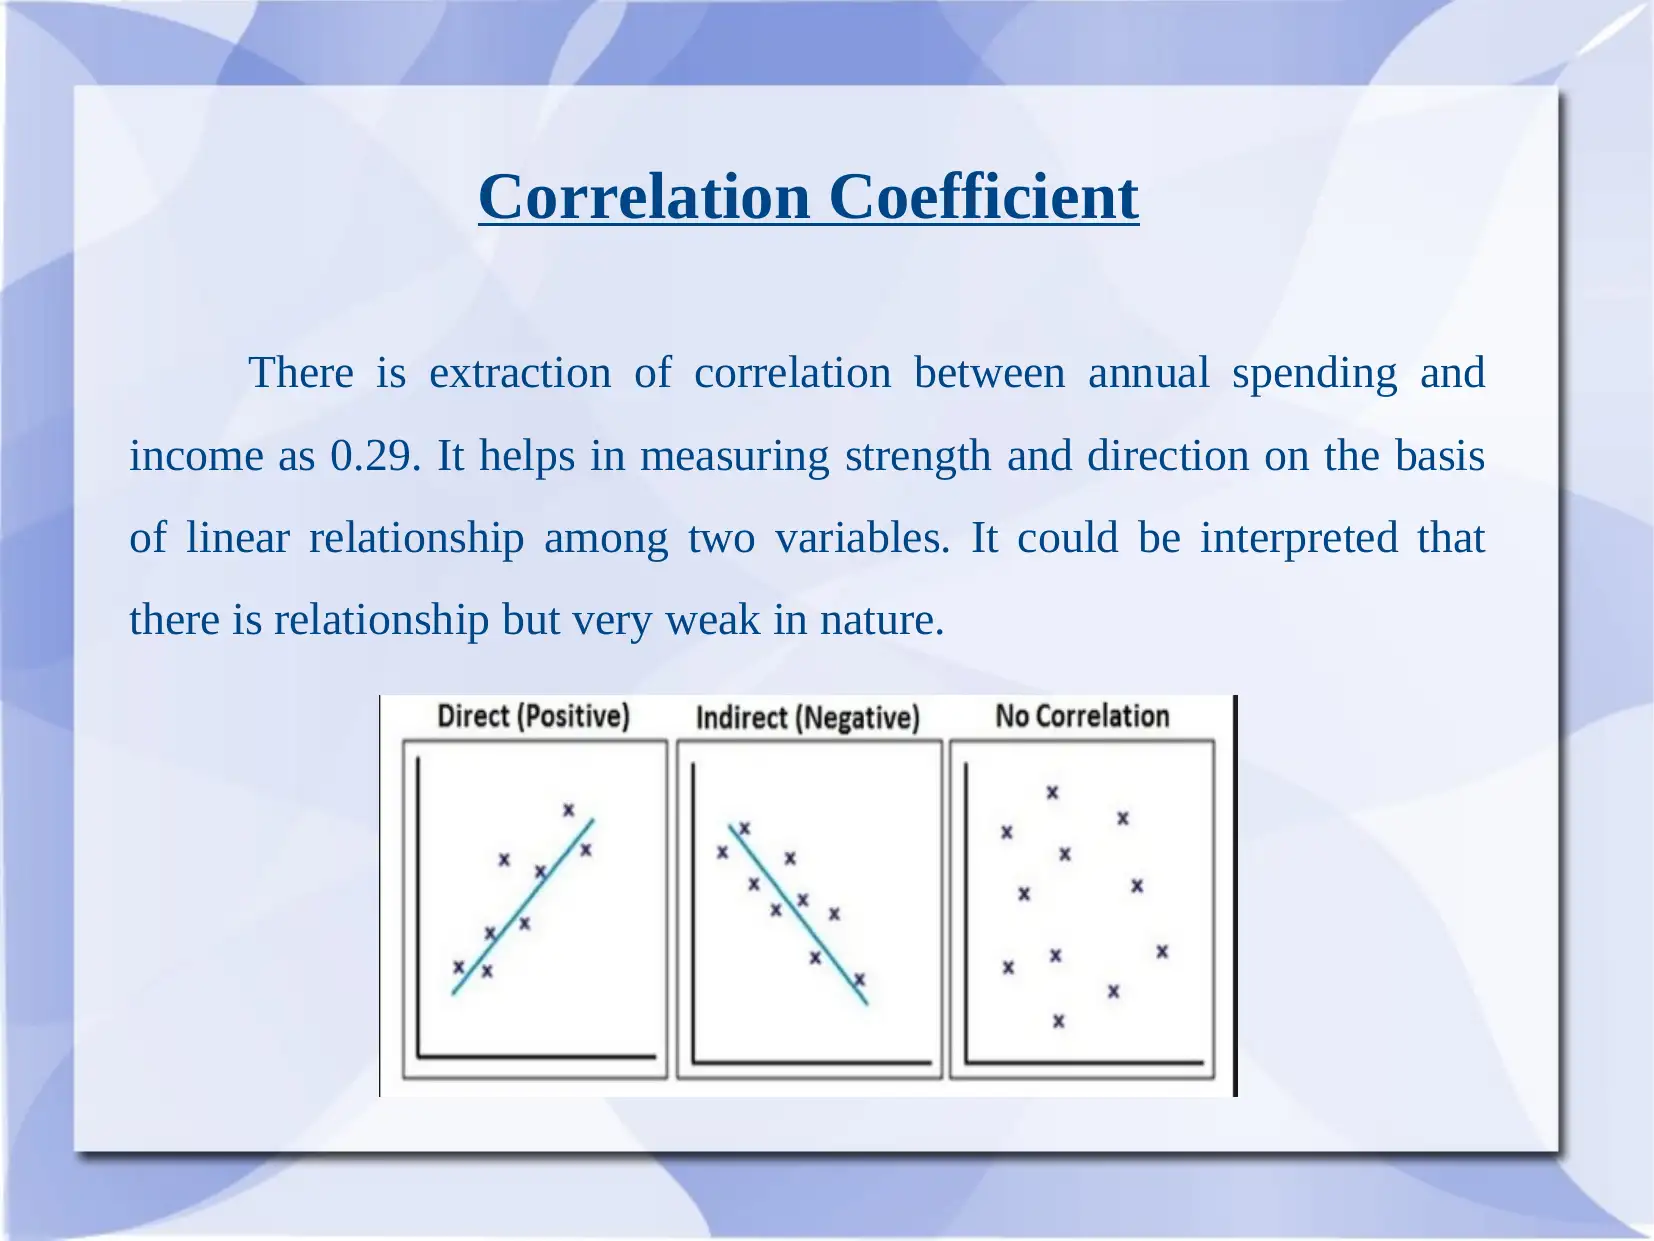
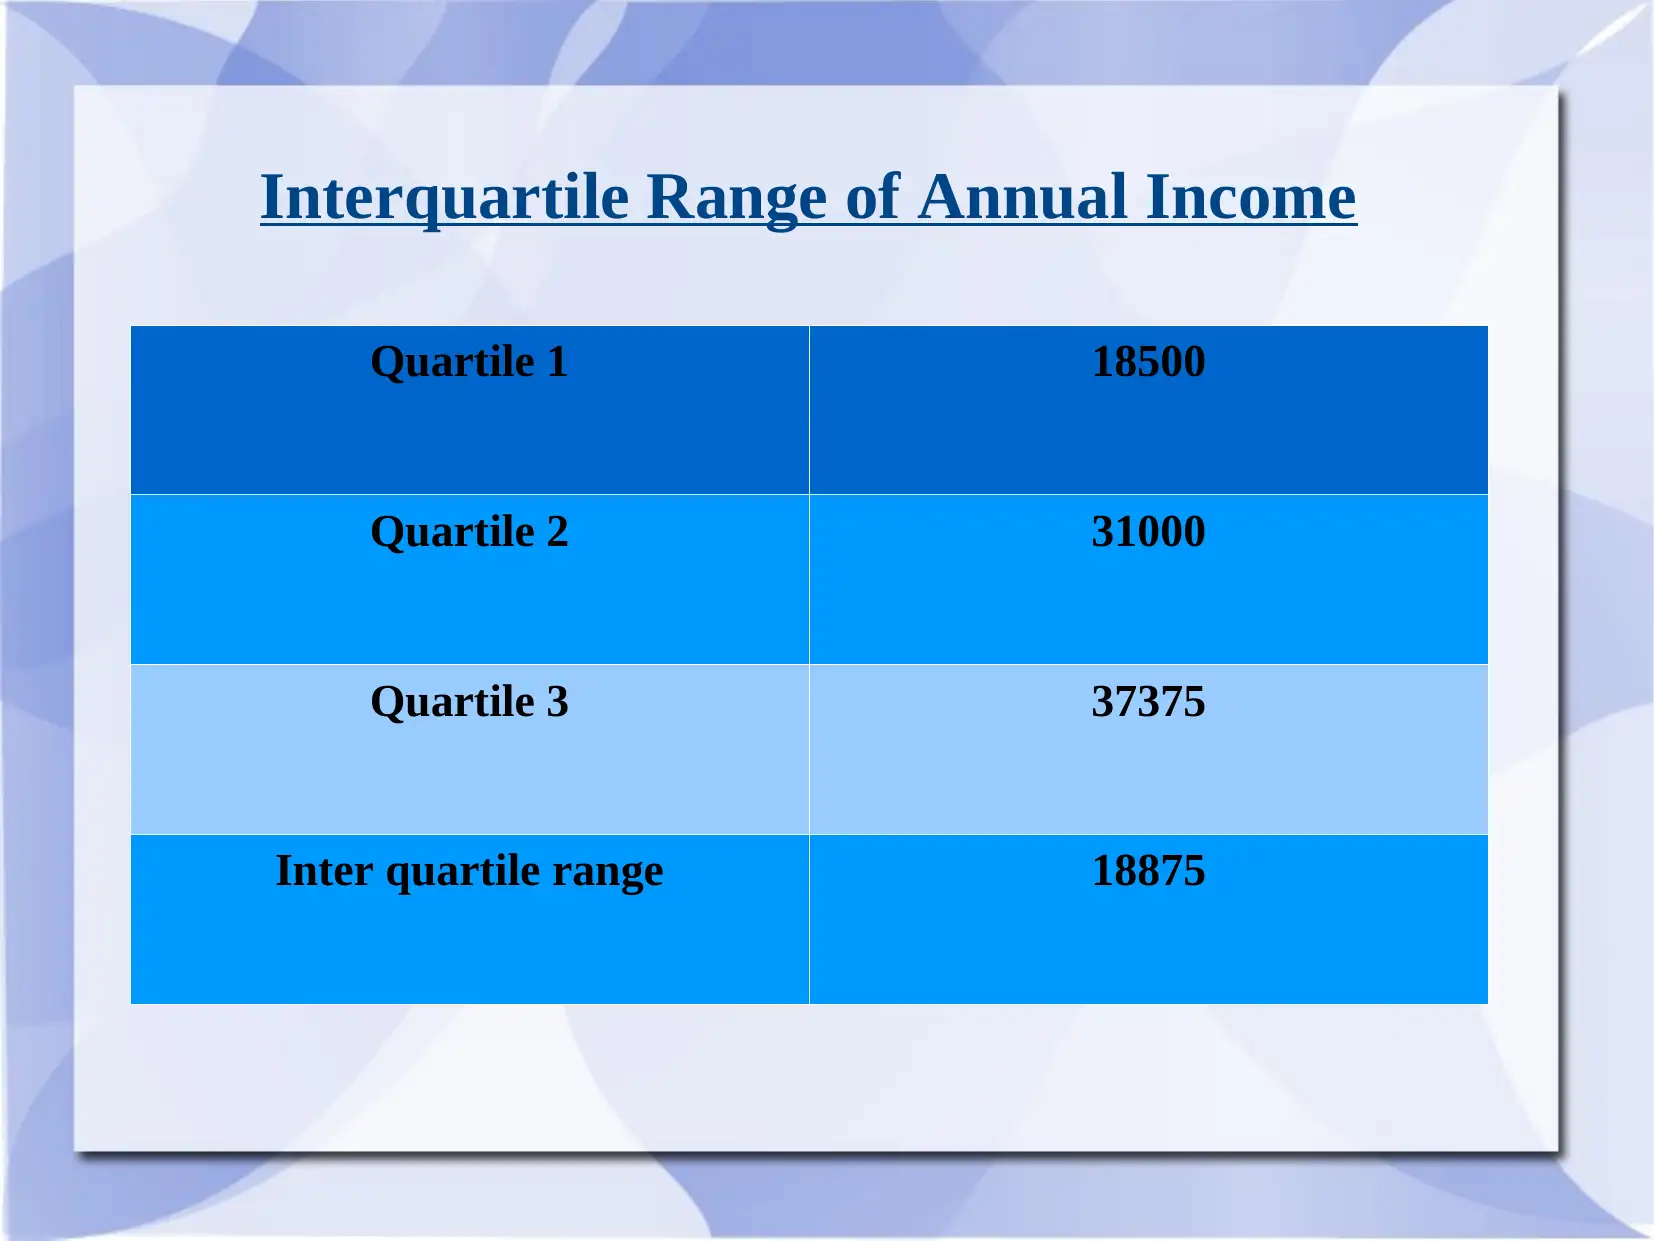
This report presents an analysis of customer data using descriptive statistics. It begins with an overview of the customer base, including age and spending habits, providing the mean and standard deviation for each variable. The analysis then delves into the distribution of customer ages and spending through histograms, revealing key insights into the customer demographics and their financial behavior. Furthermore, the report examines the correlation between annual spending and income, offering interpretations of the relationship's strength. The interquartile range of annual income is also provided, offering a comprehensive view of the data. The report concludes with a list of references used in the analysis.
Document Page
Our Existing Customer
tabler-icon-diamond-filled.svg

Paraphrase This Document

Need a fresh take? Get an instant paraphrase of this document with our AI Paraphraser
Document Page
Descriptive Statistics
Customer
ID
Age Spend Income
Mean 25.57 1545.57
Standard
Deviation
6.33 707.04
Median 31000
Correlatio
n
0.29
Document Page
Analysis of Descriptive statistics
Mean
There is extraction of mean of age and spending. Generally, their
products are majorly used by consumers at age of approx. 25 to 26
years.
The average spending of consumers had been extracted approx. 1545
which reflects their annual spending.
It could be justified from trend line that as consumers annual income is
increased, it would give similar impact to their spending level.
Document Page
Analysis of Descriptive statistics
Standard Deviation
It helps in measuring that how data is concentrated around its mean, if
it is highly concentrated then it would replicate low standard deviation.
If in the data set of age and spend, both are very small as compared to
its arithmetic mean, then it is highly concentrated.
Standard deviation of both the variables is low which identifies that
specific data set is clustered in close aspect in context of mean.
tabler-icon-diamond-filled.svg

Paraphrase This Document

Need a fresh take? Get an instant paraphrase of this document with our AI Paraphraser
Document Page
Histogram of Age
The data set is indicating age of respondents in which huge
proportion has been gained by range of 31 to 35 years of 32%. It is
followed by age of range of 26 to 30 years of 28%. The minimum age
which is replicated through survey is of 16 to 20 years. It might create
biasness but there are very fewer possibilities.
15/01/1900
20/01/1900
25/01/1900
30/01/1900
04/02/1900
More
0
2
4
6
8
Histogram
Column J
Bin
Frequency
Document Page
Histogram of Spending
The data set is indicating annual spending of selected sample along
with histogram. The highest proportion for annual spending is of 34.62%
of range 1722 which is followed by 2284 to 23.08%. The organization
wants to enter in luxurious segment so, it has a great opportunity in
context of spending.
05/02/1900
20/08/1901
05/03/1903
17/09/1904
02/04/1906
More
0
2
4
6
8
10
Histogram
Column F
Bin
Frequency
Document Page
Correlation Coefficient
There is extraction of correlation between annual spending and
income as 0.29. It helps in measuring strength and direction on the basis
of linear relationship among two variables. It could be interpreted that
there is relationship but very weak in nature.
tabler-icon-diamond-filled.svg

Paraphrase This Document

Need a fresh take? Get an instant paraphrase of this document with our AI Paraphraser
Document Page
Interquartile Range of Annual Income
Quartile 1 18500
Quartile 2 31000
Quartile 3 37375
Inter quartile range 18875
Document Page
REFERENCES
García-Peñalvo, F. J. and Conde, M. Á., 2014. Using informal learning for
business decision making and knowledge management. Journal of Business
Research. 67(5). pp.686-691.
He, W., Wang, F. K. and Akula, V., 2017. Managing extracted knowledge from
big social media data for business decision making. Journal of Knowledge
Management. 21(2). pp.275-294.
Jordan, M. I. and Mitchell, T. M., 2015. Machine learning: Trends, perspectives,
and prospects. Science. 349(6245). pp.255-260.
Parkkinen, J. and et. al., 2017. System, method, apparatus, and computer
program product for providing a social network diagram in a P2P network
device. U.S. Patent 9,537,943.
Document Page
THANK YOU!!
chevron_up_icon
1 out of 10
circle_padding
hide_on_mobile
zoom_out_icon
[object Object]