Data Analysis and Business Decision Making Assignment (HNC/D)

Verified

Added on  2023/02/02

|9
|297
|37
Homework Assignment
AI Summary
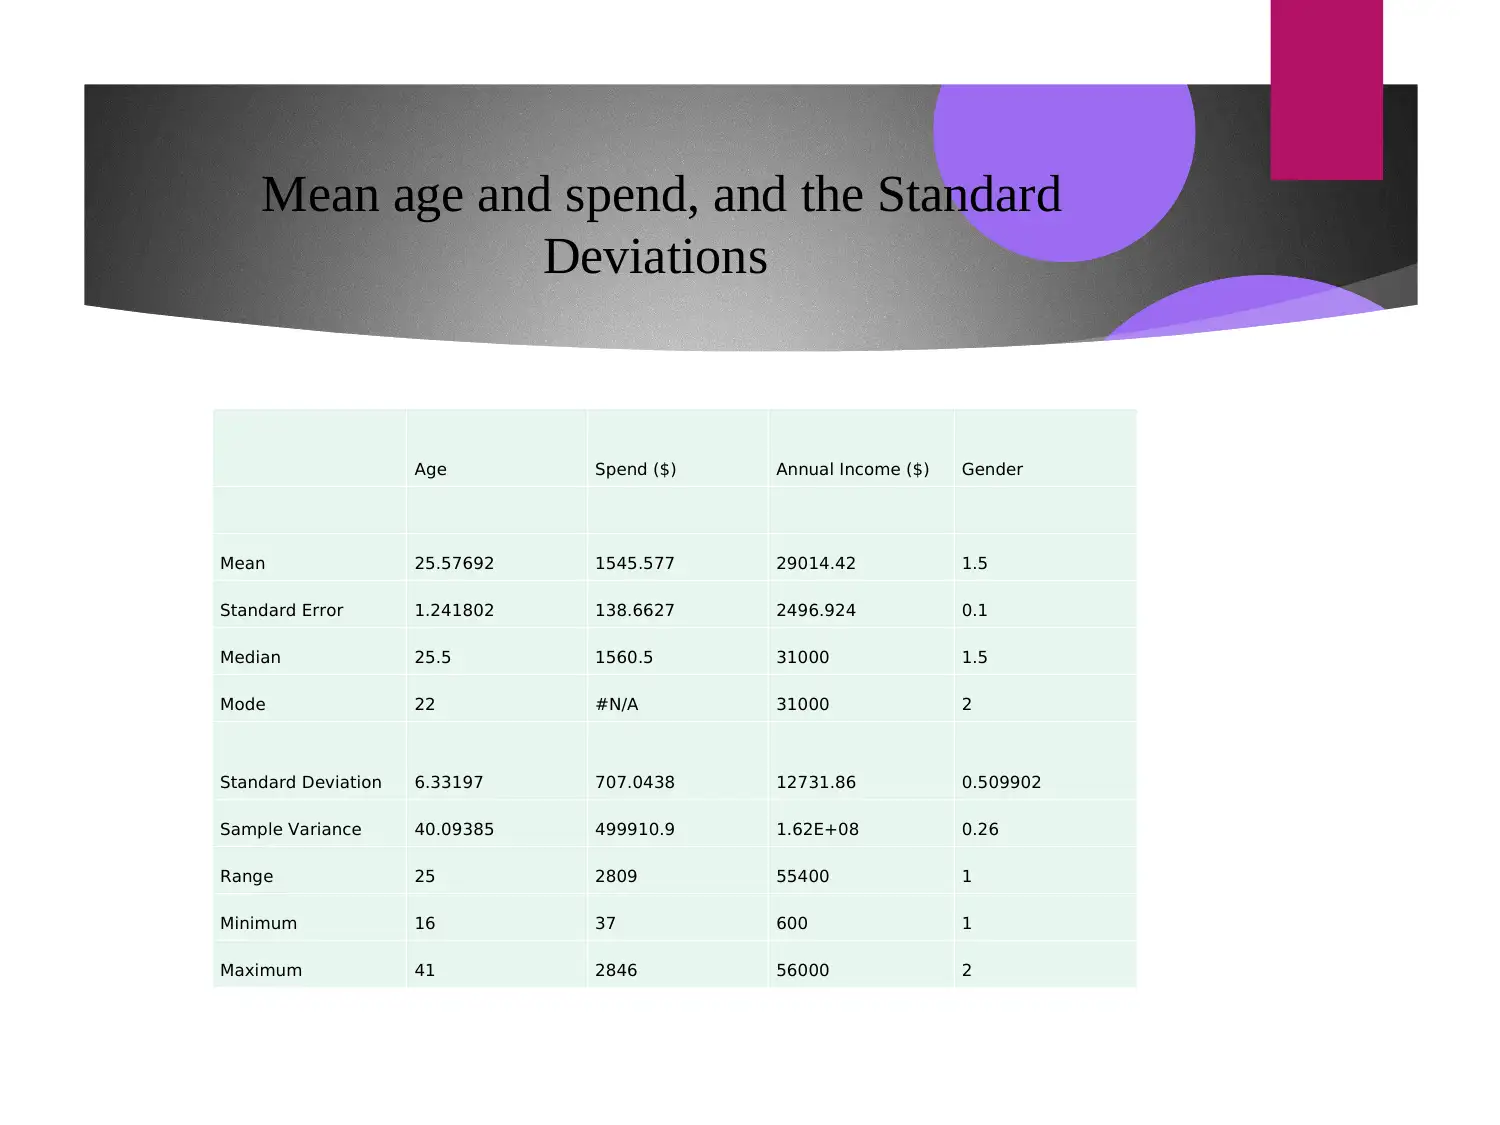
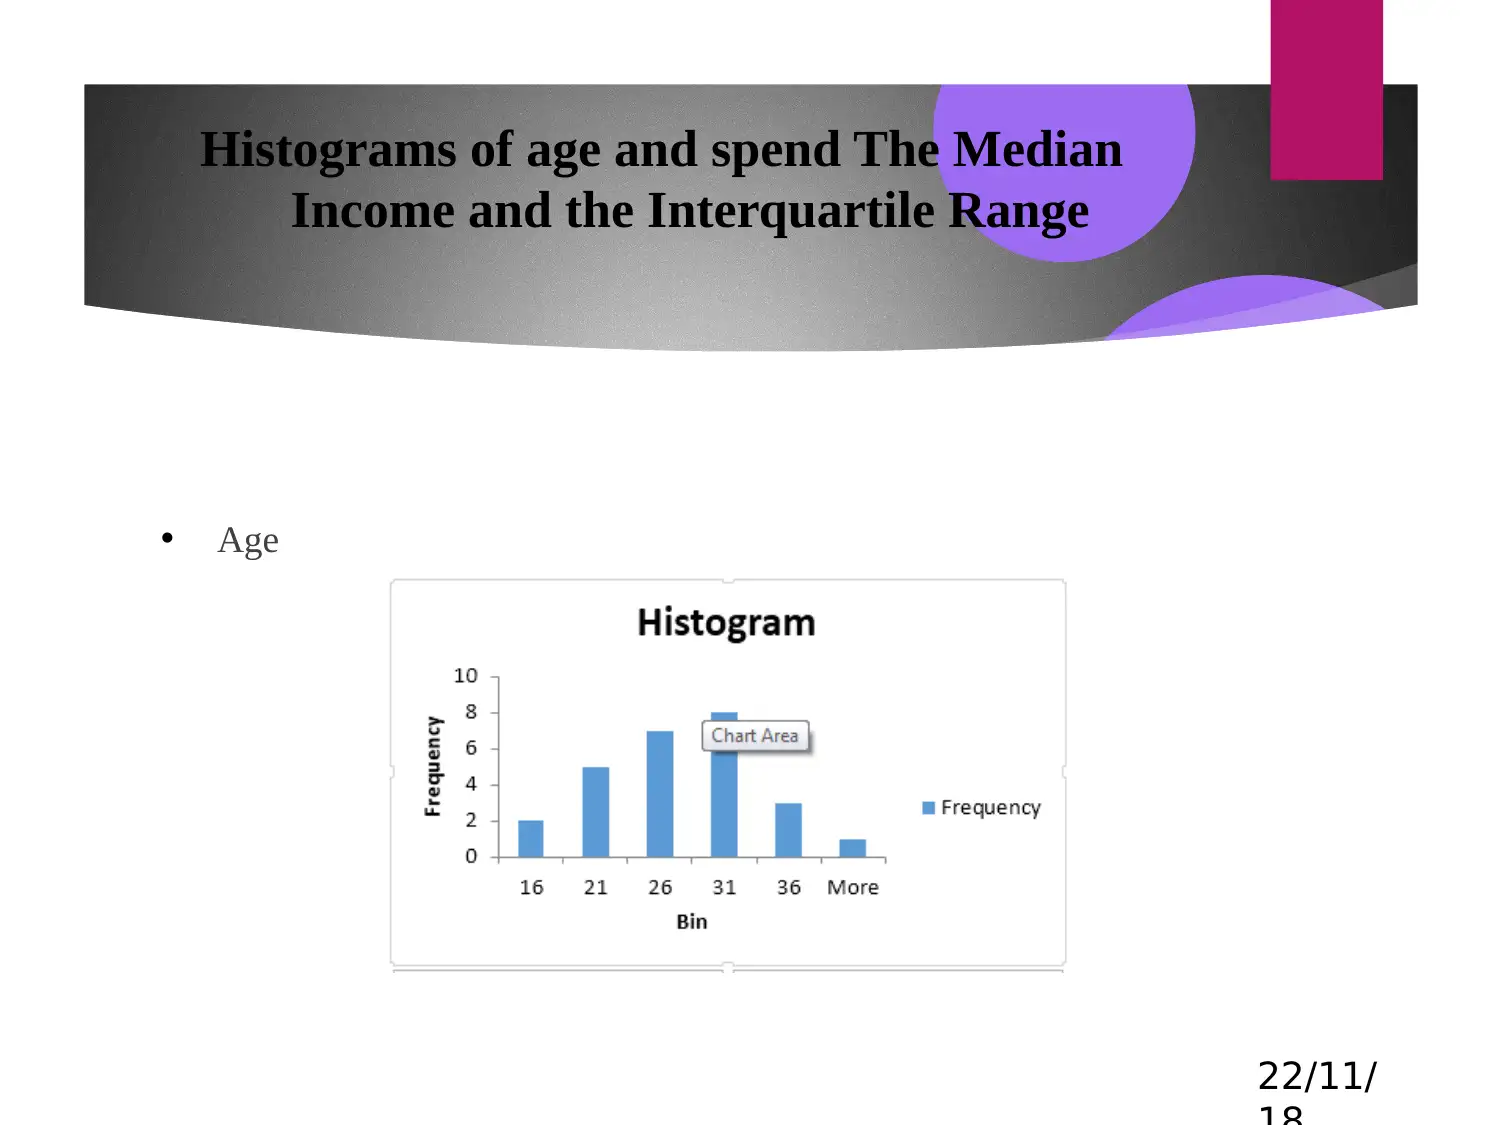
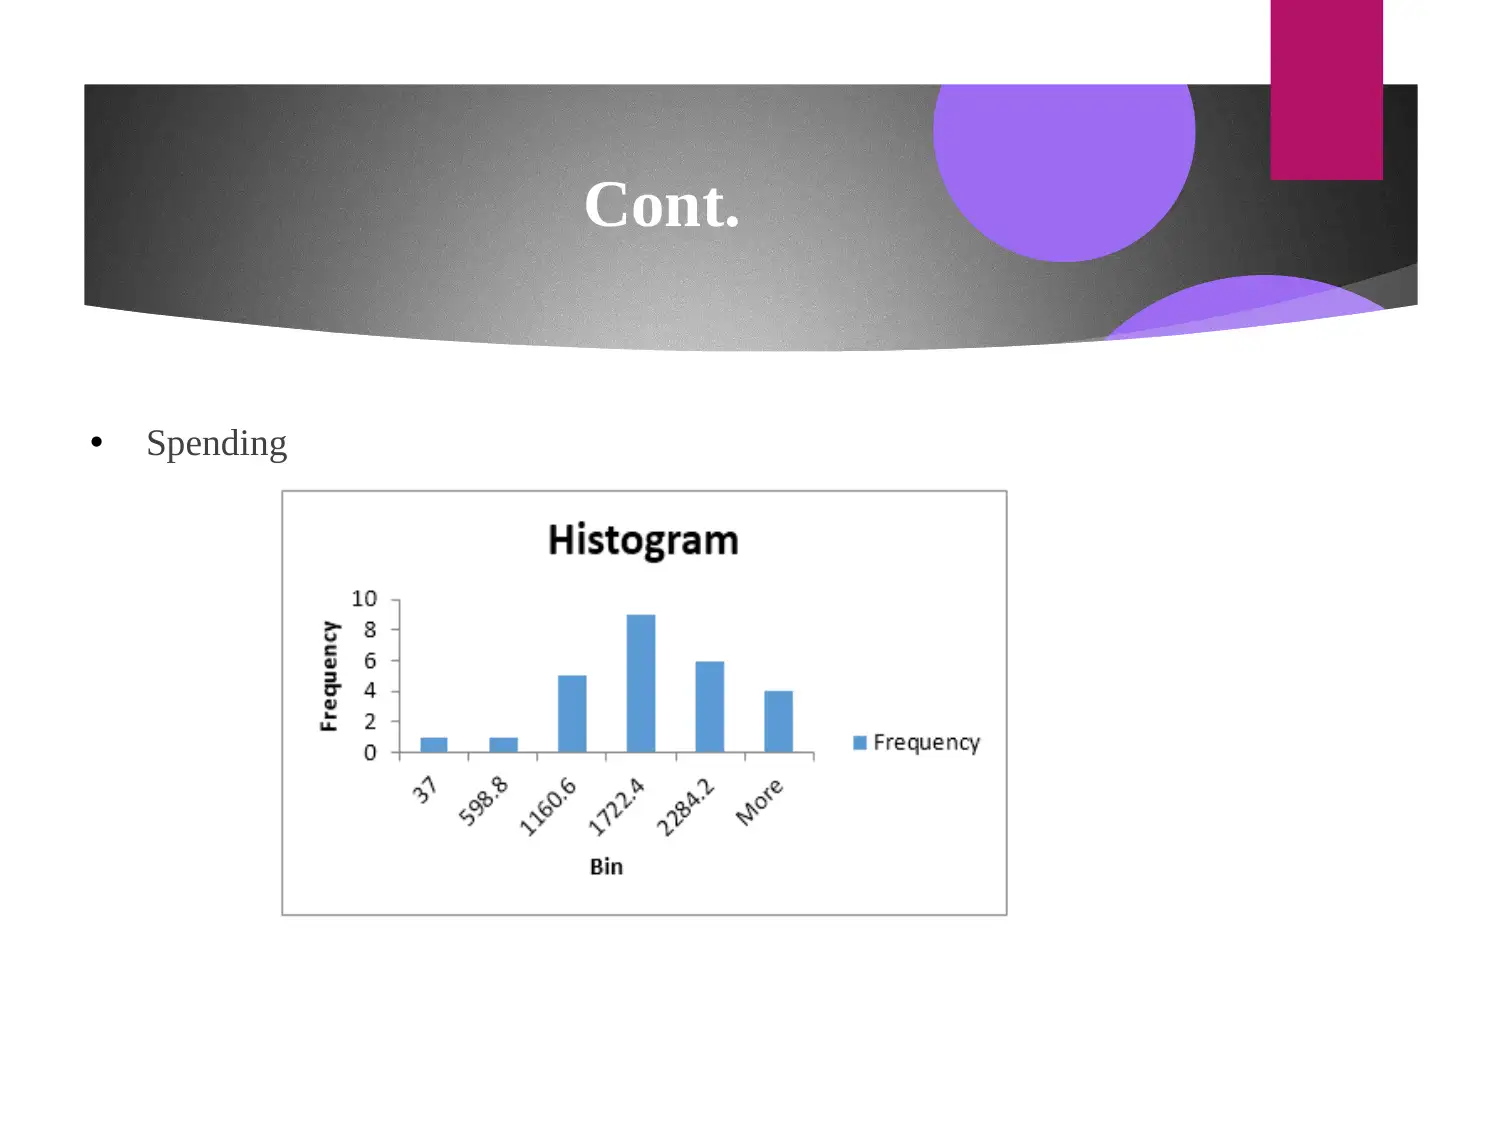
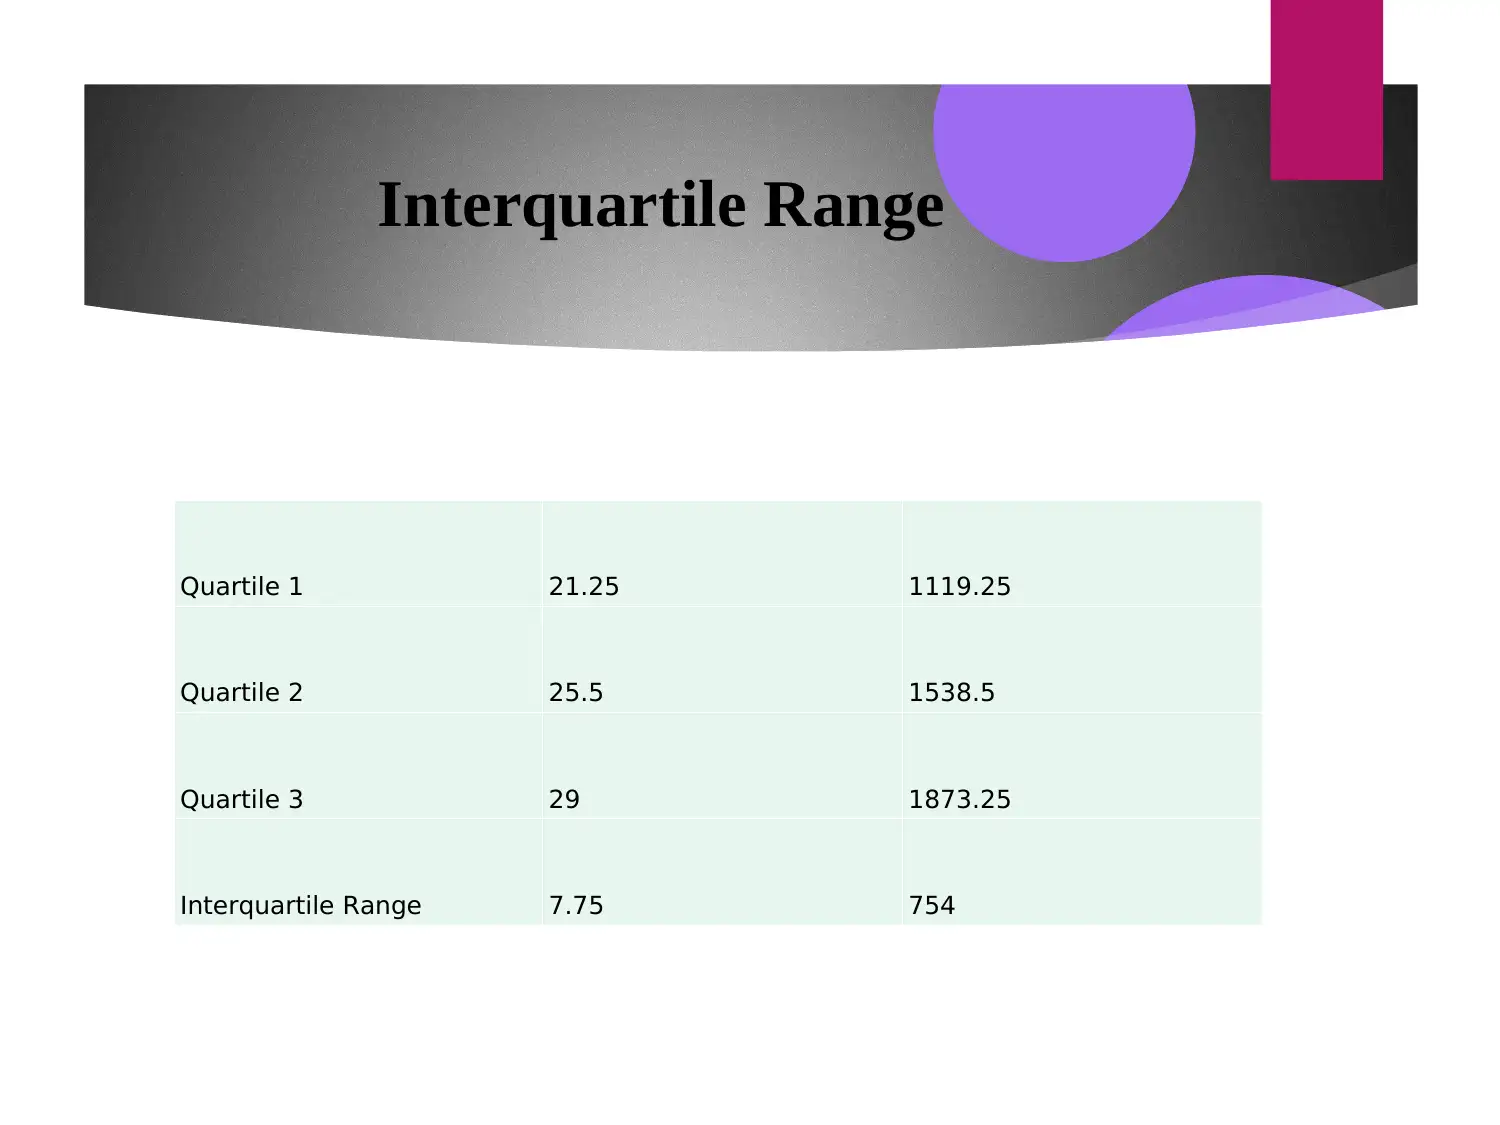
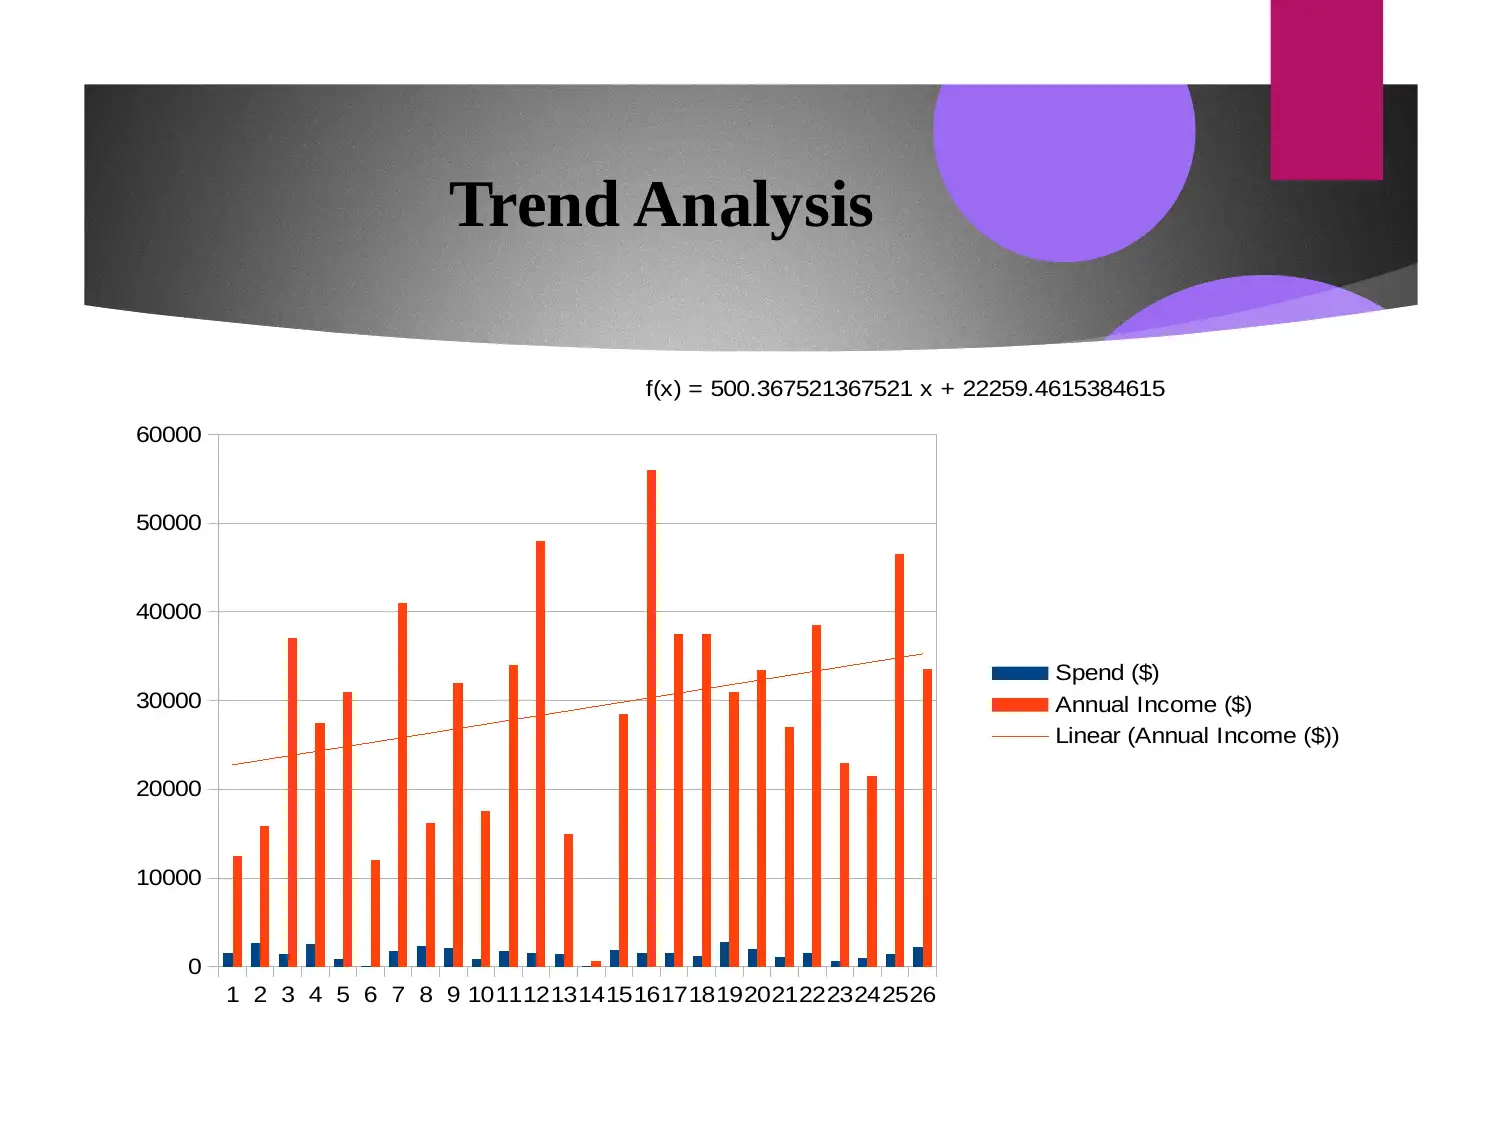
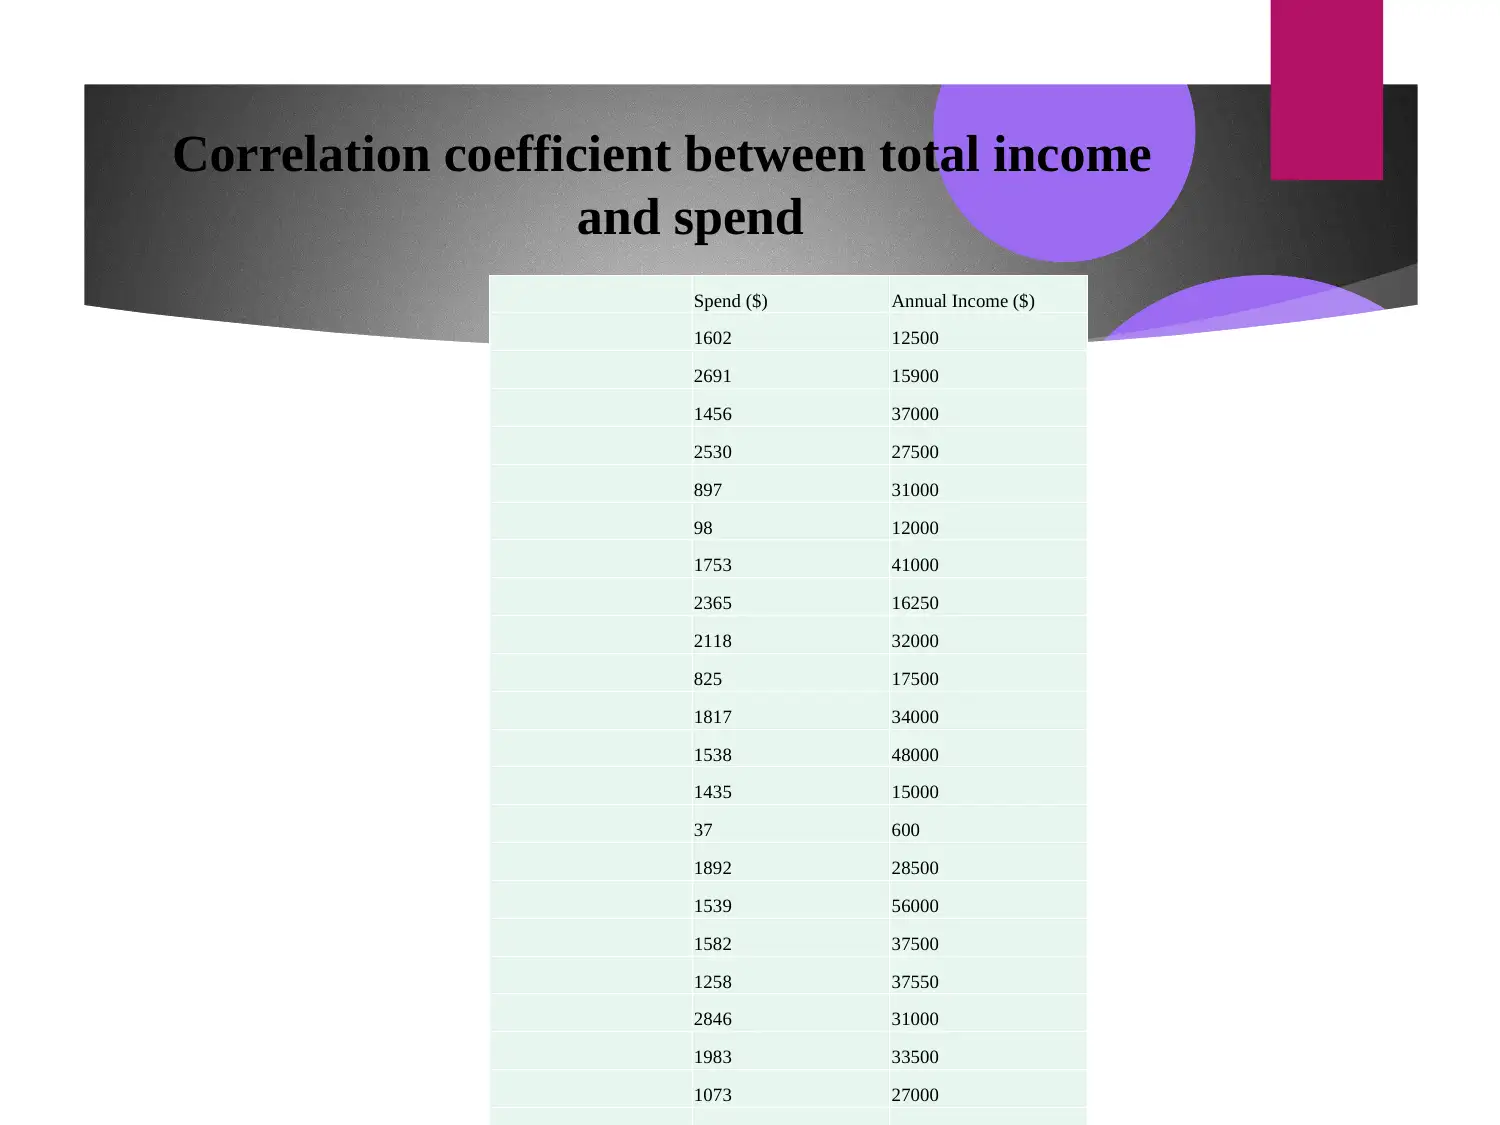
This assignment focuses on business data analysis and decision-making, covering key aspects such as data collection, analysis, and interpretation. The solution includes an analysis of existing customer data, calculating mean, standard deviation, and other statistical measures for age, spend, annual income, and gender. It presents histograms for age and spending, analyzes the median income and interquartile range, and performs trend analysis with a linear regression model. The assignment also includes a correlation analysis between total income and spending, providing a detailed breakdown of the data and its implications for business decisions. The document includes references to support the analysis. This assignment helps to understand the data and use it for decision-making.
Document Page
Our Existing Customer
tabler-icon-diamond-filled.svg

Paraphrase This Document

Need a fresh take? Get an instant paraphrase of this document with our AI Paraphraser
Document Page
Mean age and spend, and the Standard
Deviations
Age Spend ($) Annual Income ($) Gender
Mean 25.57692 1545.577 29014.42 1.5
Standard Error 1.241802 138.6627 2496.924 0.1
Median 25.5 1560.5 31000 1.5
Mode 22 #N/A 31000 2
Standard Deviation 6.33197 707.0438 12731.86 0.509902
Sample Variance 40.09385 499910.9 1.62E+08 0.26
Range 25 2809 55400 1
Minimum 16 37 600 1
Maximum 41 2846 56000 2
Document Page
Histograms of age and spend The Median
Income and the Interquartile Range
Age
22/11/
Document Page
Cont.
Spending
tabler-icon-diamond-filled.svg

Paraphrase This Document

Need a fresh take? Get an instant paraphrase of this document with our AI Paraphraser
Document Page
Interquartile Range
Quartile 1 21.25 1119.25
Quartile 2 25.5 1538.5
Quartile 3 29 1873.25
Interquartile Range 7.75 754
Document Page
Trend Analysis
1 2 3 4 5 6 7 8 9 1011121314151617181920212223242526
0
10000
20000
30000
40000
50000
60000
f(x) = 500.367521367521 x + 22259.4615384615
Spend ($)
Annual Income ($)
Linear (Annual Income ($))
Document Page
Correlation coefficient between total income
and spend
Spend ($) Annual Income ($)
1602 12500
2691 15900
1456 37000
2530 27500
897 31000
98 12000
1753 41000
2365 16250
2118 32000
825 17500
1817 34000
1538 48000
1435 15000
37 600
1892 28500
1539 56000
1582 37500
1258 37550
2846 31000
1983 33500
1073 27000
tabler-icon-diamond-filled.svg

Paraphrase This Document

Need a fresh take? Get an instant paraphrase of this document with our AI Paraphraser
Document Page
REFERENCES
Baker, A.J., 2018. Business decision making. Routledge.
Thirumalai, C. and Senthilkumar, M., 2017, February. An Assessment Framework
of Intuitionistic Fuzzy Network for C2B Decision Making. In Electronics and
Communication Systems (ICECS), 2017 4th International Conference on (pp.
164-167). IEEE.
Rothman, D.J., 2017. Strangers at the bedside: a history of how law and bioethics
transformed medical decision making. Routledge.
Document Page
THANK YOU
chevron_up_icon
1 out of 9
circle_padding
hide_on_mobile
zoom_out_icon
[object Object]