Business Decision Making: Data Visualization and Interpretation Report
VerifiedAdded on 2023/04/05
|12
|557
|499
Report
AI Summary
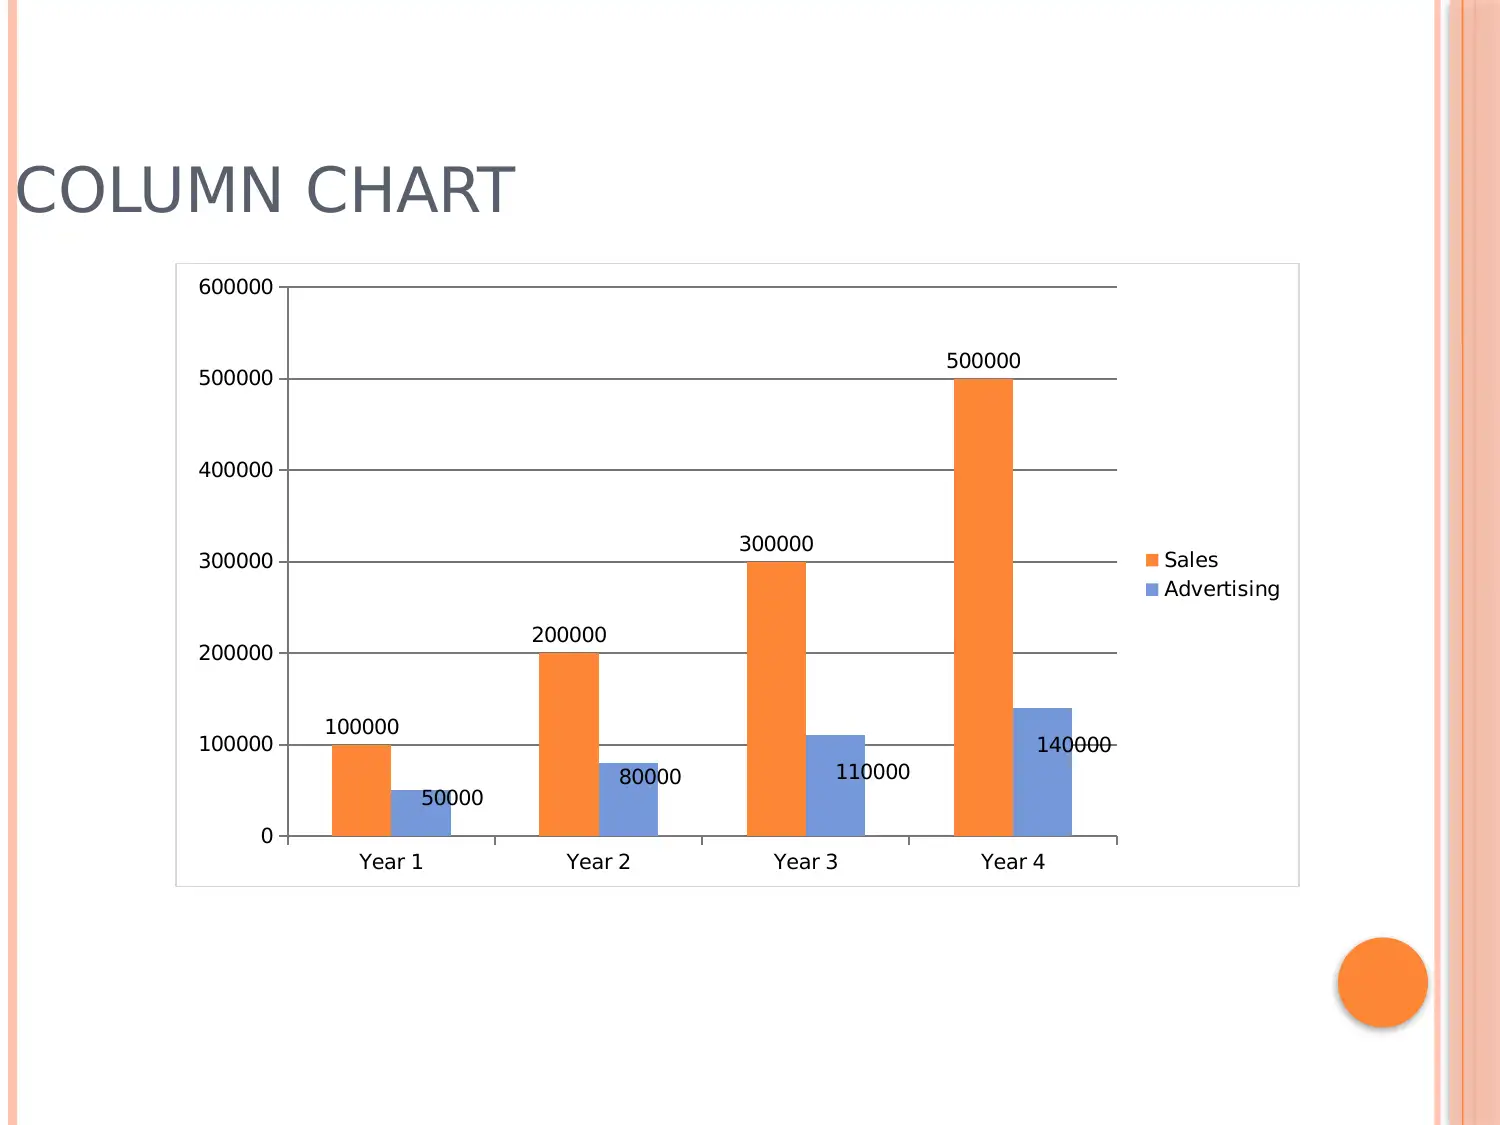
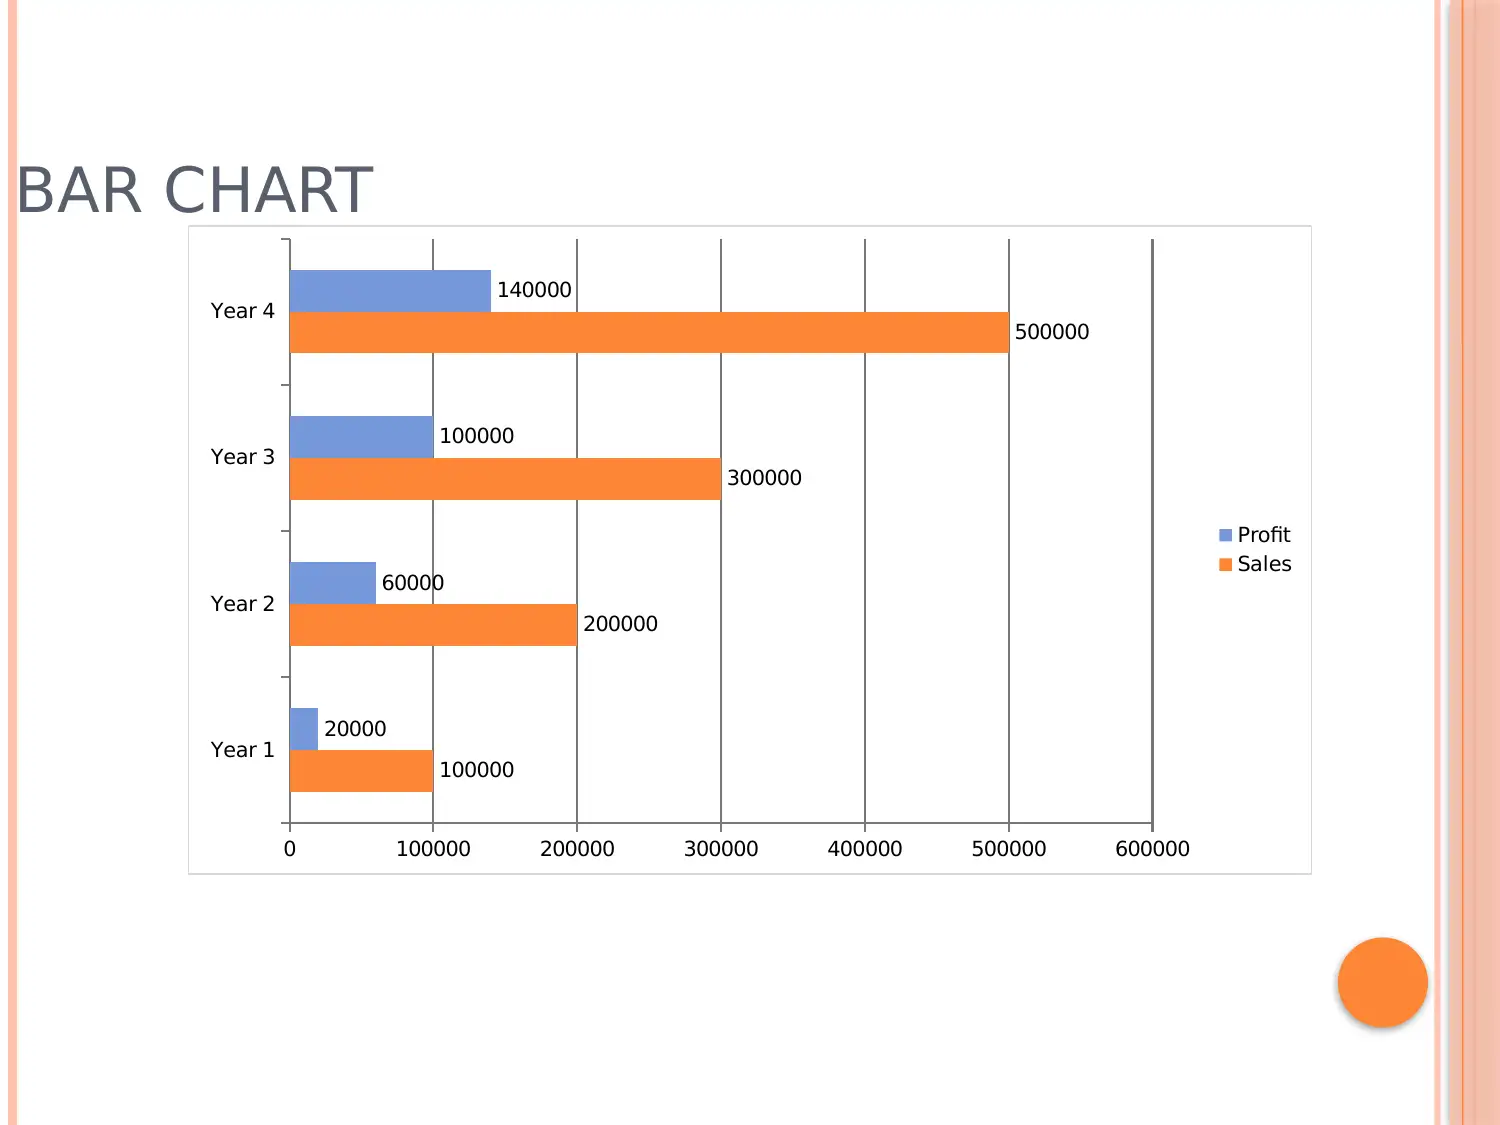
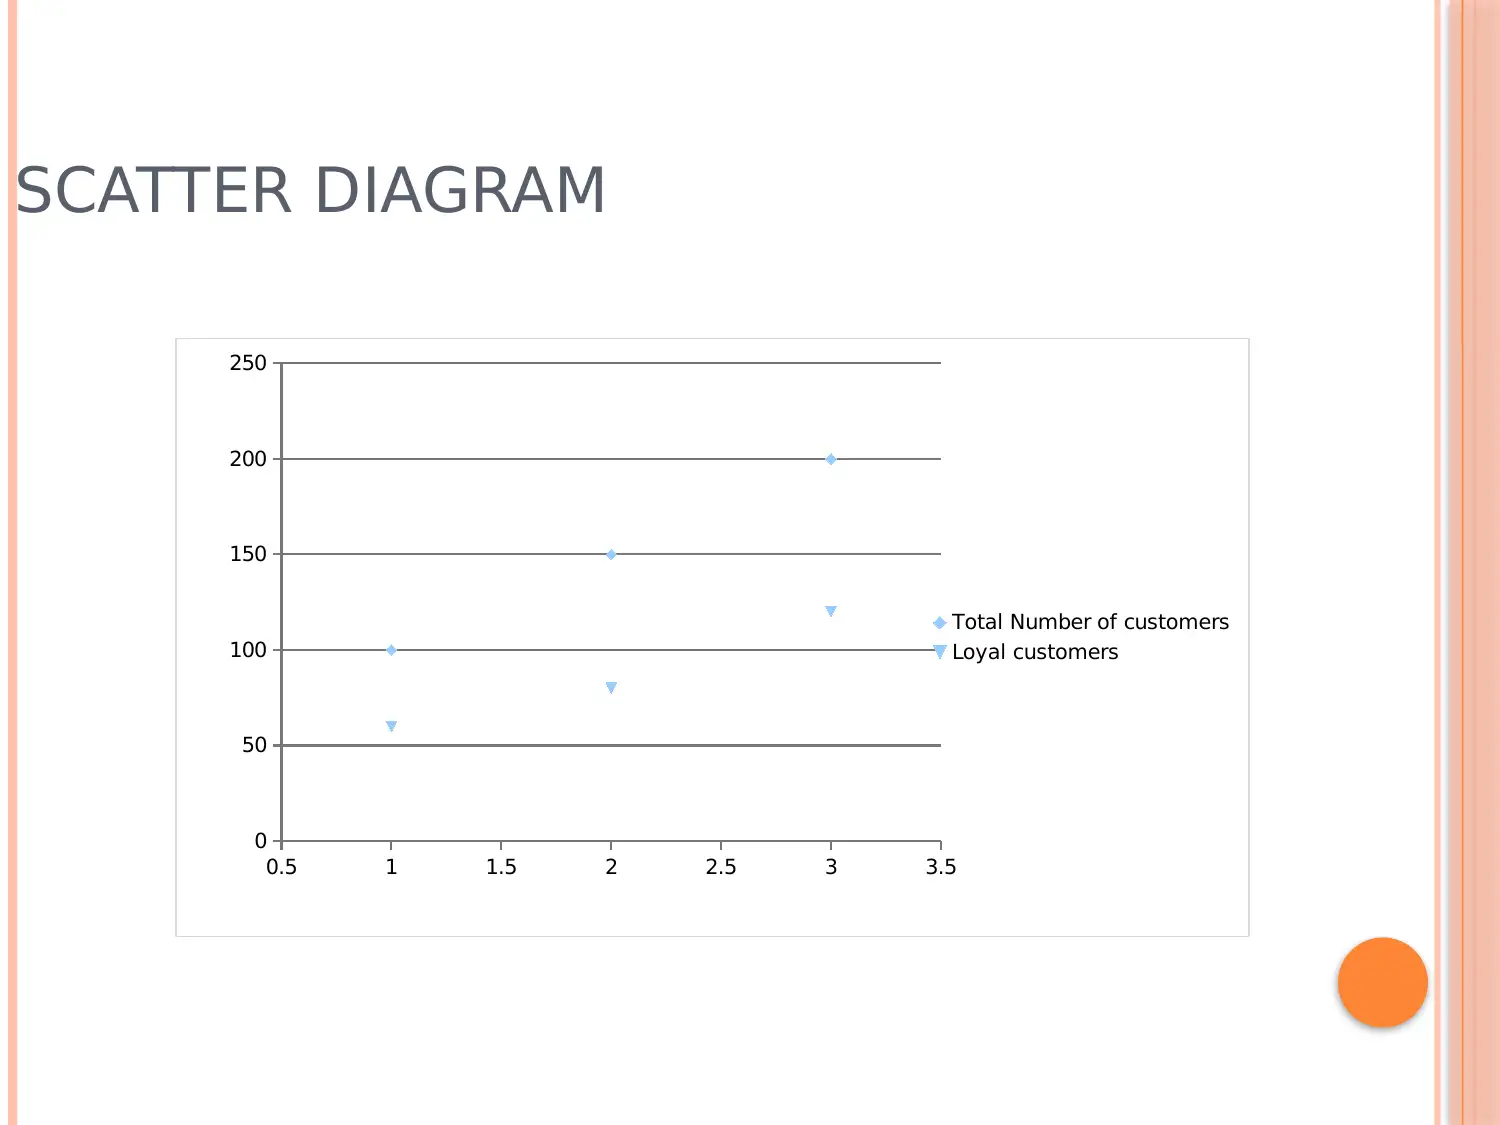
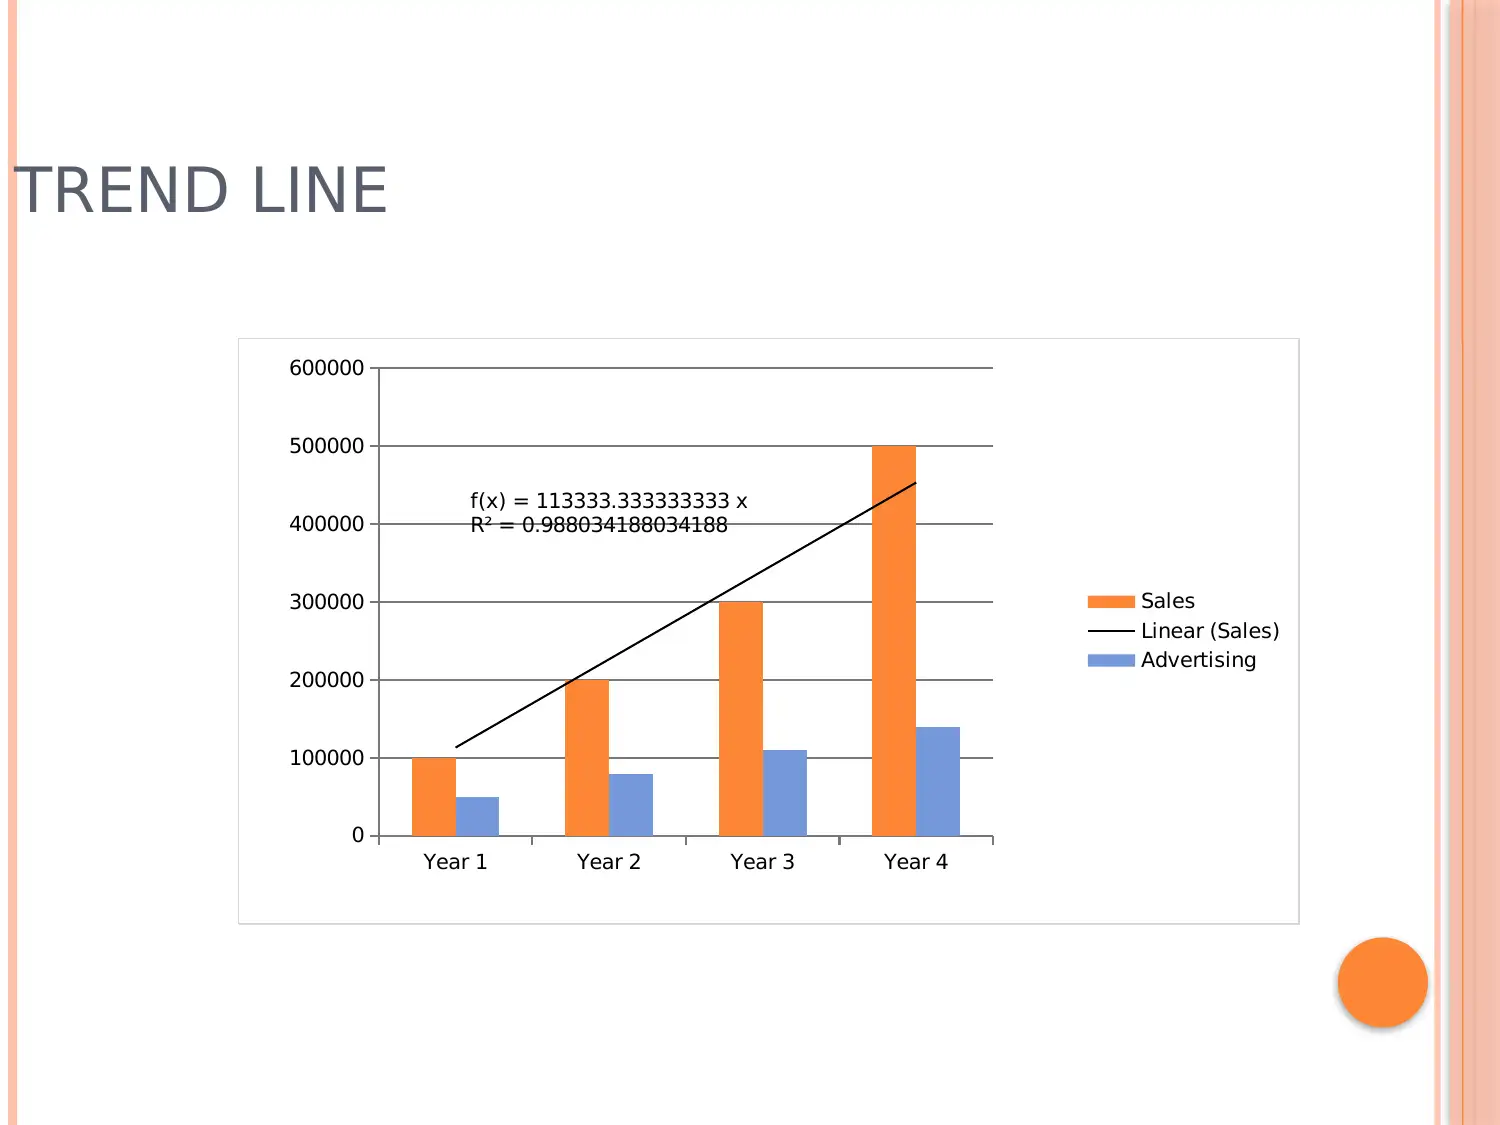
This report provides an analysis of business data using various visualization techniques, including column charts, bar charts, scatter diagrams, and trend lines. The column chart demonstrates the relationship between sales and advertising expenses, showing a direct correlation where increased advertising leads to higher sales. The bar chart illustrates the relationship between sales and profit, indicating a proportional relationship between these variables. The scatter diagram depicts the relationship between the total number of customers and loyal customers, highlighting the importance of customer retention for business growth. The trend line serves as a forecasting tool, predicting future sales based on existing market trends. The report also includes references to academic sources supporting the analysis. This report aims to provide insights into data-driven decision-making in a business context, showcasing how different data visualization methods can aid in understanding market dynamics, sales performance, and customer behavior.


1 out of 12
Related Documents


Your All-in-One AI-Powered Toolkit for Academic Success.
+13062052269
info@desklib.com
Available 24*7 on WhatsApp / Email
![[object Object]](/_next/static/media/star-bottom.7253800d.svg)
Copyright © 2020–2026 A2Z Services. All Rights Reserved. Developed and managed by ZUCOL.