Business Data Analysis Report: Leeds Weather and Statistics
VerifiedAdded on 2021/01/02
|6
|882
|114
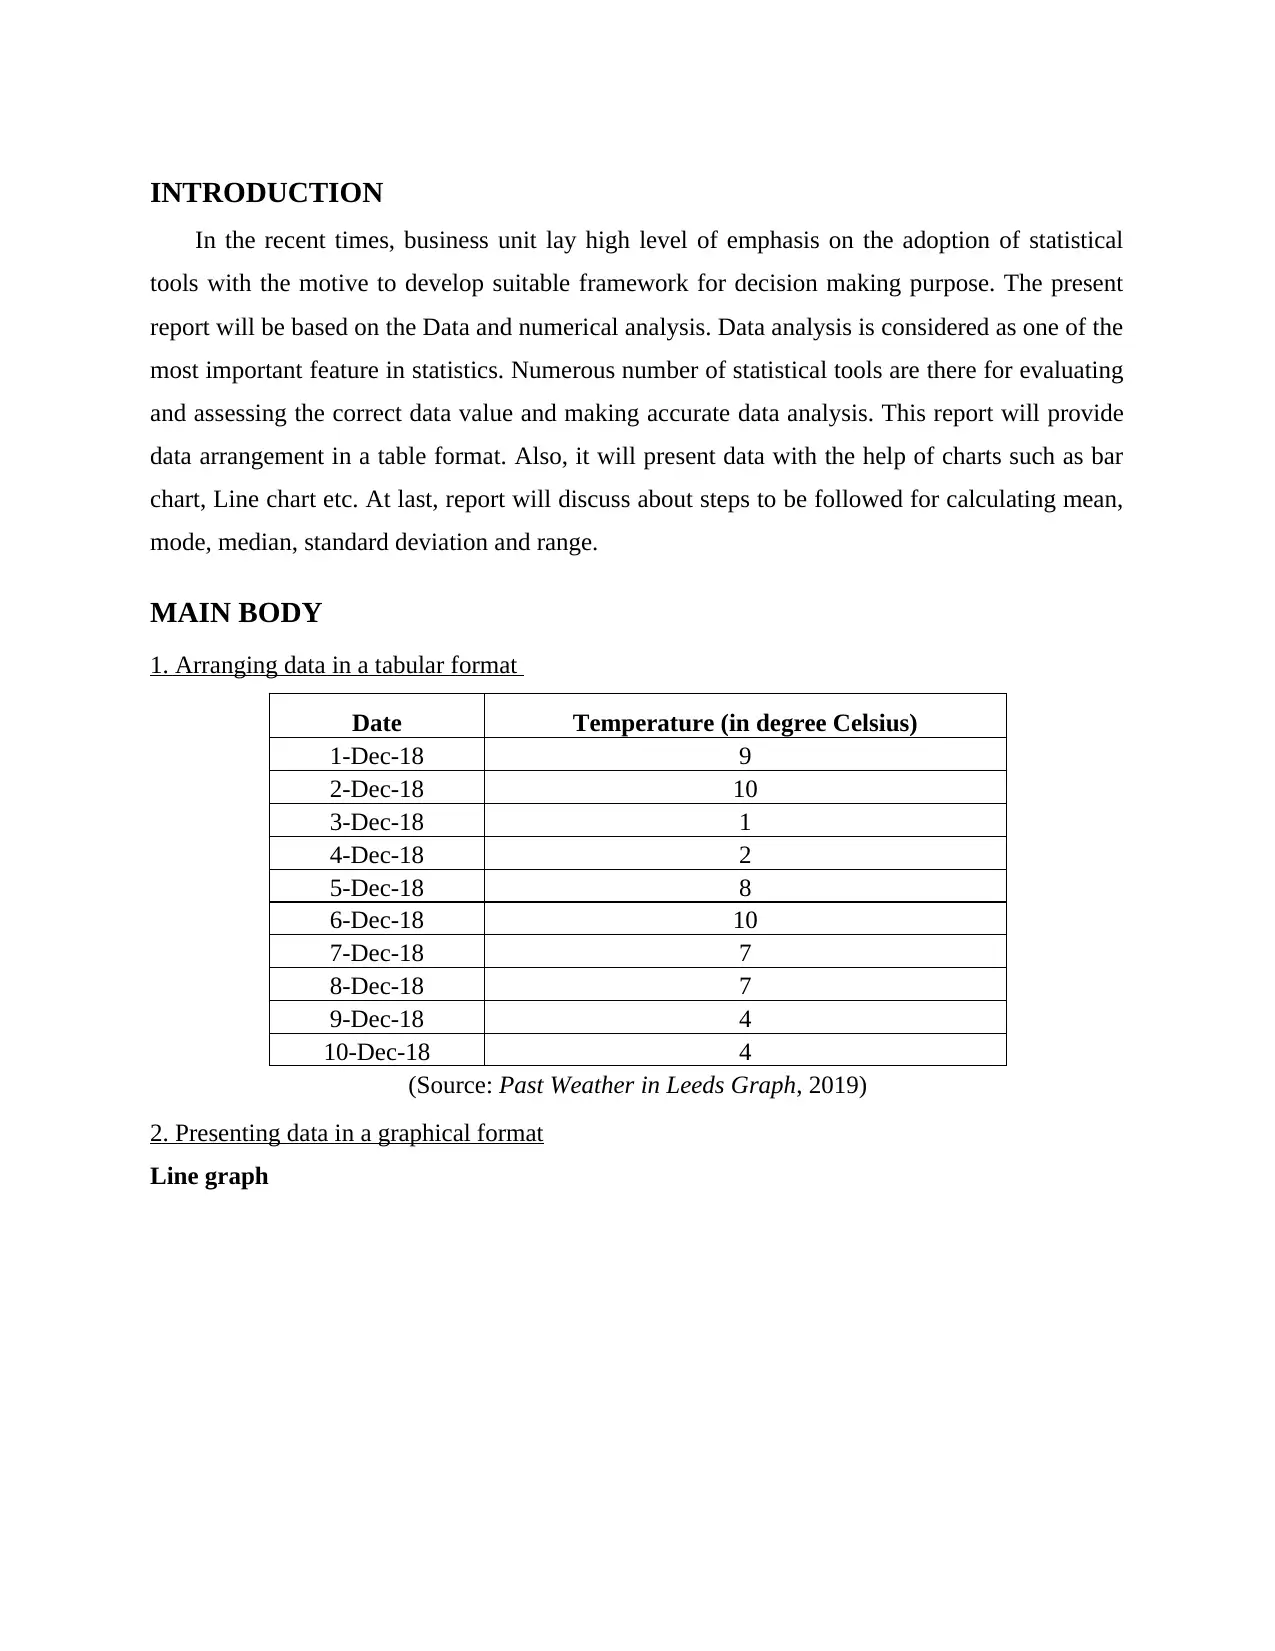
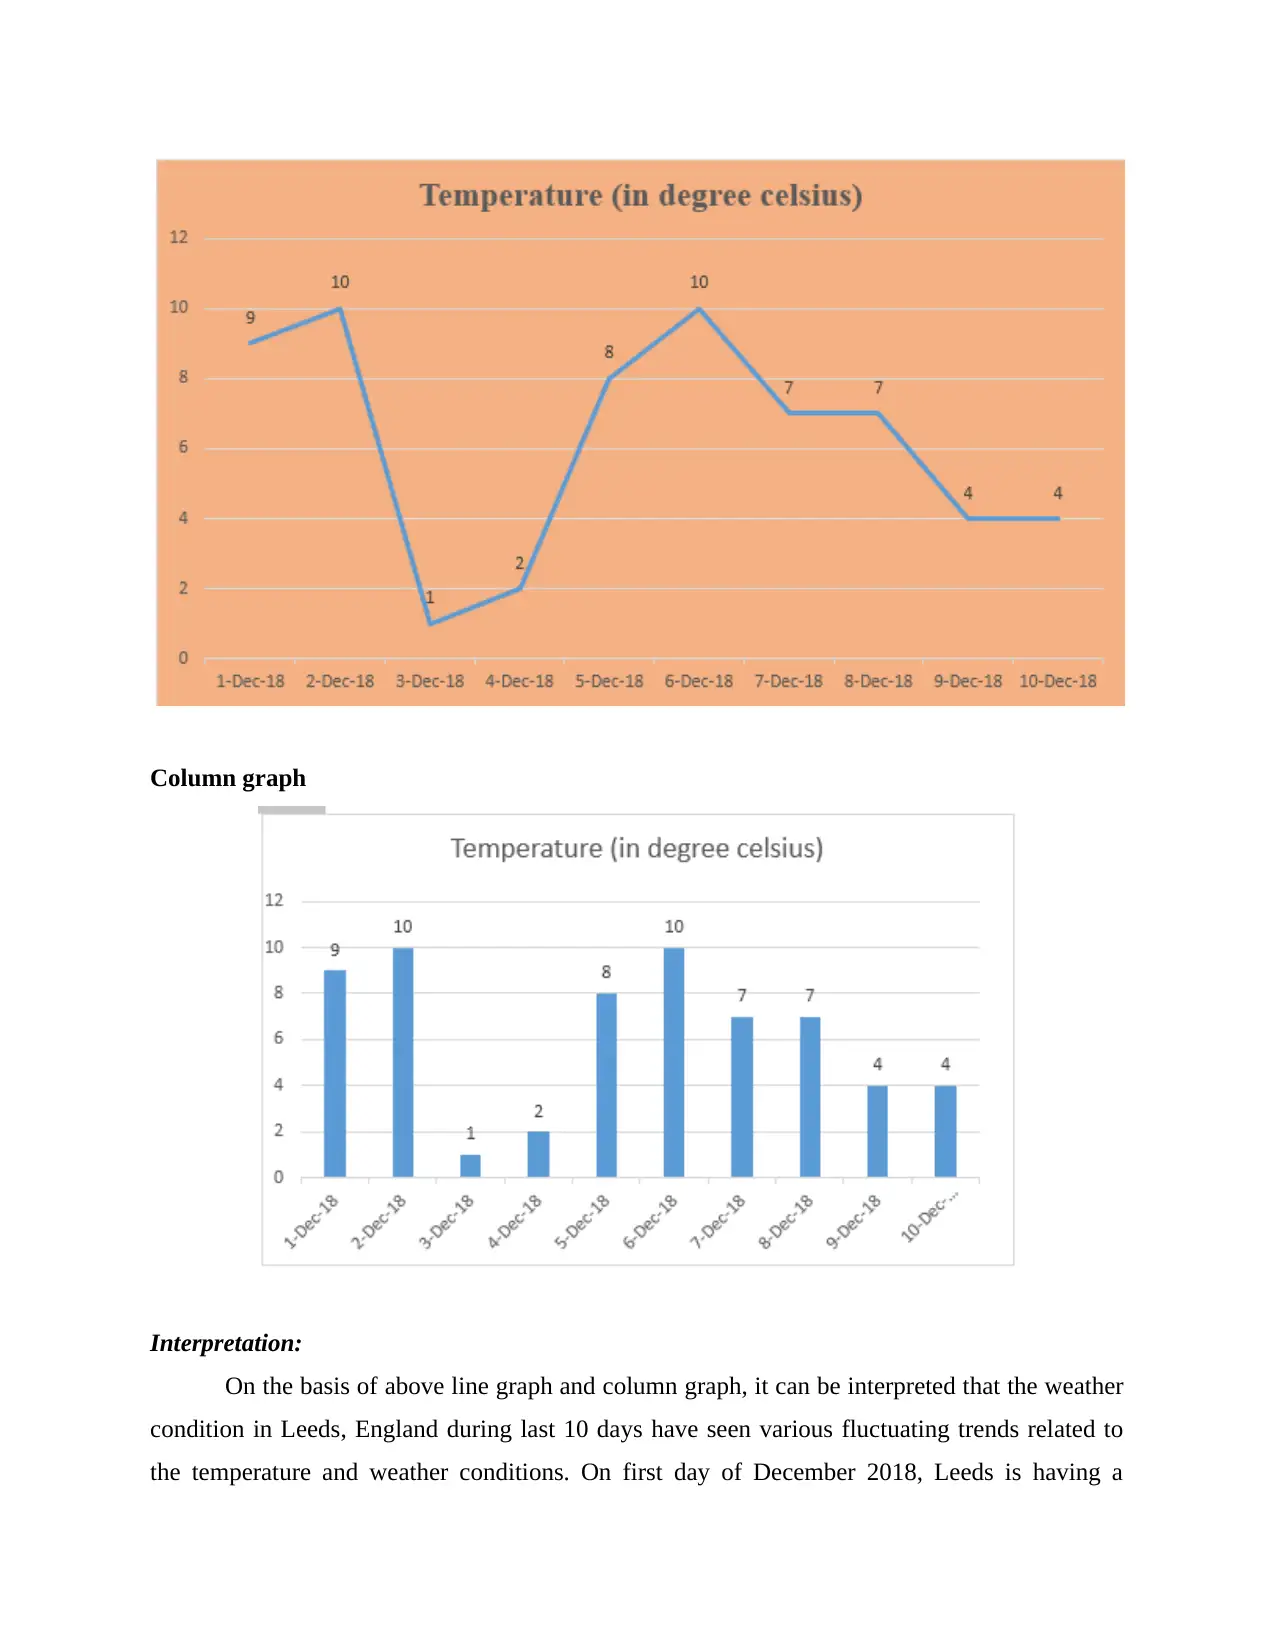
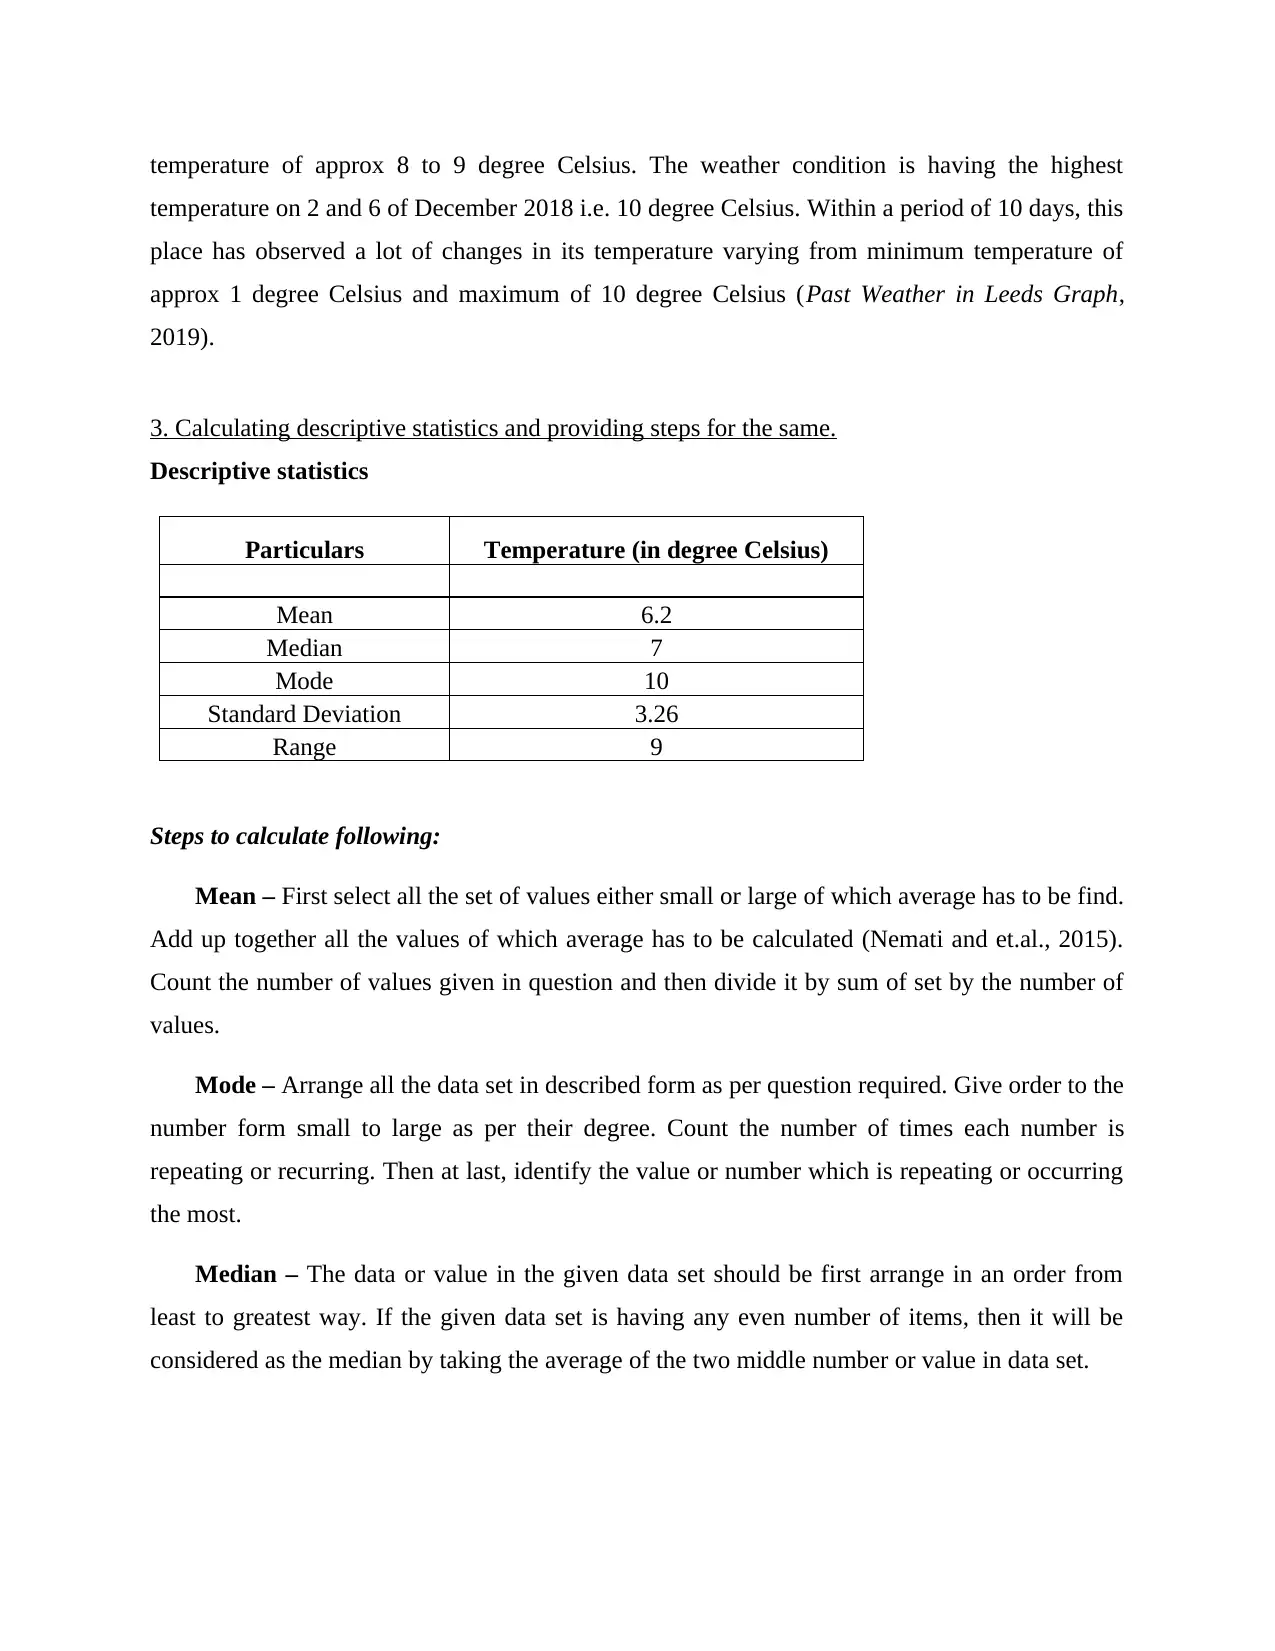
Report
AI Summary
This report focuses on data analysis, a crucial aspect of statistics, emphasizing its significance in business decision-making. It organizes data in a tabular format, presents it visually through line and column graphs, and provides an interpretation of the Leeds weather data over a 10-day period in December 2018. The report then delves into descriptive statistics, detailing the calculation steps for mean, mode, median, standard deviation, and range. References include books, journals, and online sources that support the analysis and statistical methods used. This report aims to provide a clear understanding of data analysis techniques and their application in a business context.
1 out of 6
Related Documents


Your All-in-One AI-Powered Toolkit for Academic Success.
+13062052269
info@desklib.com
Available 24*7 on WhatsApp / Email
![[object Object]](/_next/static/media/star-bottom.7253800d.svg)
Copyright © 2020–2026 A2Z Services. All Rights Reserved. Developed and managed by ZUCOL.