STAT102 Business Data Analysis: Facts from Figures Assignment

Verified

Added on  2022/11/25

|7
|677
|229
Homework Assignment
AI Summary
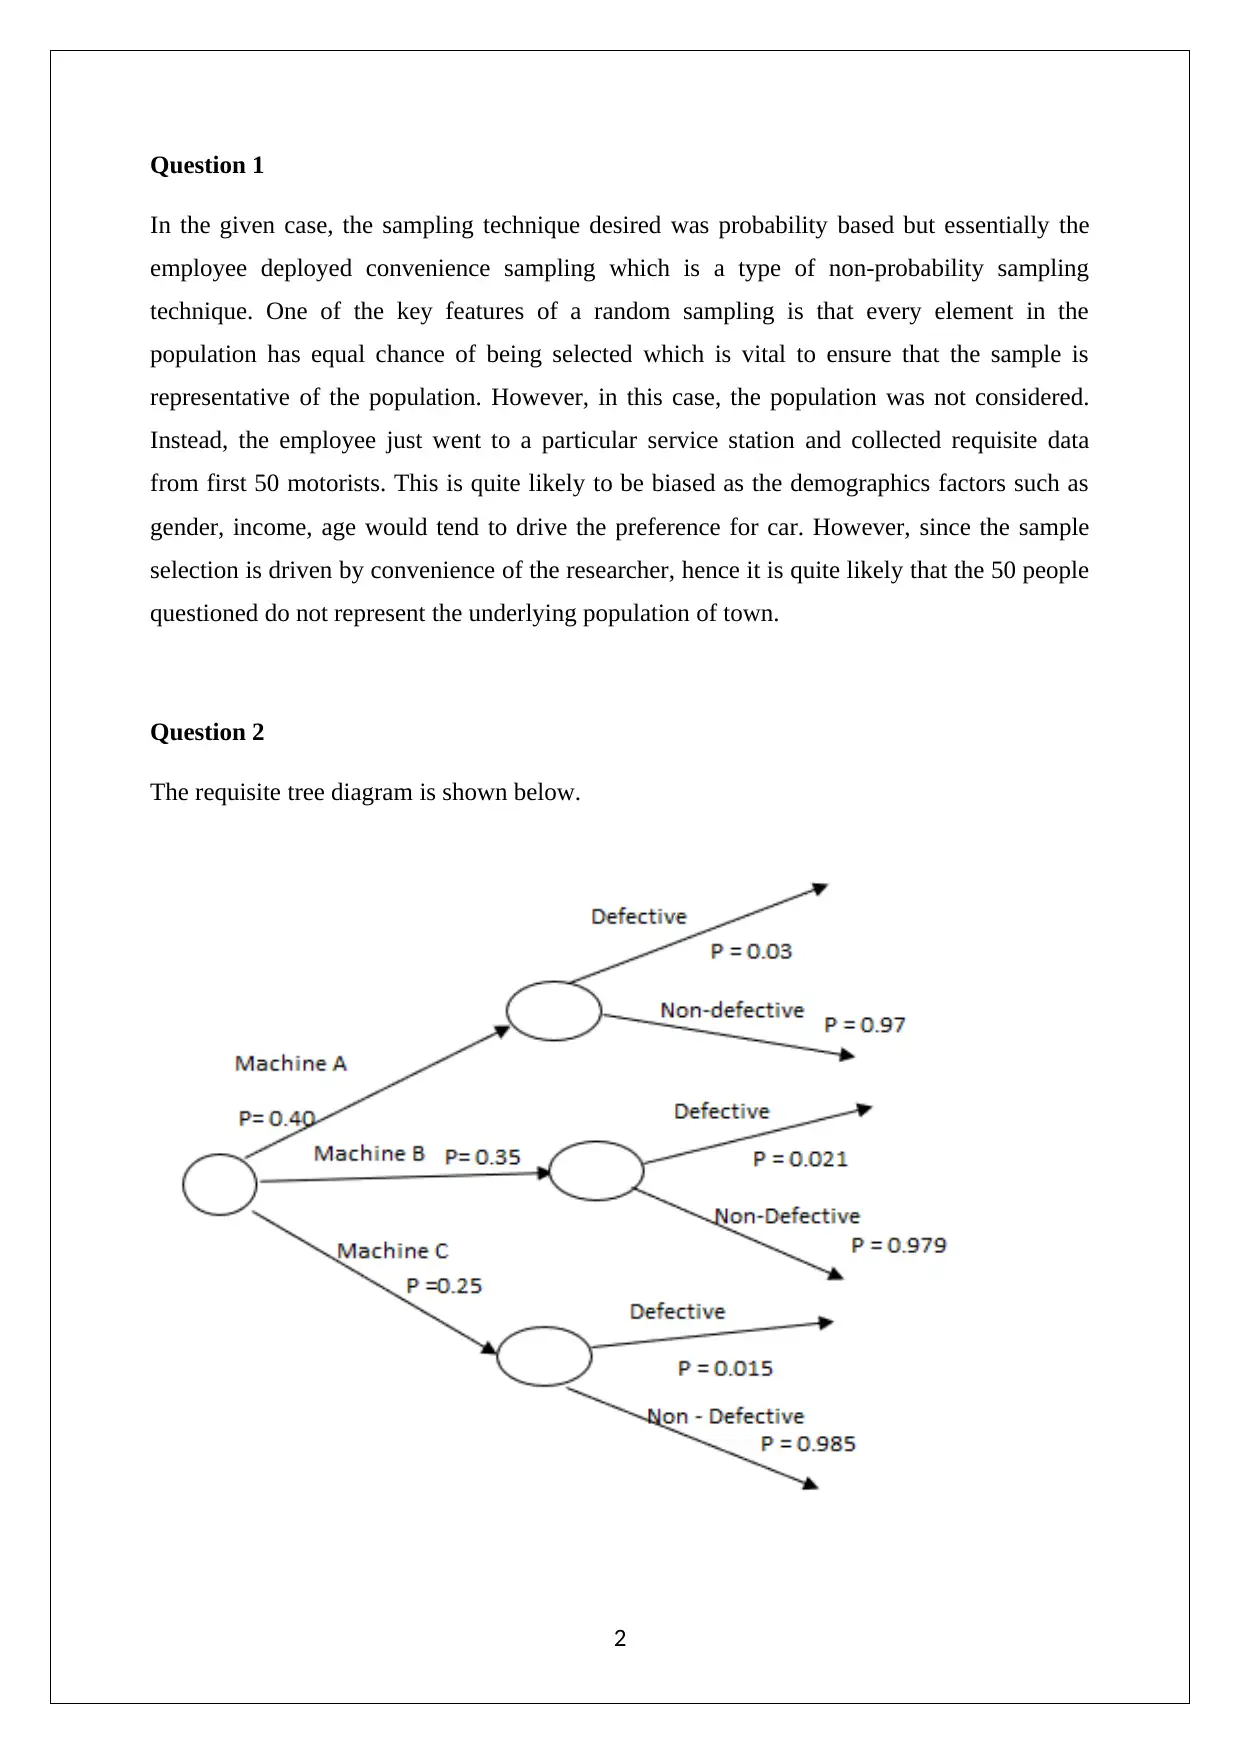
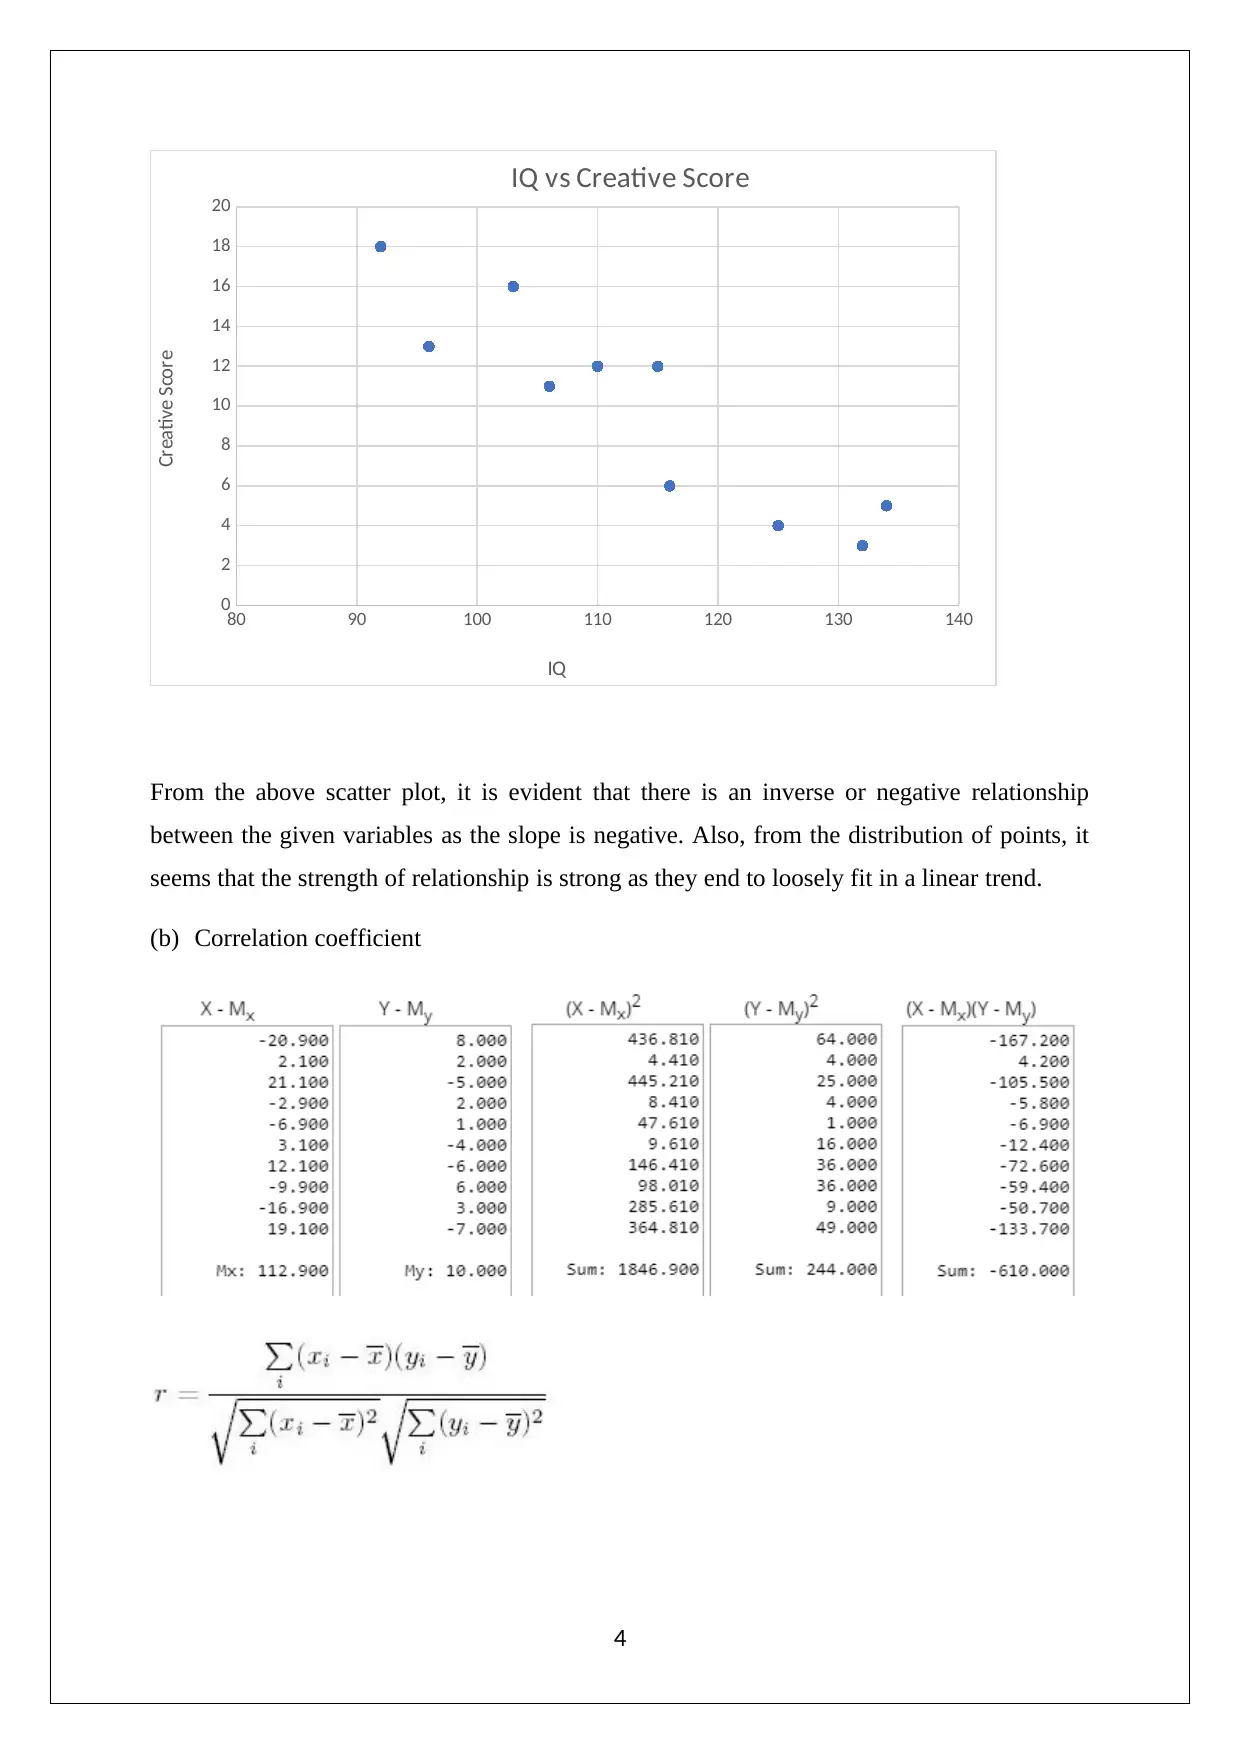
This document presents a complete solution to a STAT102 Business Data Analysis assignment from Peter Faber Business School. The assignment covers several key concepts, starting with an analysis of sampling bias in a car sales scenario, contrasting probability and non-probability sampling. It then includes a tree diagram analysis, followed by the calculation of a 95% confidence interval for the mean time spent sleeping by students using sample data. The solution continues with a scatter plot analysis to determine the relationship between variables and the calculation of the correlation coefficient, including hypothesis testing to assess the significance of the linear relationship. Finally, the assignment concludes with the calculation of unweighted aggregate price indices, including both Laspeyres and Paasche index methods, to illustrate the impact of different calculation methods on inflation measurement.
Document Page
BUSINESS DATA ANALYSIS
STUDENT ID:
[Pick the date]
tabler-icon-diamond-filled.svg

Paraphrase This Document

Need a fresh take? Get an instant paraphrase of this document with our AI Paraphraser
Document Page
Question 1
In the given case, the sampling technique desired was probability based but essentially the
employee deployed convenience sampling which is a type of non-probability sampling
technique. One of the key features of a random sampling is that every element in the
population has equal chance of being selected which is vital to ensure that the sample is
representative of the population. However, in this case, the population was not considered.
Instead, the employee just went to a particular service station and collected requisite data
from first 50 motorists. This is quite likely to be biased as the demographics factors such as
gender, income, age would tend to drive the preference for car. However, since the sample
selection is driven by convenience of the researcher, hence it is quite likely that the 50 people
questioned do not represent the underlying population of town.
Question 2
The requisite tree diagram is shown below.
2
Document Page
Question 3
Sample size = 50
Mean = 53 hours
Standard deviation = 10 hours
95% confidence interval =?
Standard error = Standard deviation/ SQRT (Sample size) = 10/ SQRT (50) = 1.4142
The population standard deviation is unknown and thus, t value would be used in place of z
value.
Degree of freedom = 10-1 = 9
The t stat = 2.0096
Margin of error = t stat * Standard error = 2.0096*1.4142 = 2.8420
Lower limit of 95% confidence interval = Mean - Margin of error =53 -2.8420 = 50.16
Upper limit of 95% confidence interval = Mean + Margin of error =53 +2.8420 = 55.84
95% confidence interval = [50.16 55.84]
It can be said with 95% confidence that the mean time spent sleeping by all the students
during the last week would fall between 50.16 and 55.84 hours.
Question 4
(a)Scatter plot
3
Document Page
80 90 100 110 120 130 140
0
2
4
6
8
10
12
14
16
18
20
IQ vs Creative Score
IQ
Creative Score
From the above scatter plot, it is evident that there is an inverse or negative relationship
between the given variables as the slope is negative. Also, from the distribution of points, it
seems that the strength of relationship is strong as they end to loosely fit in a linear trend.
(b) Correlation coefficient
4
tabler-icon-diamond-filled.svg

Paraphrase This Document

Need a fresh take? Get an instant paraphrase of this document with our AI Paraphraser
Document Page
Hence, correlation coefficient is -0.9087.
c) Significance level = 0.05
Null hypothesis H0: ρ=0
Alternative hypothesis Ha: ρ 0
Degree of freedom = n-2= 10-2 =8
The requisite formula for t statistics is shown below.
Hence, t = (-0.9087)*(10-2)0.5/(1-(-0.9087)2)0.5 = -6.16
P value for (df =8 and t- -6.16) = 0.000
It can be seen that the p value is lower than significance level and thus, sufficient
evidence is present to reject the null hypothesis and to accept the alternative hypothesis.
Therefore, it can be concluded that there is sufficient evidence present to conclude that
5
Document Page
there is a significant linear relationship between the variables and thus, correlation
coefficient is significant.
d) It can be concluded from the above that as the IQ of the child would increase, then the
corresponding creative score would decrease. It implies that variables are having strong
negative correlation.
Question 5
(a) Unweighted aggregate price indices for 2018
Total price ($) for 2018 = 18+5.10+1.5+2.90+10 = 37.5
Total price ($) for 2010 “Base Year” = 15.50 +4.35 +1.40 +1.80+9.20 = 32.25
Unweighted aggregate price indices for 2018¿ 37.5
32.25100=116.28
Unweighted aggregate price indices for 2018 would be 116.28.
(b) Laspeyres price index for year 2018 using 2010
Laspeyres price index for 2018= p 1 qo
po qo 10 0
Laspeyres price index for 2018=( 119.10
102.65 )100=116.025
6
Document Page
(c) Paasche index number for 2018
Passche index number for 2018= p 1 q 1
po q 1 100
Passche index number for 2018=156.10
133.25100=117.148
(d) From the above computations, it is evident that inflation during 2010-2018 period is
highest as per Paasche Index method and lowest using Laspeyres method. Further, it can
also be concluded that the inflation computation is dependent on the underlying manner
of construction of index.
7
chevron_up_icon
1 out of 7
circle_padding
hide_on_mobile
zoom_out_icon
[object Object]