Memo Template for Data Description and Analysis (Coursework)
VerifiedAdded on 2019/10/18
|11
|2480
|197
Homework Assignment
AI Summary
This assignment provides a detailed memo template designed for describing data and proposing its analysis for business-related decision-making. The template guides students through the process of crafting a memo, starting with an introduction that outlines the purpose, objective, and audience, followed by a description of the data source, its gathering methods, and limitations. The memo emphasizes the importance of univariate and bivariate data analysis, including the use of summary statistics, distributions, and histograms for numeric variables. It also offers guidance on interpreting the data, proposing a data analysis plan, and setting benchmarks for evaluating outcomes. The template includes sections on formatting, citations, style, and language, ensuring clarity and professionalism. The goal is to equip students with the skills to effectively communicate data insights and propose further analysis to inform business decisions.
Template for Memo 1 – Describing
data
Purpose
You are writing a memo after being asked to find data that might inform a business decision or settle an
important question or point of view on a topic. You believe you have found that data, and you are
proposing to put the time into going forward to analyze the data and report on the outcomes. You are
establishing to the reader that this data is indeed important, specifying exactly what the opportunities
as well as the limitations of this data set as a source of evidence. You will describe the data source,
how it was gathered, when, where, measuring what or whom. You will then describe the data by
showing basic summary statistics and distribution for the major variables you have available. You will
end by proposing that the analysis will prove to be useful for the business question at hand and request
permission to go forward in producing an analysis and finally a full report.
Overview
The following document includes step by step topics that need to be addressed, pages they need to be
on, where headers should be, charts and tables, conclusion and reference page. In addition, there is a
section briefly reviewing expected formatting, style, language and grammar.
Here are all of the steps you should carry out to successfully write a good memo. Follow these steps.
1. Get familiar with the narrative provided by the instructor and the data provided.
a. Look at the Variable Info or codebook page of the data to find out what variables exist,
where the data came from, how it was gathered, who gathered it, when and where.
b. Look at the data – note how the data is coded; note how many cases (rows of data) there are.
2. Produce and study the statistics – univariate and bivariate
a. Univariate
i. Descriptive statistics required for each variable you choose:
1. Numeric variable: Mean, median, standard deviation, min, max, range, count.
2. Categorical variable: Count, percentage of total.
ii. Distribution of numeric variable: Histogram of the numeric variable as a column chart.
3. Think about how you might want to interpret those statistics in light of the narrative.
a. Take notes as you study each step of the data analysis on your thoughts
4. Start writing.
a. Expected writing process:
i. Write your first draft “stream of consciousness” – just get your ideas written down.
Your second draft should revise to modify or choose a focus, and structure the whole
document in a disciplined fashion to serve that focus (getting rid of anything that
doesn’t help that one focus, no matter how interesting otherwise).
ii. Your third or fourth draft should start to refine the document for formatting, style,
language, citations. THIS IS WHERE YOU START USING THE TEMPLATE BELOW!!!
Page 1 of 11, tmp9nb9lfs3.docx
Paraphrase This Document
Need a fresh take? Get an instant paraphrase of this document with our AI Paraphraser
iii. Before you start that stage of refining your writing, take a look at the notes at the
bottom of this document on formatting, citations, style, and language at the end of
the document (or click link the following link using the control key): Click HERE.
Page 2 of 11, tmp9nb9lfs3.docx
bottom of this document on formatting, citations, style, and language at the end of
the document (or click link the following link using the control key): Click HERE.
Page 2 of 11, tmp9nb9lfs3.docx
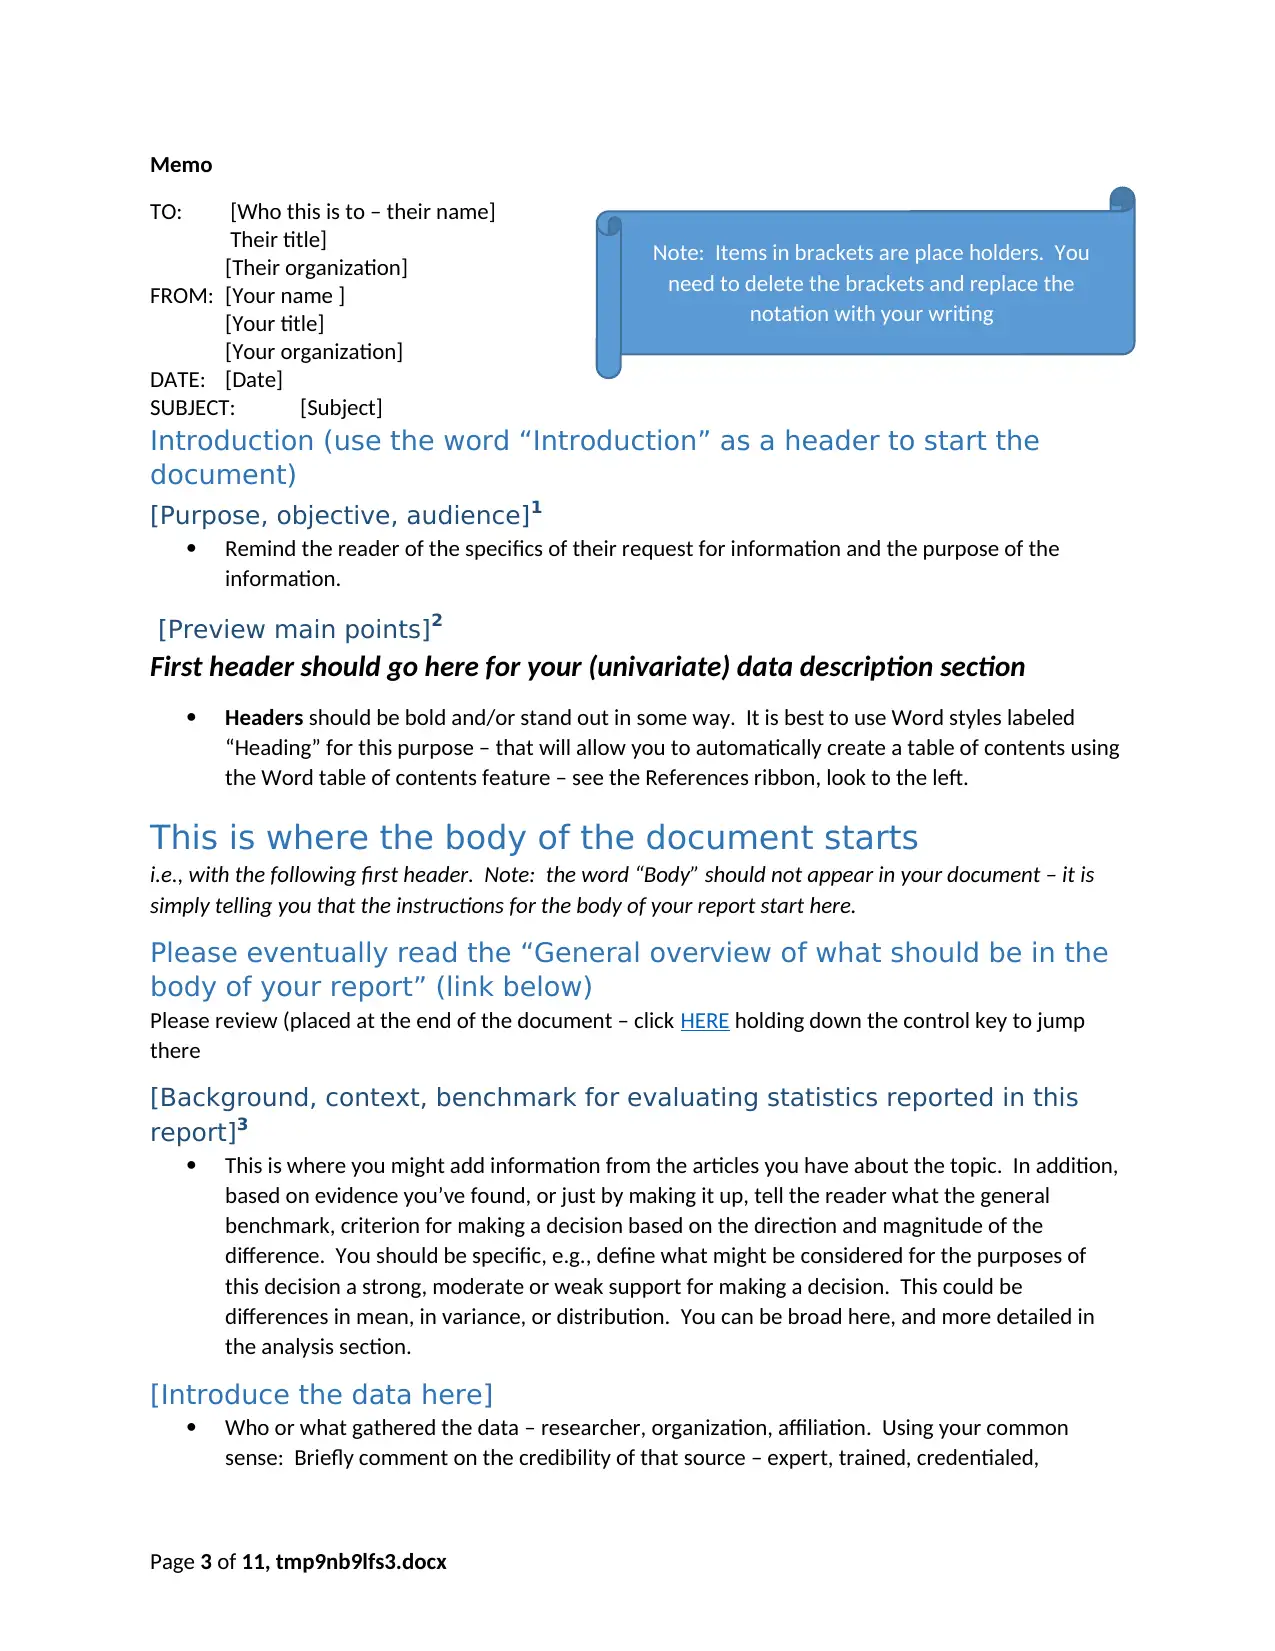
Memo
TO: [Who this is to – their name]
Their title]
[Their organization]
FROM: [Your name ]
[Your title]
[Your organization]
DATE: [Date]
SUBJECT: [Subject]
Introduction (use the word “Introduction” as a header to start the
document)
[Purpose, objective, audience]1
Remind the reader of the specifics of their request for information and the purpose of the
information.
[Preview main points]2
First header should go here for your (univariate) data description section
Headers should be bold and/or stand out in some way. It is best to use Word styles labeled
“Heading” for this purpose – that will allow you to automatically create a table of contents using
the Word table of contents feature – see the References ribbon, look to the left.
This is where the body of the document starts
i.e., with the following first header. Note: the word “Body” should not appear in your document – it is
simply telling you that the instructions for the body of your report start here.
Please eventually read the “General overview of what should be in the
body of your report” (link below)
Please review (placed at the end of the document – click HERE holding down the control key to jump
there
[Background, context, benchmark for evaluating statistics reported in this
report]3
This is where you might add information from the articles you have about the topic. In addition,
based on evidence you’ve found, or just by making it up, tell the reader what the general
benchmark, criterion for making a decision based on the direction and magnitude of the
difference. You should be specific, e.g., define what might be considered for the purposes of
this decision a strong, moderate or weak support for making a decision. This could be
differences in mean, in variance, or distribution. You can be broad here, and more detailed in
the analysis section.
[Introduce the data here]
Who or what gathered the data – researcher, organization, affiliation. Using your common
sense: Briefly comment on the credibility of that source – expert, trained, credentialed,
Page 3 of 11, tmp9nb9lfs3.docx
Note: Items in brackets are place holders. You
need to delete the brackets and replace the
notation with your writing
⊘ This is a preview!⊘
Do you want full access?
Subscribe today to unlock all pages.
Trusted by 1+ million students worldwide
experienced, detached (i.e., independent, objective, unbiased regarding object of student and
particular results that might emerge from the study); note: Best is university academic scholarly
study by specialist, Ph.D. academic, with no affiliation with any potentially economically,
politically, or socially interested party.
Provide details on where, when the data was gathered;
How was the data gathered: Universe sample, random sample, convenience (biased) sample.
Discuss opportunities and limitations of what questions the data can or cannot evidence.
To read the goals of this section see the endnote)4
[Uni-variate data analysis starts here]5
[Introduce your table(s)]6
Insert your tables
[Interpret – make comments about what this might mean.]
Paint a picture – see endnote 7
Note implications of univariate statistics and distribution that might have an implication for your
bi-variate analysis – see endnote 8
[Show a histogram – distribution – of your numeric variable.]
Before showing the histogram: Briefly mention why a distribution might be informative. Briefly
tell the reader what a ‘histogram’ is and how to interpret it.
[Interpret – make comments about what this might mean.]
See endnote for details: 9
Another header should go here for your discussion of your proposed data
analysis
Headers should be bold and/or stand out in some way. It is best to use Word styles labeled
“Heading” for this purpose – that will allow you to automatically create a table of contents using
the Word table of contents feature – see the References ribbon, look to the left.
[Discuss precisely what you will be comparing in your bi-variate
analysis, i.e., what statistics and tools (charts/histograms) you will use]
[Remind the reader and elaborate on if necessary your decision on
standards, benchmarks, criterion for evaluating outcomes – exactly
what difference in numbers or distributions would lead to what
decision]
[Conclusion]
Goal of this section – see endnote 10
Another header should go here – the word “Conclusion” or “Summary” is fine.
Page 4 of 11, tmp9nb9lfs3.docx
Paraphrase This Document
Need a fresh take? Get an instant paraphrase of this document with our AI Paraphraser
[Review your main points, i.e., remind the reader of what the value is of your data in helping them with
a decision. Propose going forward with the analysis, asking permission to carry out the next steps]
[Bibliography]
Header needed here – “References” or “Bibliography” is fine
Use APA Style for your references!!!!
Page 5 of 11, tmp9nb9lfs3.docx
a decision. Propose going forward with the analysis, asking permission to carry out the next steps]
[Bibliography]
Header needed here – “References” or “Bibliography” is fine
Use APA Style for your references!!!!
Page 5 of 11, tmp9nb9lfs3.docx
General overview of what should be in the body of your report
Data analysis: Before each step - Explain the next necessary step in the analysis to the reader,
why you are taking it, what statistic there is to address that question and how to interpret that.
o All charts, graphics and tables should be introduced, their value explained, and how to
read them before the reader encounters them. Your interpretation might come before
or after that chart or table
Headers. Make your document structure easy to understand and the overall takeaway through
use of headers. Your body should have headers that are meaningful – phrases that provide the
take-away for the text below. Ideally, a reader could look at all of the headers in the document
and get a sense of what it is all about and what the main take-away is. Avoid abstract terms in
headers and throughout your document if possible.
Orientation – Reviews/Previews: You need to sell the reader on paying close attention to every
section of your document, and reiterate important points. Note the main take away of the last
section and how it feeds into this section.
Your body must have orientation – always tell the reader what you are going to do, why, what
they are going to get out of it, then go into your analysis.
Any claims you make based on references should be cited in the text using APA style, e.g.,
(Colucci, 2016). This is at the end of the sentence with the period after the citation. See APA
Style page on Canvas or simple google APA style and you will find a plethora of guides and tools.
Page 6 of 11, tmp9nb9lfs3.docx
⊘ This is a preview!⊘
Do you want full access?
Subscribe today to unlock all pages.
Trusted by 1+ million students worldwide
General guidelines for formatting and writing
The following are not sections! They are simply notes to you, the writer. They are NOT to appear on
your report!
Formatting
Your document should have page numbers at the bottom.
Please use single spacing – NOT double spaced.
Paragraphs should be blocks, not indented first sentence.
Citations
In text citations when references are used in your writing are required, APA style, e.g., (Orwell,
1984). Note that the citation is at the end of the sentence, and the period is after the citation.
Citations should be used whenever you are utilizing information from references. Citations help
you convince the reader of your main claims – you are providing additional evidence – data, or
authoritative analysis – to support your claims which the reader might otherwise doubt or
disagree with.
Style
Assume the reader knows nothing about statistics or data analysis. Briefly tell the reader why
you are going through each step. Introduce everything to the reader – explain charts, tables,
and statistics. Use metaphors from everyday life and use a thesaurus for words to translate
technical statistical terms into every day meaningful language.
Data analysis writing credibility depends on the reader’s impression that the writer is
systematically and competently going through all valid steps in objectively gathering and
carefully interpreting data. This requires trust on the part of the reader that the proper steps
have been taken, all relevant information is produced and offered. That impression is helped by
the author avoiding any indication of bias or personal interest in the outcome of the data
analysis - he data analyst/author should give no impression of bias or subjectivity on the matter.
Thus, the 3rd person is the best approach rather than 1st person. Avoid exaggerated, emotional
or value laden terms. Avoid any reference to your feelings, views, values or desires.
Credibility is in part established by level of language – avoid colloquial, informal, conversational
terms or phrases. In general, do the work of finding the most precise terms – use a thesaurus
and dictionary.
Writing should be precise and to the point. All terms should be reviewed with the question –
“Is there a better way of saying that?” (use a thesaurus); “Is the right term to use?” (use a
dictionary).
References and phrases should be very common and general. Is this a very common manner of
expression most people would be familiar with? If in doubt, do some reading to get a sense, ask
a reviewer of your paper, or change the term/phrase to that which you are more sure is a
common, typical manner of expression.
All sentences should lead with the main point. Additional phrases, if needed, should follow the
main point.
Page 7 of 11, tmp9nb9lfs3.docx
Paraphrase This Document
Need a fresh take? Get an instant paraphrase of this document with our AI Paraphraser
Short, to the point, clearly inter-related sentences should be the default approach. Use long,
convoluted sentences with multiple phrases and commas only when you have a complex
thought to convey.
All paragraphs should lead with a sentence conveying the main point of the entire paragraph.
Each paragraph should have a clear, singular purpose.
Language
Language should be conservative. Do not make exaggerated, emotional or claims beyond that
which the data is conclusive. In science, you are never ‘proving’ anything, e.g., “the truth”. You
are providing data – evidence – that can be argued to support one point of view and discourage
another.
Good terms to use: Results are “consistent with” the hypothesis or view of X”; “does not
support Y”, “suggests that the hypothesis or view is unsupported”; “weak support”; “strongly
support”
Page 8 of 11, tmp9nb9lfs3.docx
1 Here in the first few sentences the reader should understand the purpose of the document – why
you are writing today, the objective – what they are going to get out of it. Further, from the first
few sentences, your thought regarding adapting style and level of explanation should be evident,
i.e., whether you are writing to high school students, scientists, college students or managers of a
retail shop.
Next, tell the reader briefly about what data you have available and what opportunity (and limits
thereof) that presents, i.e., how you are going to be able to help them make a decision or resolve a
debate about how to view or understand something. You should provide a brief introduction to
what data you have available, and what question you can address, and the scope of what you can
offer.
2 Finally for your introduction, preview your main points. What were your main observations at the
univariate, bivariate level? What were your main interpretations of these analyses? You might
want to preview your overall conclusion if it is a positive one, or wait until the conclusion to let the
reader know if it is one they might not like.
3 Goal: Find information about other situations and questions similar to the one at hand. Reflect on
how those situations can inform this one.
Research, general information about the topic providing context specific empirical/numeric
standards for evaluating numbers produced in this study. Find or use articles, reports associated
with your topic.
Summarize them here.
Discuss how they inform the business question at hand. Discuss how they provide some
information about how to evaluate numbers in this study, i.e., statistics. That means finding
specific measures, statistics relevant to this study that can stand as a benchmark, criterion for
interpreting and evaluating the numbers in the study in relation to the question at hand.
Decide specifically how you are going to use this information to evaluate the statistics in this study
– if the numbers are x, our decision will by A; if the numbers are y, our decision will be B, etc.
4 Discuss what the value of the data is to provide compelling, conclusive evidence for the question at
hand.
Show that you have examined the data in detail.
Show that you know and use proper, systematic, competent procedures and steps in careful,
neutral, objective data analysis.
How?
o Share that detail with the reader with summary statistics and distributions so they can
make judgements themselves.
o Make comments on the value of the data to make inferences about real world business
questions: Opportunities, limitations.
Be sure to think of, comment on and discuss any aspect of your data that would
lead a critic or person inclined to doubt your overall analysis.
Questions to ask and answer in this section:
When and how was it gathered? By whom? Do you have data from an entire population (universe), a
random sample, a convenience sample? Based on what kind of a sample that you have, what inference can
you make in the real world, and what inference can you not make about the real world? If you don’t have
population data, what is the approximate size of the population? If this information is not available, just say
⊘ This is a preview!⊘
Do you want full access?
Subscribe today to unlock all pages.
Trusted by 1+ million students worldwide
so, and note that is a limitation of your study. Recall instruction about the quality of data from best to worst
quality/reliability/validity: Full population, random sample, convenience sample
5 Tell the reader that you are going to give them an idea of what data you have and discuss the
opportunities and limitation of the data. This is what we in this class are calling ‘uni-variate’
analysis – basic summary statistics and charts providing information about the data on hand.
Run descriptive statistics for each of your variables. Numeric variables should include Mean,
median, standard deviation, minimum, maximum, range, count. Categorical variables should
include count and percentage.
Create attractive tables to display your data. If possible, put all descriptive statistics into one table.
6 Why are you showing it to the reader? What is the data? How should they interpret the chart?
Each table gets a label as “Figure 1” or “Figure 2”. All tables should have a meaningful title as well.
All table formatting should be done.
Example language for introducing a table or chart: “The following table (Figure 1) ....”
7 In general, as you talk about the descriptive statistics and the distribution of the variables, paint a
picture of the object those variables are measuring (e.g., the company a sample of gender and
salary is drawn from): Make comparisons, e.g., how does it compare to other companies? What do
you now know about this company that you didn’t before? What is this company not, i.e., what
type of company stands as a contrast. Good questions to ask and answer might be: The object is
larger/smaller than what? Think about the range of responses, the count overall and in nominal
variable categories (e.g., count of males vs. females), the proportions (percent of males vs.
females)? The range or proportion of responses tells you what? Compared to what? Give the
reader some idea of the object of study in comparison, using contrast, providing a context.
8 What implications for your analysis later on is implied by the descriptive statistics?
Mention anything the reader might notice and be concerned with. What seems odd? What might
lead to a perceived weakness of the data in making conclusions about the intended analysis done in
the next step? Take the role of a critic, a doubter, someone who might disagree with the outcome
of the data analysis to come. What doubts might they sew given the data described by the
univariate analysis (if any)?
9 Interpret the histogram – does it have any implications for your analysis? Does it tell you
something about the data on hand that the reader might notice? If not, simply say that the
distribution seems what might be expected, normal in your view or shows nothing that warrants
comment.
Is there a ‘skew’ – most data on the right or left? What kind of distribution is it? Is it close to a
normal or bell curve? Is it a U curve? What is the overall shape? What does that tell you about
your data.
Note implications of your univariate distribution that might lead to questions or doubts about you
bi-variate analysis later.
10 Remind the reader of the main findings (points) that are important for your overall interpretation.
Remind the reader of the opportunity and limitations of the data.
Remind the reader of the logical of your overall conclusion – how is the data tied to your
recommendation on what it means for a business decision.
Paraphrase This Document
Need a fresh take? Get an instant paraphrase of this document with our AI Paraphraser
Be very explicit in telling the reader what s/he should now think or do regarding the business
decision established in the introduction.
Optional: Suggest further research or information that might help inform the issue or make a
better decision.
decision established in the introduction.
Optional: Suggest further research or information that might help inform the issue or make a
better decision.
1 out of 11
Related Documents


Your All-in-One AI-Powered Toolkit for Academic Success.
+13062052269
info@desklib.com
Available 24*7 on WhatsApp / Email
![[object Object]](/_next/static/media/star-bottom.7253800d.svg)
Unlock your academic potential
Copyright © 2020–2026 A2Z Services. All Rights Reserved. Developed and managed by ZUCOL.