Comprehensive Business Data Analysis and Interpretation Project
VerifiedAdded on 2023/06/15
|13
|2280
|296
Practical Assignment
AI Summary
This assignment provides a comprehensive analysis and interpretation of business data, utilizing statistical methods and Excel for calculations. It includes tasks such as finding the sum and variance, interpreting mean and standard deviation, constructing frequency tables, and differentiating between cross-sectional and time series data. The project involves creating a network diagram to identify the critical path and duration, constructing a correlation matrix to assess relationships between variables like quarterly sales and total costs, and applying the high-low method to estimate variable costs and break-even points. Furthermore, the assignment includes reflective learning on the skills developed and challenges faced during the project, offering insights into financial authority and problem-solving in data analysis. The student's work demonstrates a practical understanding of data analysis techniques and their application in making informed business decisions. Desklib offers a range of similar solved assignments and study tools to aid students in their academic pursuits.

Coursework 1
Paraphrase This Document
Need a fresh take? Get an instant paraphrase of this document with our AI Paraphraser
Contents
PART 1...................................................................................................................................................5
TASK 1....................................................................................................................................................5
(a) Find the sum and variance in excel...............................................................................................5
(b) Interpret and analyze mean and standard deviation...................................................................5
TASK 2....................................................................................................................................................5
(a) Construct the three tables in excel and paste it here by calculate the value given......................5
(b) Why there is a difference in the mean and standard deviation of grouped and ungrouped data
and which one is more accurate?......................................................................................................6
(c) Give a comment on the minimum amount of the consumer needs estimated to spend on the
top 25% of the expenditure...............................................................................................................7
TASK 3....................................................................................................................................................7
Give the difference between the cross – sectional data and time series data with reference to the
examples considering the demographic profile and lifestyle nature of the consumers....................7
TASK 4....................................................................................................................................................8
(a) Draw a network diagram which shows the movement of forwards and backward passes..........8
(b) Identify the critical path and duration of the project...................................................................9
(c) Distinguish between critical and non – critical activities............................................................10
TASK 5..................................................................................................................................................10
(a) Construct a correlation matrix and calculate the coefficients between quarterly sales and total
cost and average order value and gross profit................................................................................10
(b) Identify the best predictor of the quarterly sales, explain the reason.......................................10
(c) Draw a scatter graph and show a trend line of the regression equation....................................11
(d) Interpret the coefficient of correlation and determination........................................................11
(e) State the equation of regression and interpret the value of intercepts.....................................11
TASK 6..................................................................................................................................................12
1. Calculate the coefficients of variation for business A and B........................................................12
2. By assuming that the risk of retailer is negative, which project should be chosen?....................12
TASK 7..................................................................................................................................................12
Give a reflective learning through the project.................................................................................12
PART 2.................................................................................................................................................12
1. Estimate the variable cost through high – low method...............................................................12
2. Calculate the monthly fixed cost.................................................................................................13
3. Calculate break even of January 2021.........................................................................................13
4. How many t-shirts should be sold to achieve the target profit in January 2021..........................13
5. Calculate margin of safety...........................................................................................................13

6. Interpret the above calculations..................................................................................................13
REFERENCES........................................................................................................................................14
REFERENCES........................................................................................................................................14
⊘ This is a preview!⊘
Do you want full access?
Subscribe today to unlock all pages.
Trusted by 1+ million students worldwide
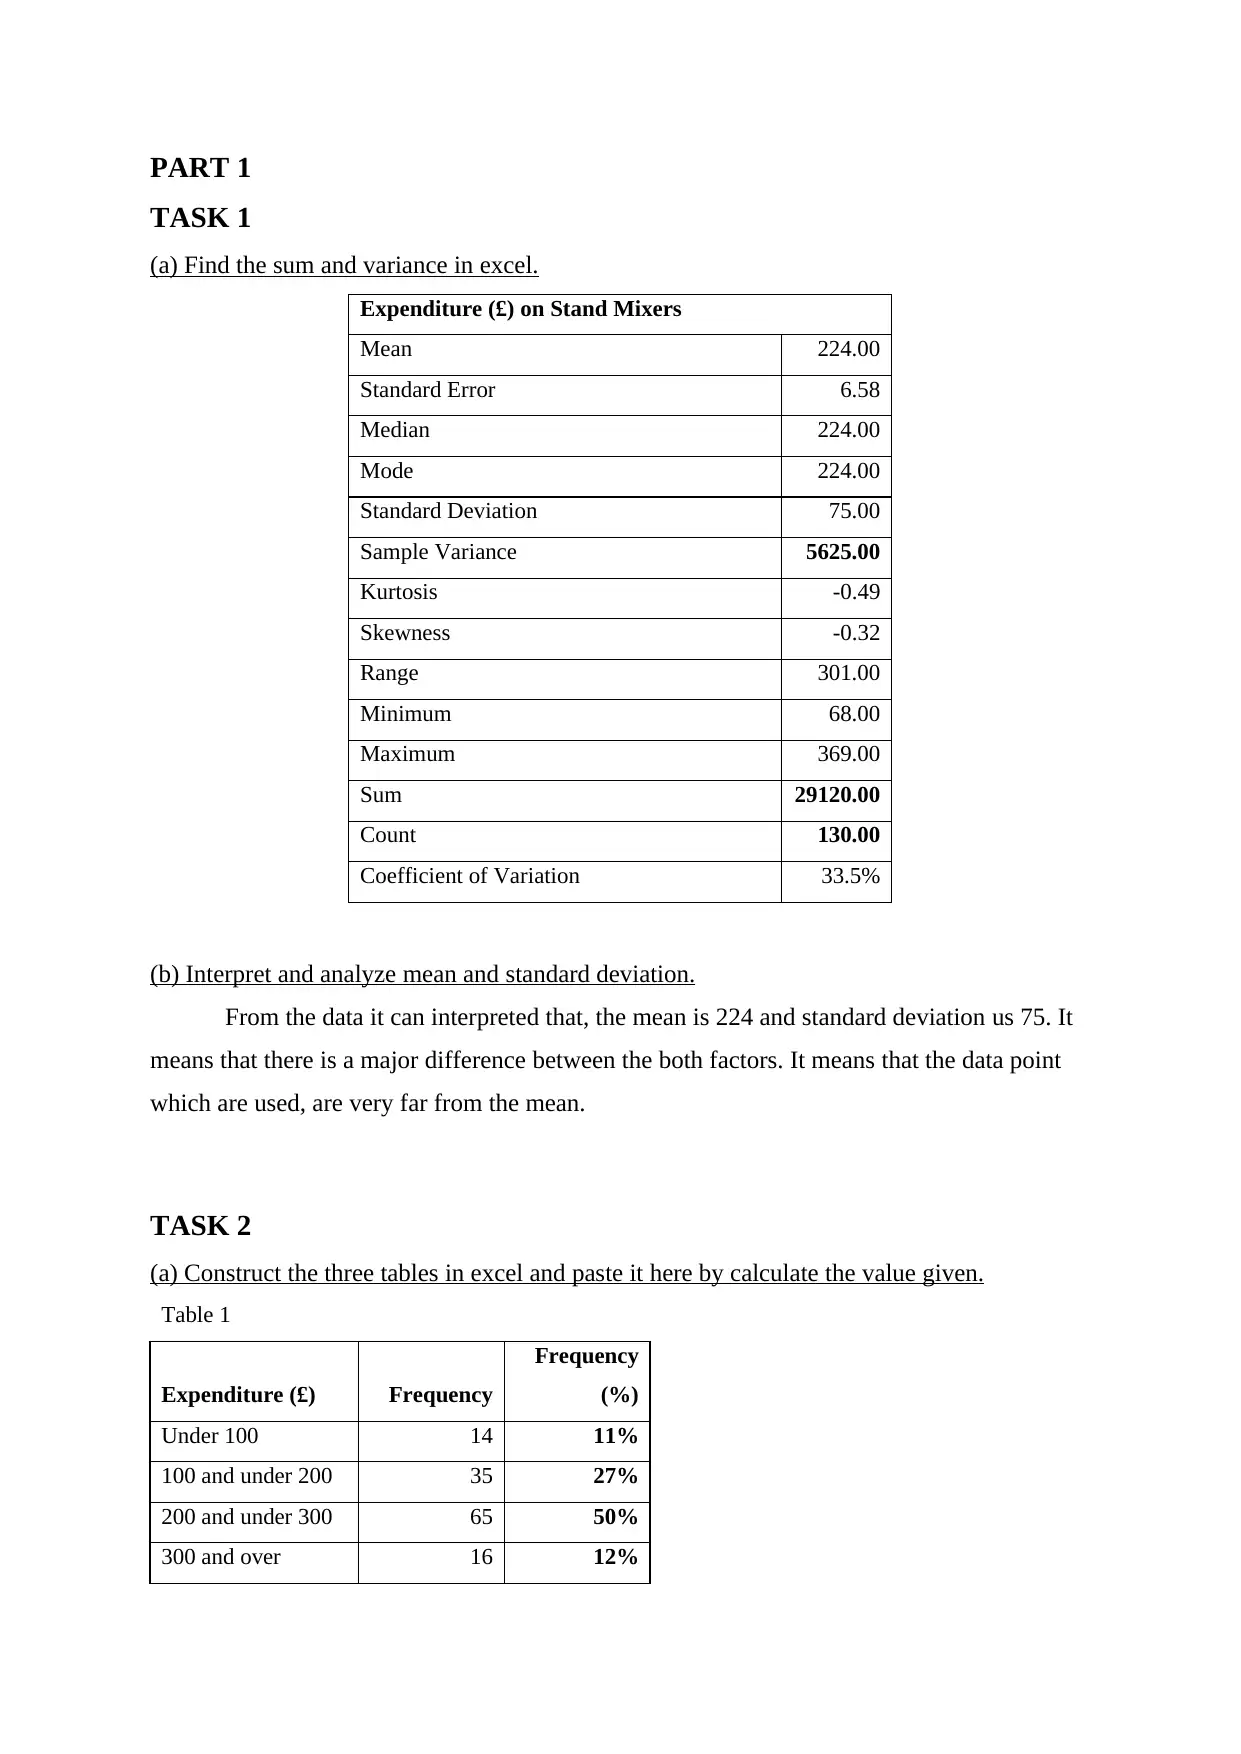
PART 1
TASK 1
(a) Find the sum and variance in excel.
Expenditure (£) on Stand Mixers
Mean 224.00
Standard Error 6.58
Median 224.00
Mode 224.00
Standard Deviation 75.00
Sample Variance 5625.00
Kurtosis -0.49
Skewness -0.32
Range 301.00
Minimum 68.00
Maximum 369.00
Sum 29120.00
Count 130.00
Coefficient of Variation 33.5%
(b) Interpret and analyze mean and standard deviation.
From the data it can interpreted that, the mean is 224 and standard deviation us 75. It
means that there is a major difference between the both factors. It means that the data point
which are used, are very far from the mean.
TASK 2
(a) Construct the three tables in excel and paste it here by calculate the value given.
Table 1
Expenditure (£) Frequency
Frequency
(%)
Under 100 14 11%
100 and under 200 35 27%
200 and under 300 65 50%
300 and over 16 12%
Paraphrase This Document
Need a fresh take? Get an instant paraphrase of this document with our AI Paraphraser
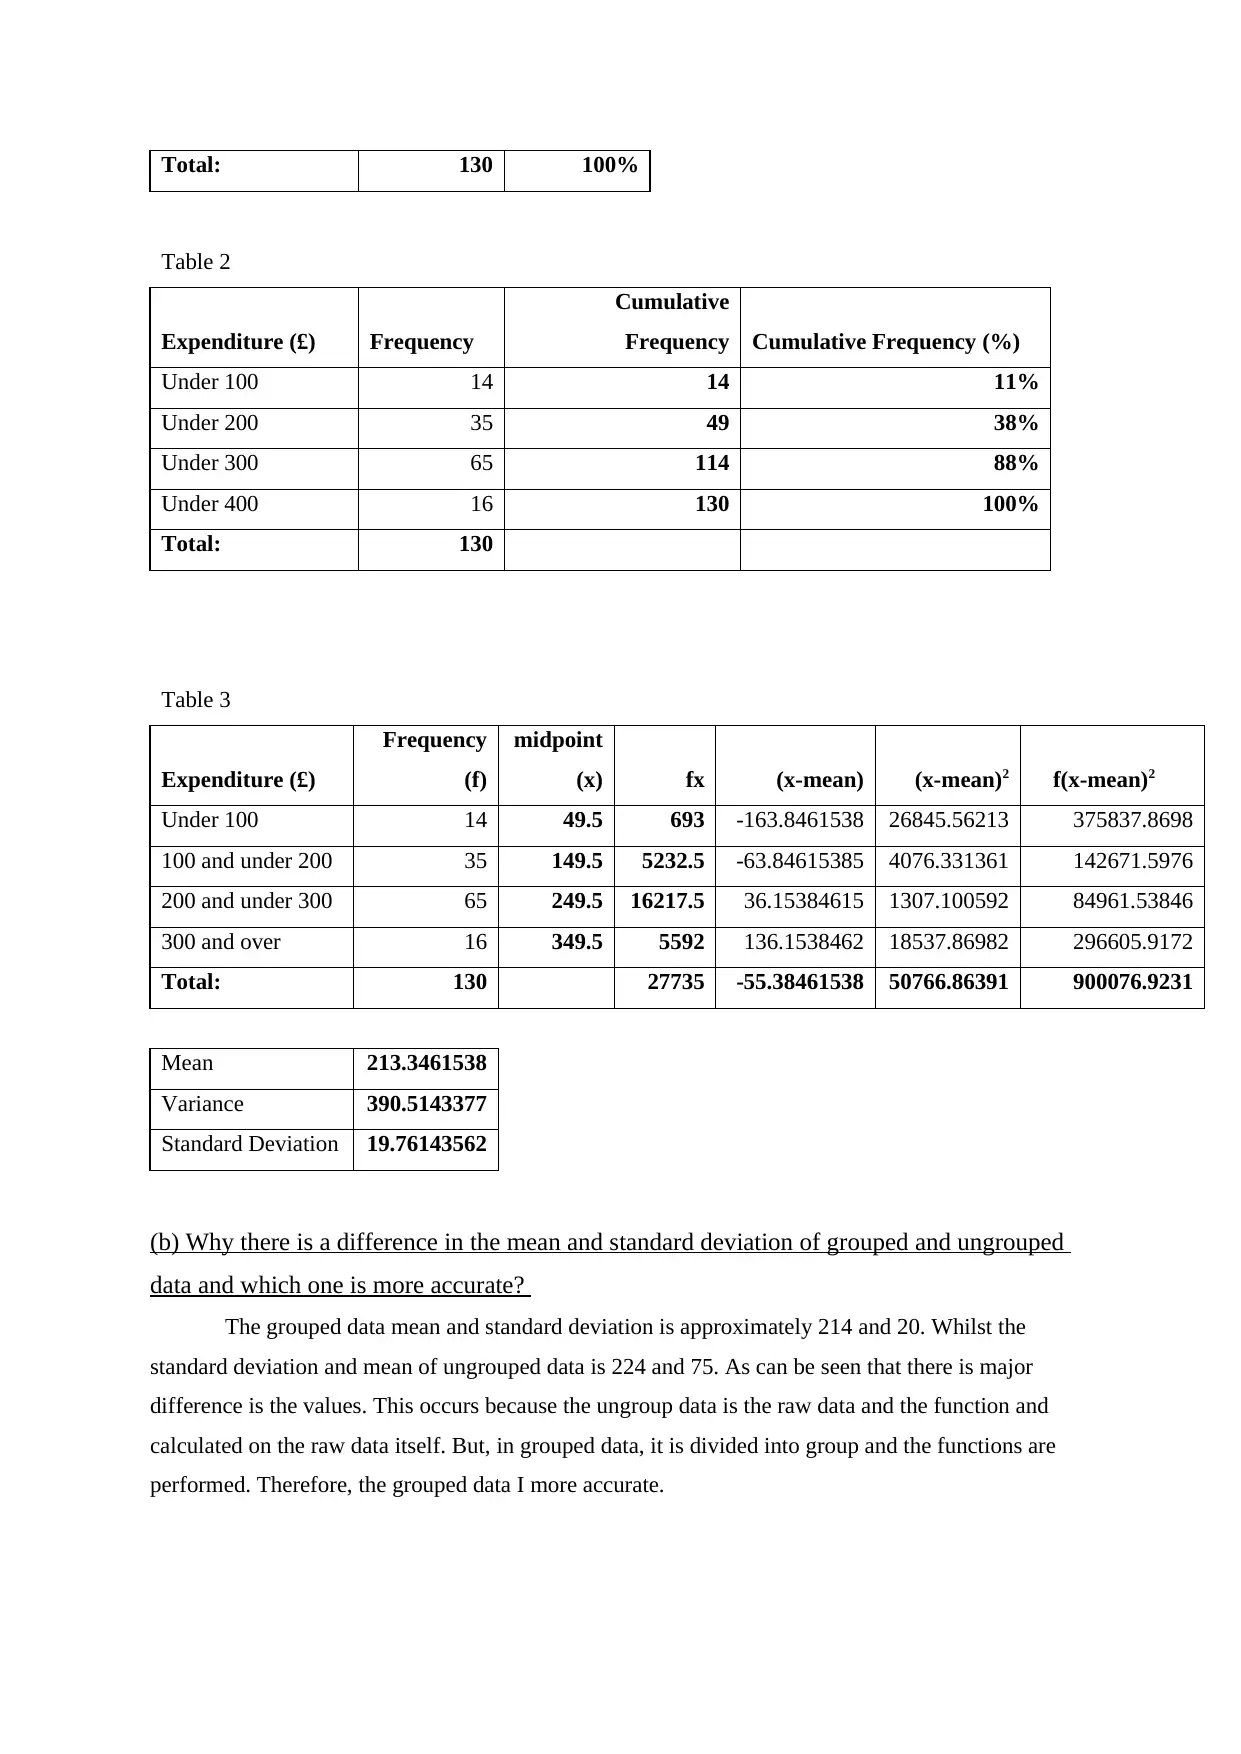
Total: 130 100%
Table 2
Expenditure (£) Frequency
Cumulative
Frequency Cumulative Frequency (%)
Under 100 14 14 11%
Under 200 35 49 38%
Under 300 65 114 88%
Under 400 16 130 100%
Total: 130
Table 3
Expenditure (£)
Frequency
(f)
midpoint
(x) fx (x-mean) (x-mean)2 f(x-mean)2
Under 100 14 49.5 693 -163.8461538 26845.56213 375837.8698
100 and under 200 35 149.5 5232.5 -63.84615385 4076.331361 142671.5976
200 and under 300 65 249.5 16217.5 36.15384615 1307.100592 84961.53846
300 and over 16 349.5 5592 136.1538462 18537.86982 296605.9172
Total: 130 27735 -55.38461538 50766.86391 900076.9231
Mean 213.3461538
Variance 390.5143377
Standard Deviation 19.76143562
(b) Why there is a difference in the mean and standard deviation of grouped and ungrouped
data and which one is more accurate?
The grouped data mean and standard deviation is approximately 214 and 20. Whilst the
standard deviation and mean of ungrouped data is 224 and 75. As can be seen that there is major
difference is the values. This occurs because the ungroup data is the raw data and the function and
calculated on the raw data itself. But, in grouped data, it is divided into group and the functions are
performed. Therefore, the grouped data I more accurate.
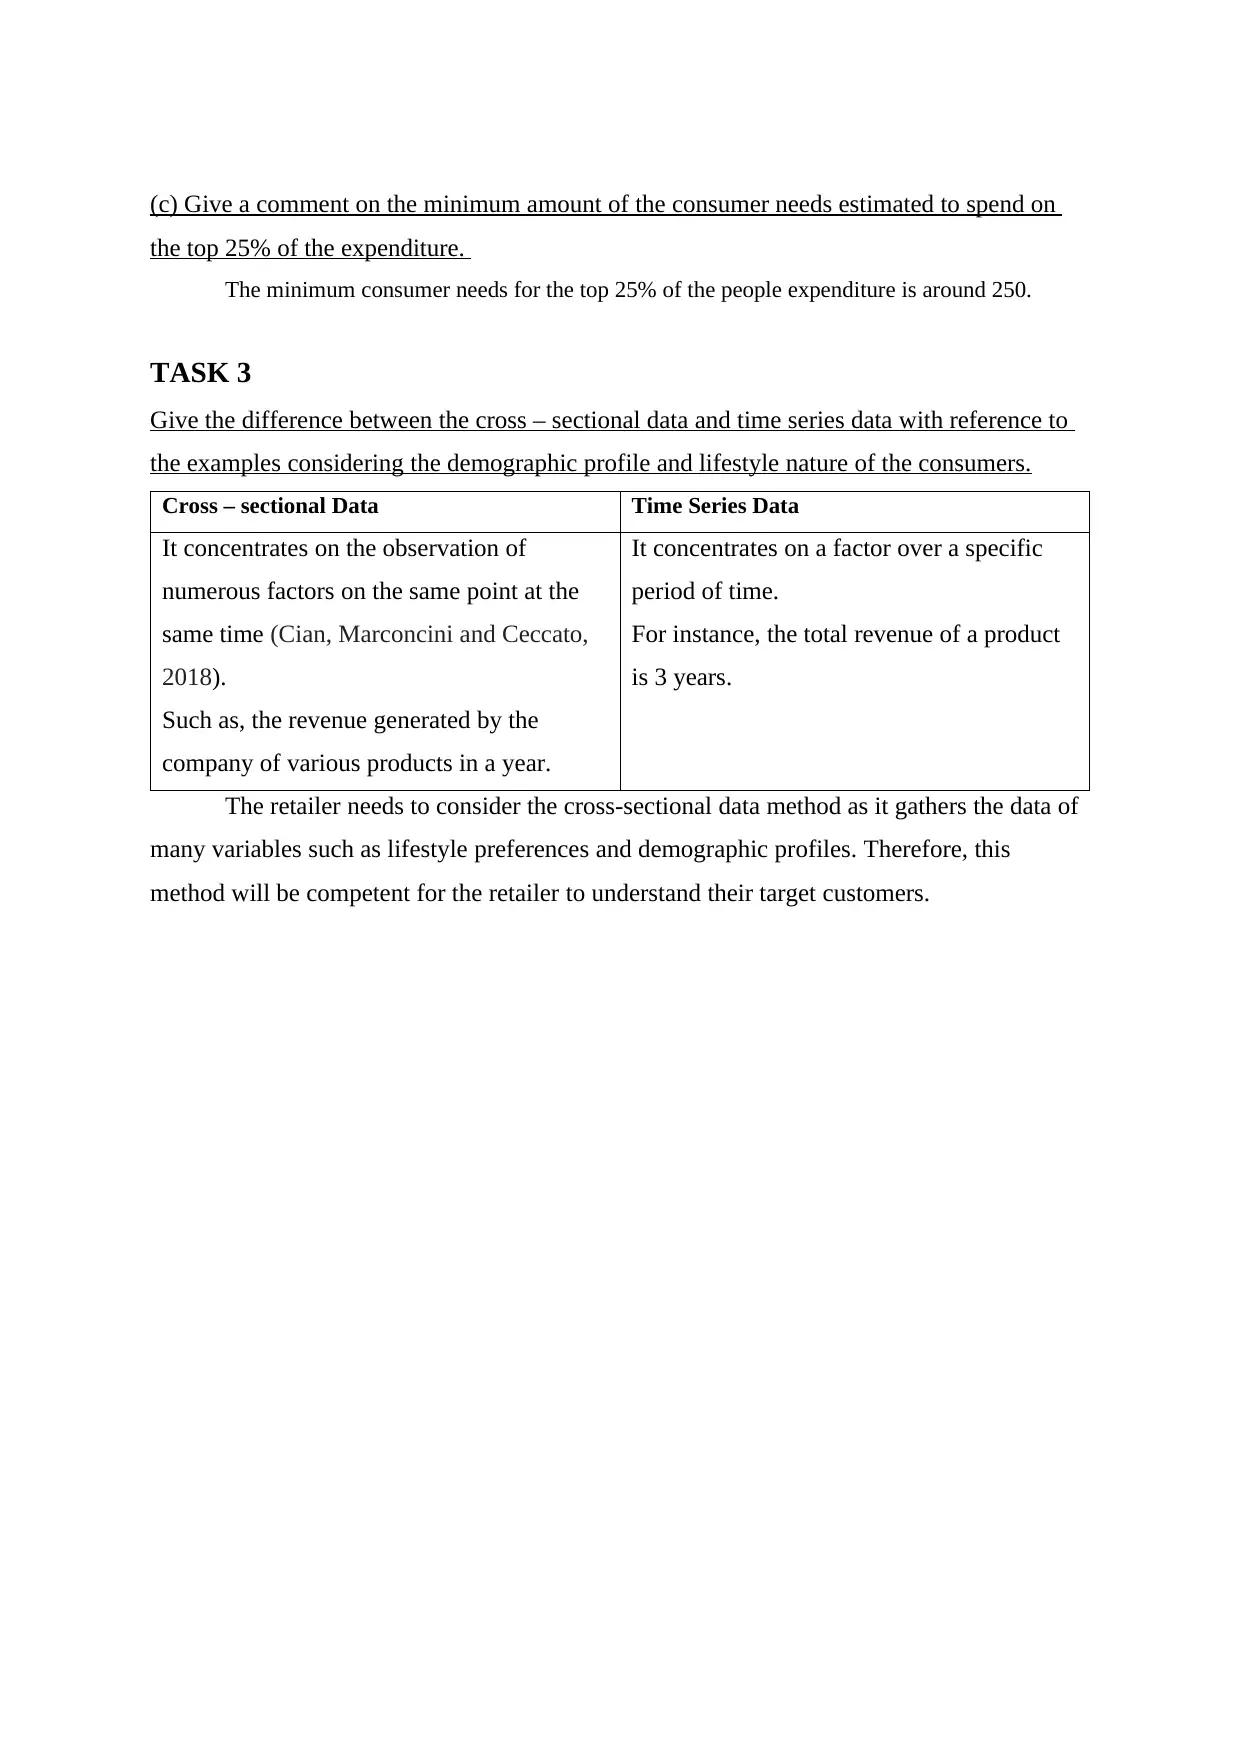
(c) Give a comment on the minimum amount of the consumer needs estimated to spend on
the top 25% of the expenditure.
The minimum consumer needs for the top 25% of the people expenditure is around 250.
TASK 3
Give the difference between the cross – sectional data and time series data with reference to
the examples considering the demographic profile and lifestyle nature of the consumers.
Cross – sectional Data Time Series Data
It concentrates on the observation of
numerous factors on the same point at the
same time (Cian, Marconcini and Ceccato,
2018).
Such as, the revenue generated by the
company of various products in a year.
It concentrates on a factor over a specific
period of time.
For instance, the total revenue of a product
is 3 years.
The retailer needs to consider the cross-sectional data method as it gathers the data of
many variables such as lifestyle preferences and demographic profiles. Therefore, this
method will be competent for the retailer to understand their target customers.
⊘ This is a preview!⊘
Do you want full access?
Subscribe today to unlock all pages.
Trusted by 1+ million students worldwide
TASK 4
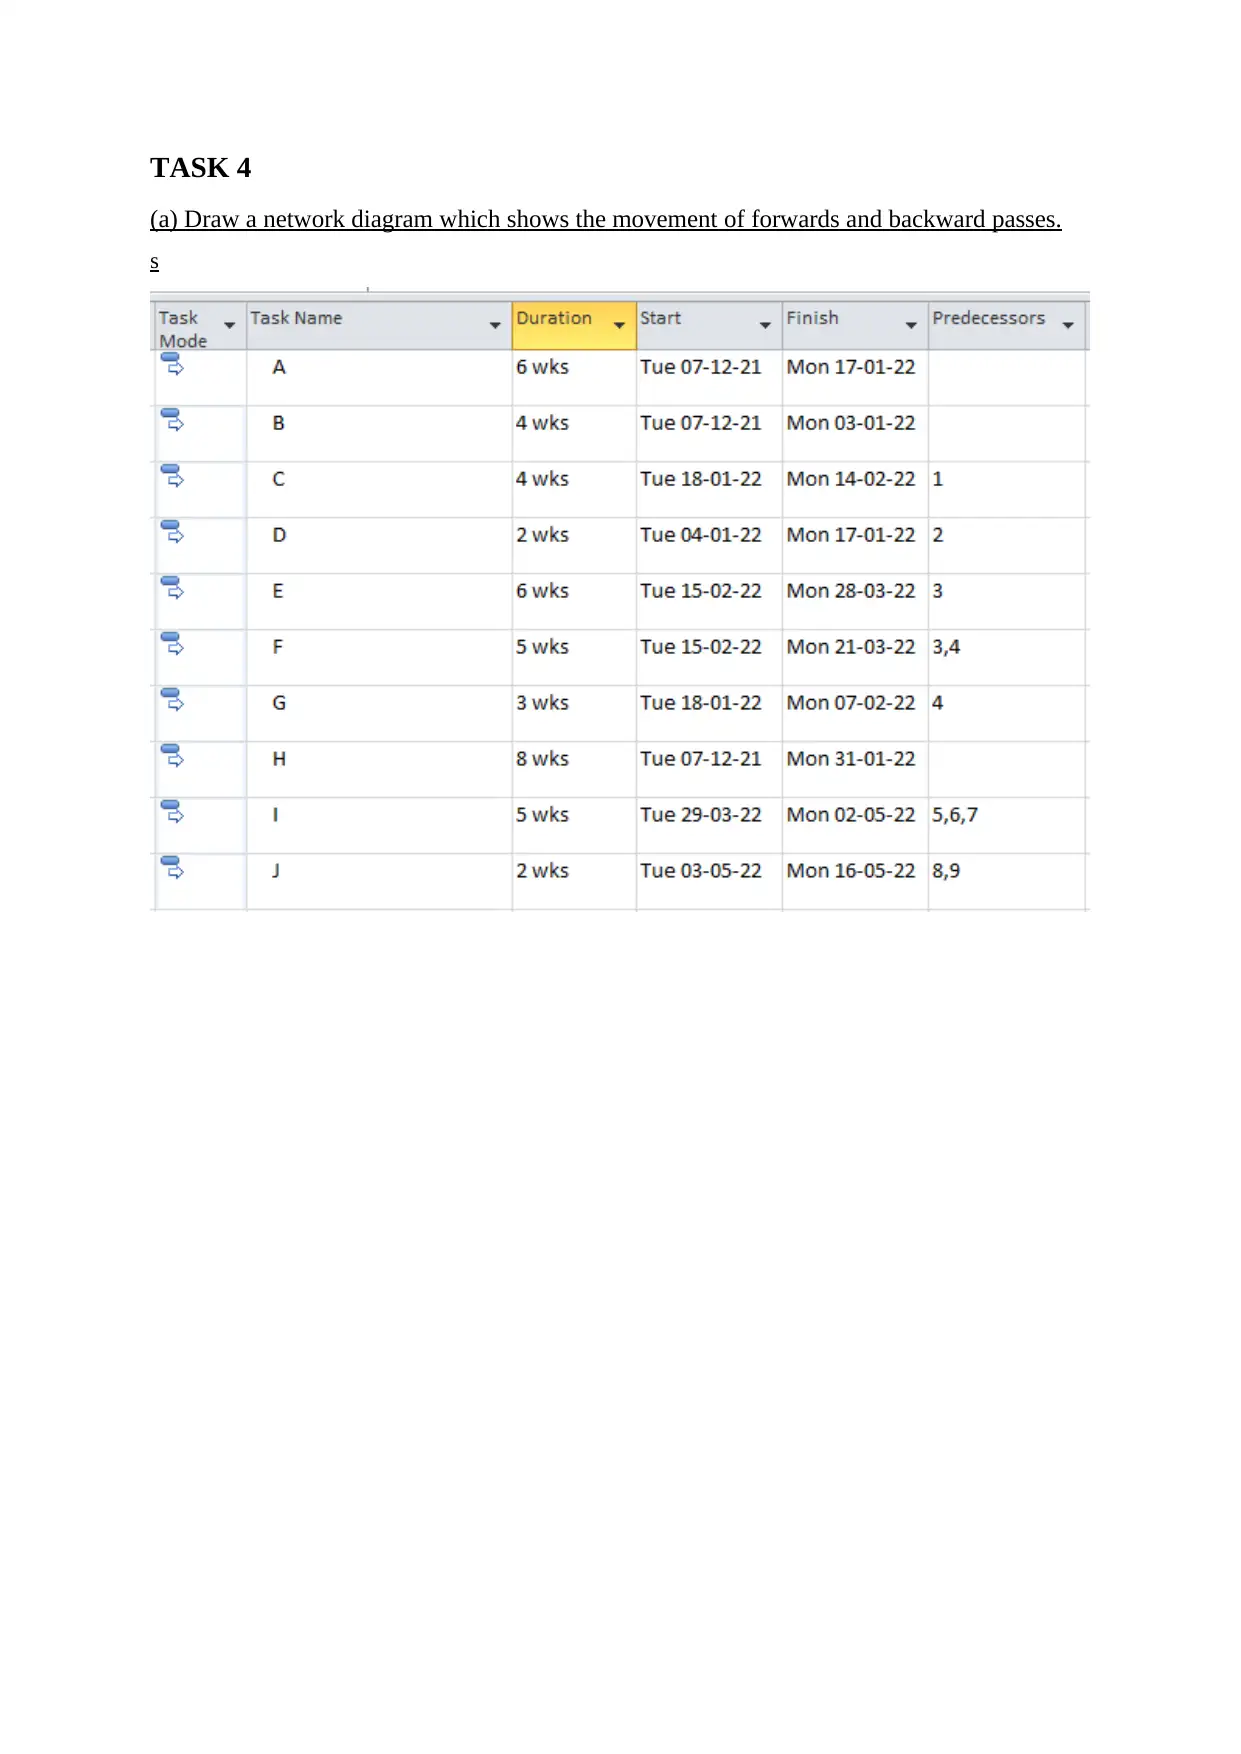
(a) Draw a network diagram which shows the movement of forwards and backward passes.
s
(a) Draw a network diagram which shows the movement of forwards and backward passes.
s
Paraphrase This Document
Need a fresh take? Get an instant paraphrase of this document with our AI Paraphraser
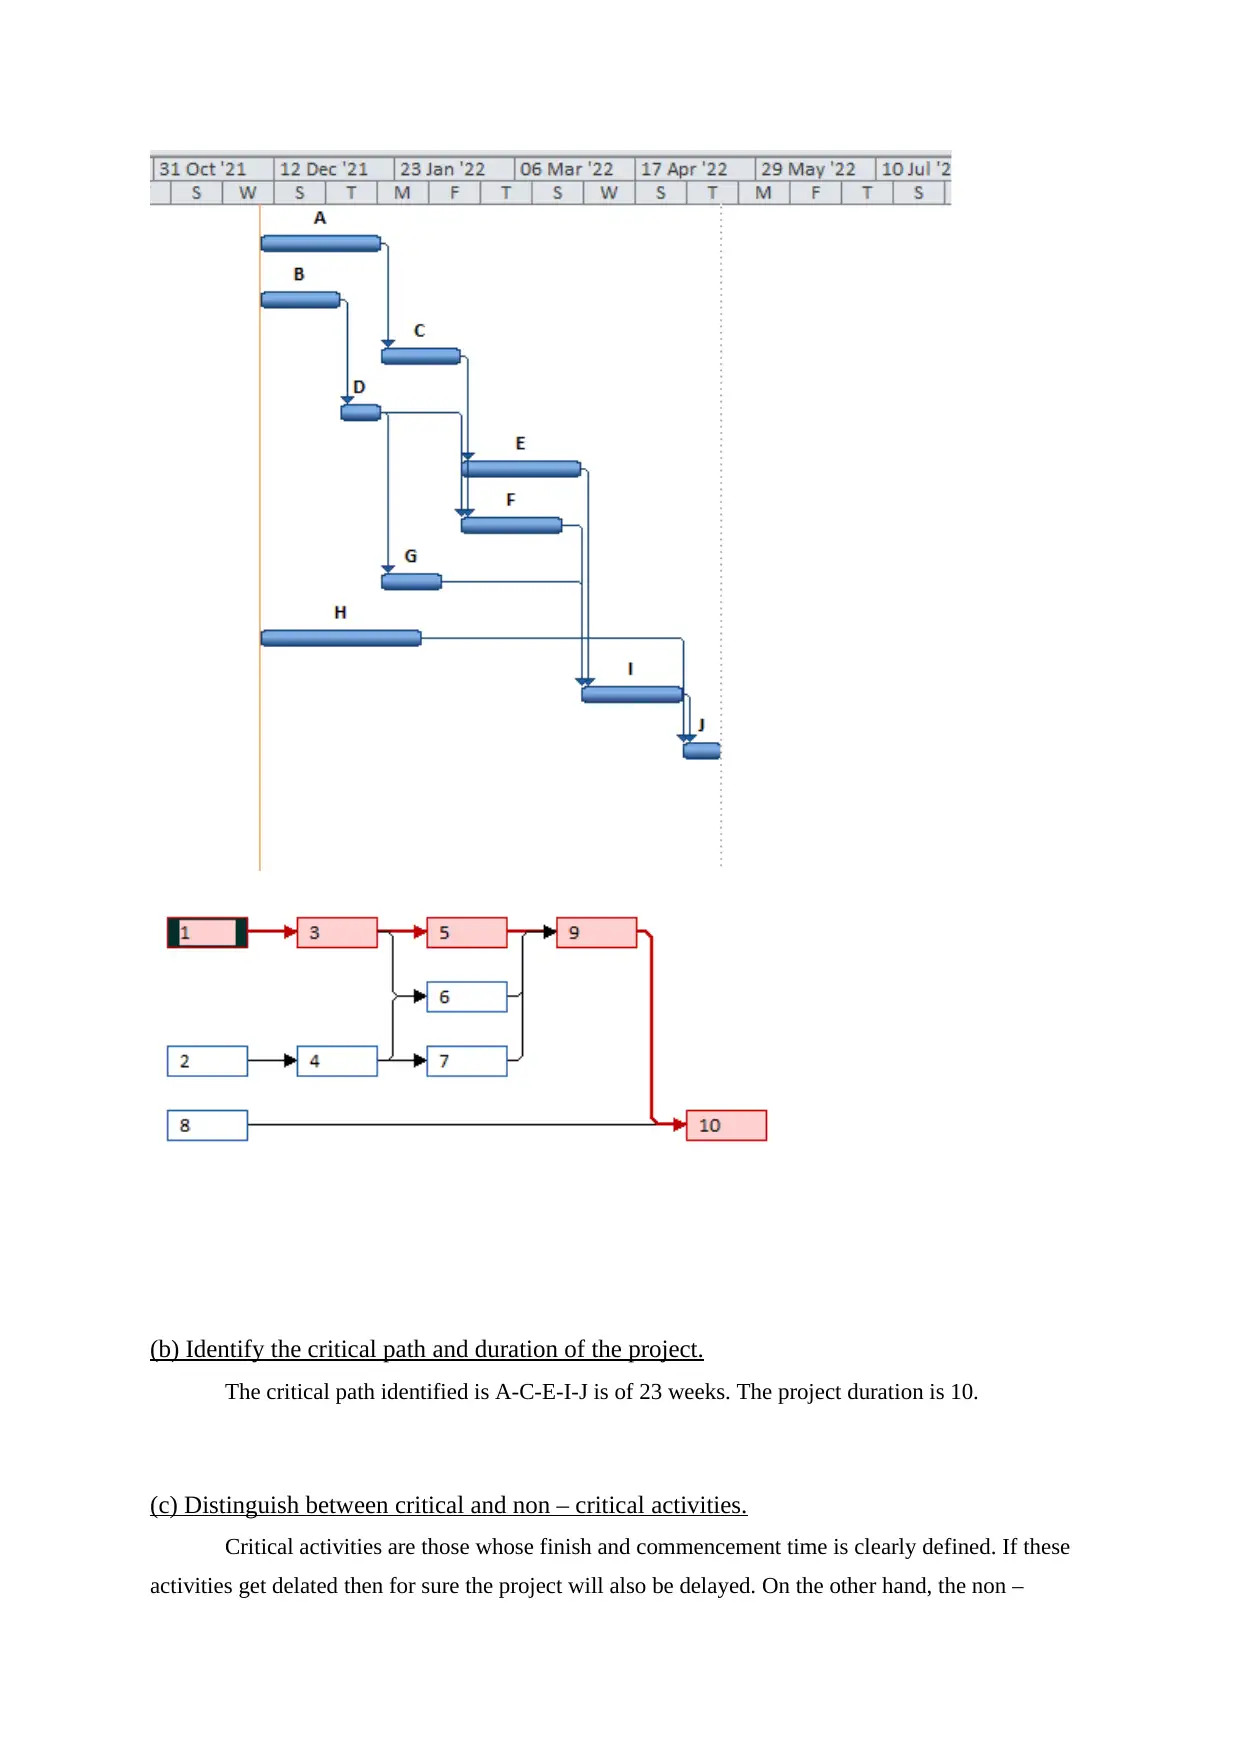
(b) Identify the critical path and duration of the project.
The critical path identified is A-C-E-I-J is of 23 weeks. The project duration is 10.
(c) Distinguish between critical and non – critical activities.
Critical activities are those whose finish and commencement time is clearly defined. If these
activities get delated then for sure the project will also be delayed. On the other hand, the non –
critical activities determine the path which do not have any restriction on the time and can work
freely.
TASK 5
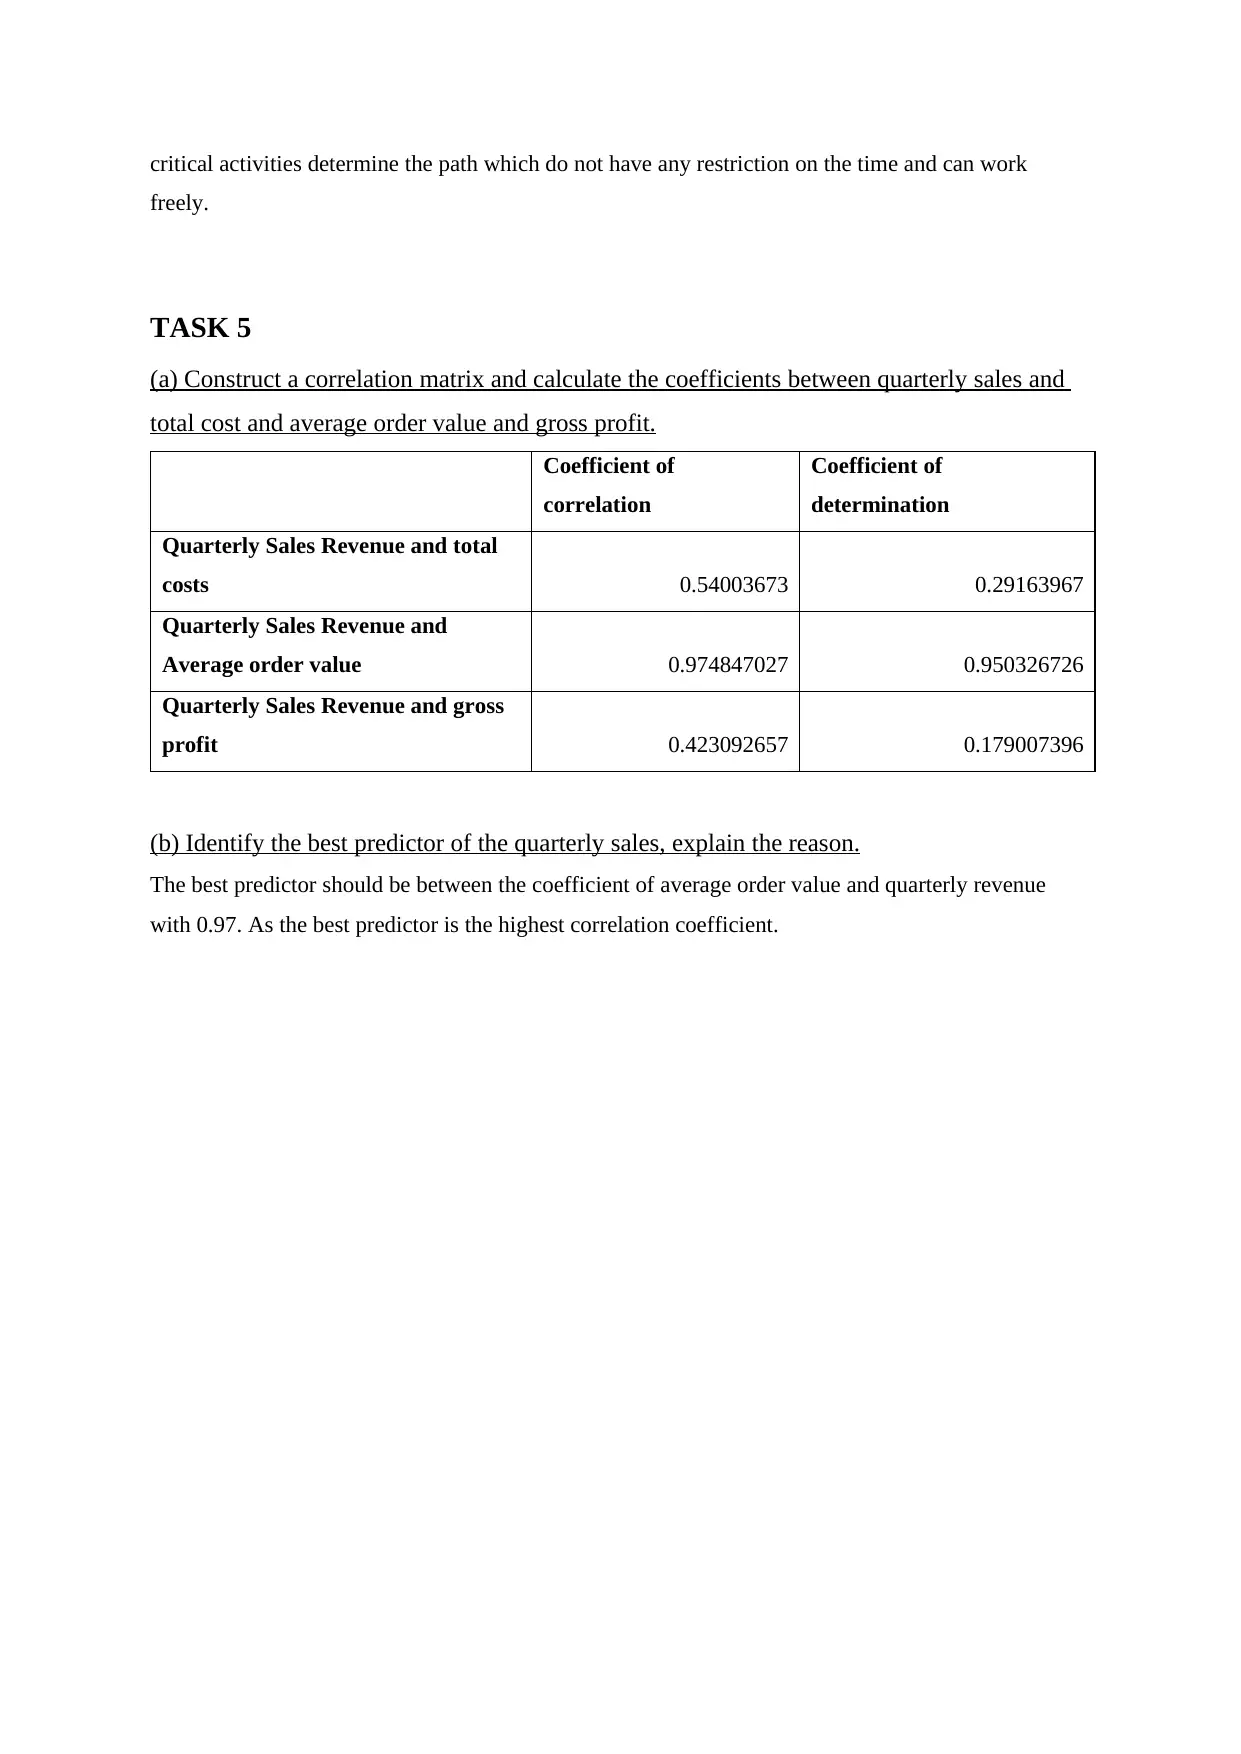
(a) Construct a correlation matrix and calculate the coefficients between quarterly sales and
total cost and average order value and gross profit.
Coefficient of
correlation
Coefficient of
determination
Quarterly Sales Revenue and total
costs 0.54003673 0.29163967
Quarterly Sales Revenue and
Average order value 0.974847027 0.950326726
Quarterly Sales Revenue and gross
profit 0.423092657 0.179007396
(b) Identify the best predictor of the quarterly sales, explain the reason.
The best predictor should be between the coefficient of average order value and quarterly revenue
with 0.97. As the best predictor is the highest correlation coefficient.
freely.
TASK 5
(a) Construct a correlation matrix and calculate the coefficients between quarterly sales and
total cost and average order value and gross profit.
Coefficient of
correlation
Coefficient of
determination
Quarterly Sales Revenue and total
costs 0.54003673 0.29163967
Quarterly Sales Revenue and
Average order value 0.974847027 0.950326726
Quarterly Sales Revenue and gross
profit 0.423092657 0.179007396
(b) Identify the best predictor of the quarterly sales, explain the reason.
The best predictor should be between the coefficient of average order value and quarterly revenue
with 0.97. As the best predictor is the highest correlation coefficient.
⊘ This is a preview!⊘
Do you want full access?
Subscribe today to unlock all pages.
Trusted by 1+ million students worldwide
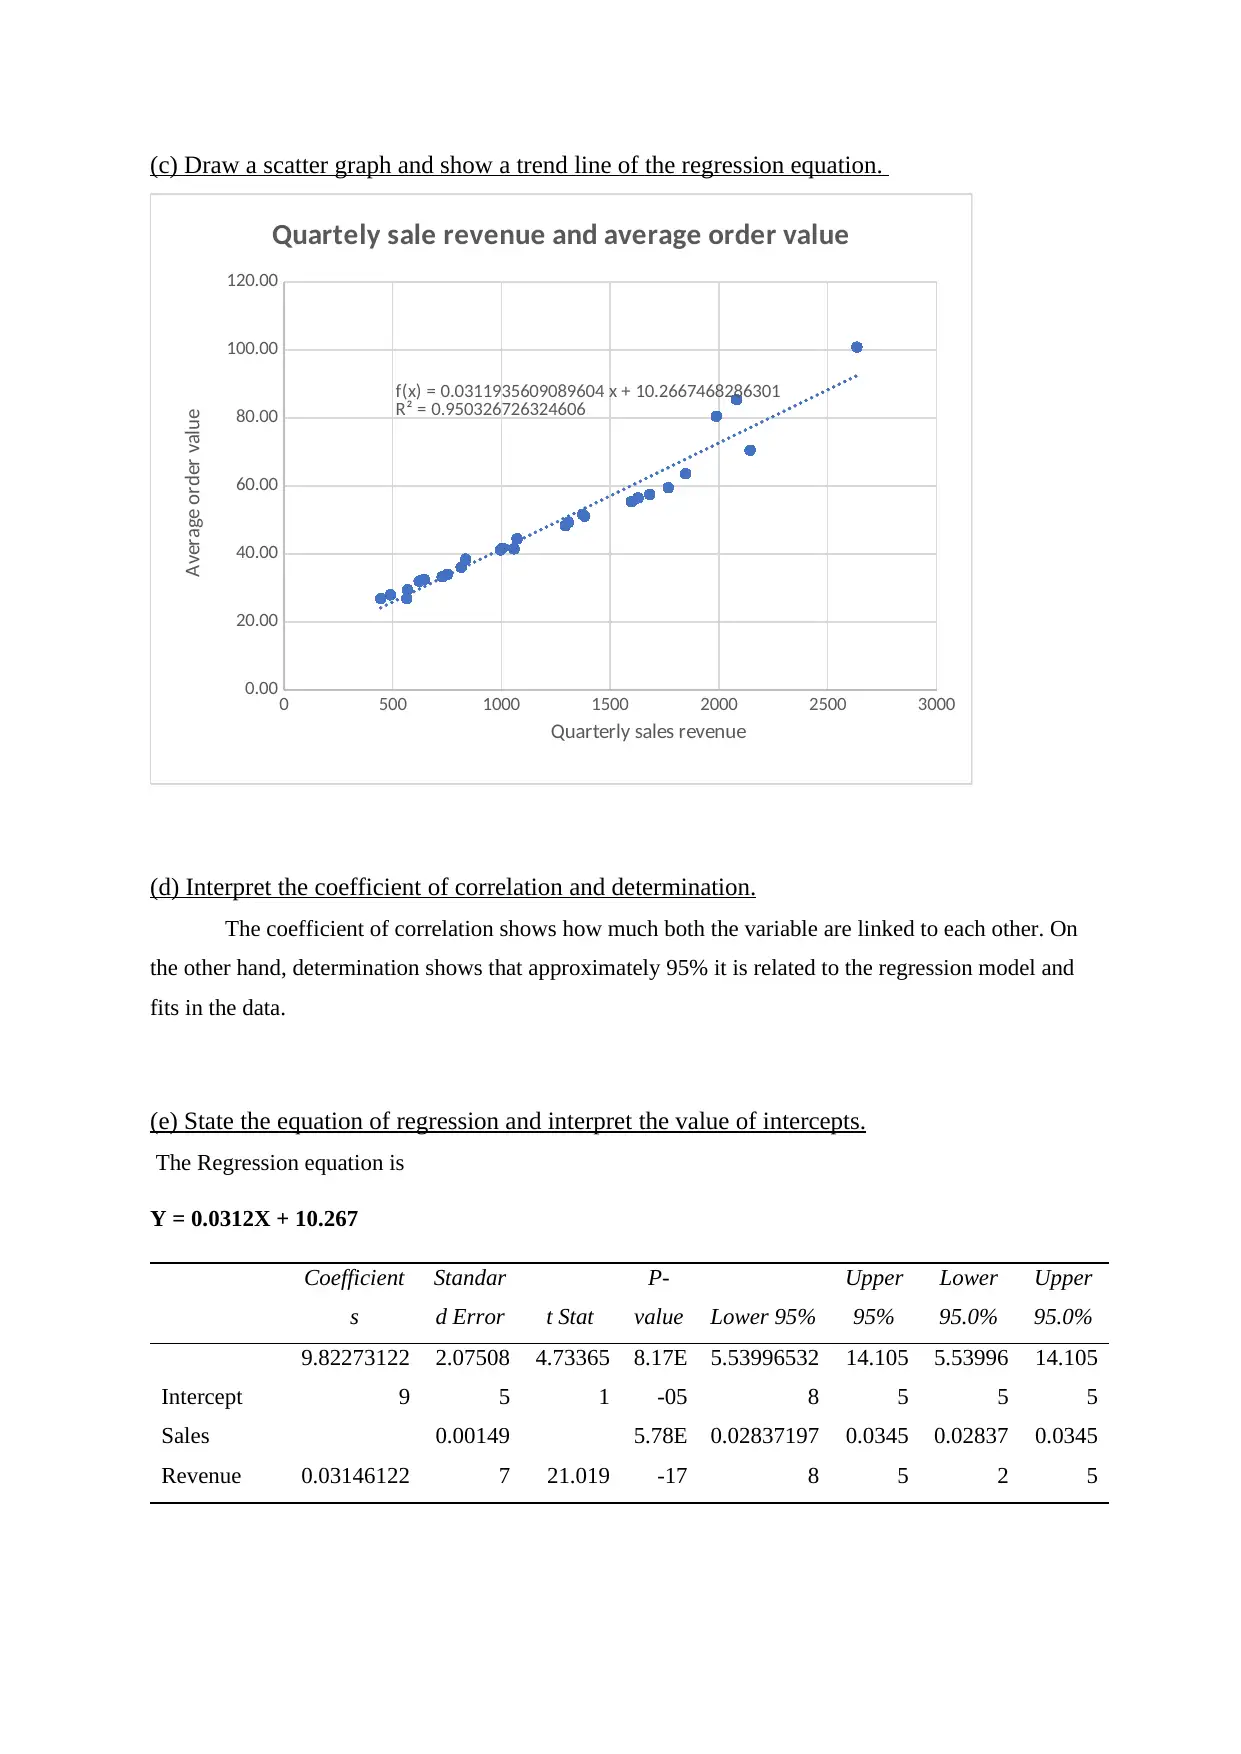
(c) Draw a scatter graph and show a trend line of the regression equation.
0 500 1000 1500 2000 2500 3000
0.00
20.00
40.00
60.00
80.00
100.00
120.00
f(x) = 0.0311935609089604 x + 10.2667468286301
R² = 0.950326726324606
Quartely sale revenue and average order value
Quarterly sales revenue
Average order value
(d) Interpret the coefficient of correlation and determination.
The coefficient of correlation shows how much both the variable are linked to each other. On
the other hand, determination shows that approximately 95% it is related to the regression model and
fits in the data.
(e) State the equation of regression and interpret the value of intercepts.
The Regression equation is
Y = 0.0312X + 10.267
Coefficient
s
Standar
d Error t Stat
P-
value Lower 95%
Upper
95%
Lower
95.0%
Upper
95.0%
Intercept
9.82273122
9
2.07508
5
4.73365
1
8.17E
-05
5.53996532
8
14.105
5
5.53996
5
14.105
5
Sales
Revenue 0.03146122
0.00149
7 21.019
5.78E
-17
0.02837197
8
0.0345
5
0.02837
2
0.0345
5
Paraphrase This Document
Need a fresh take? Get an instant paraphrase of this document with our AI Paraphraser
TASK 6
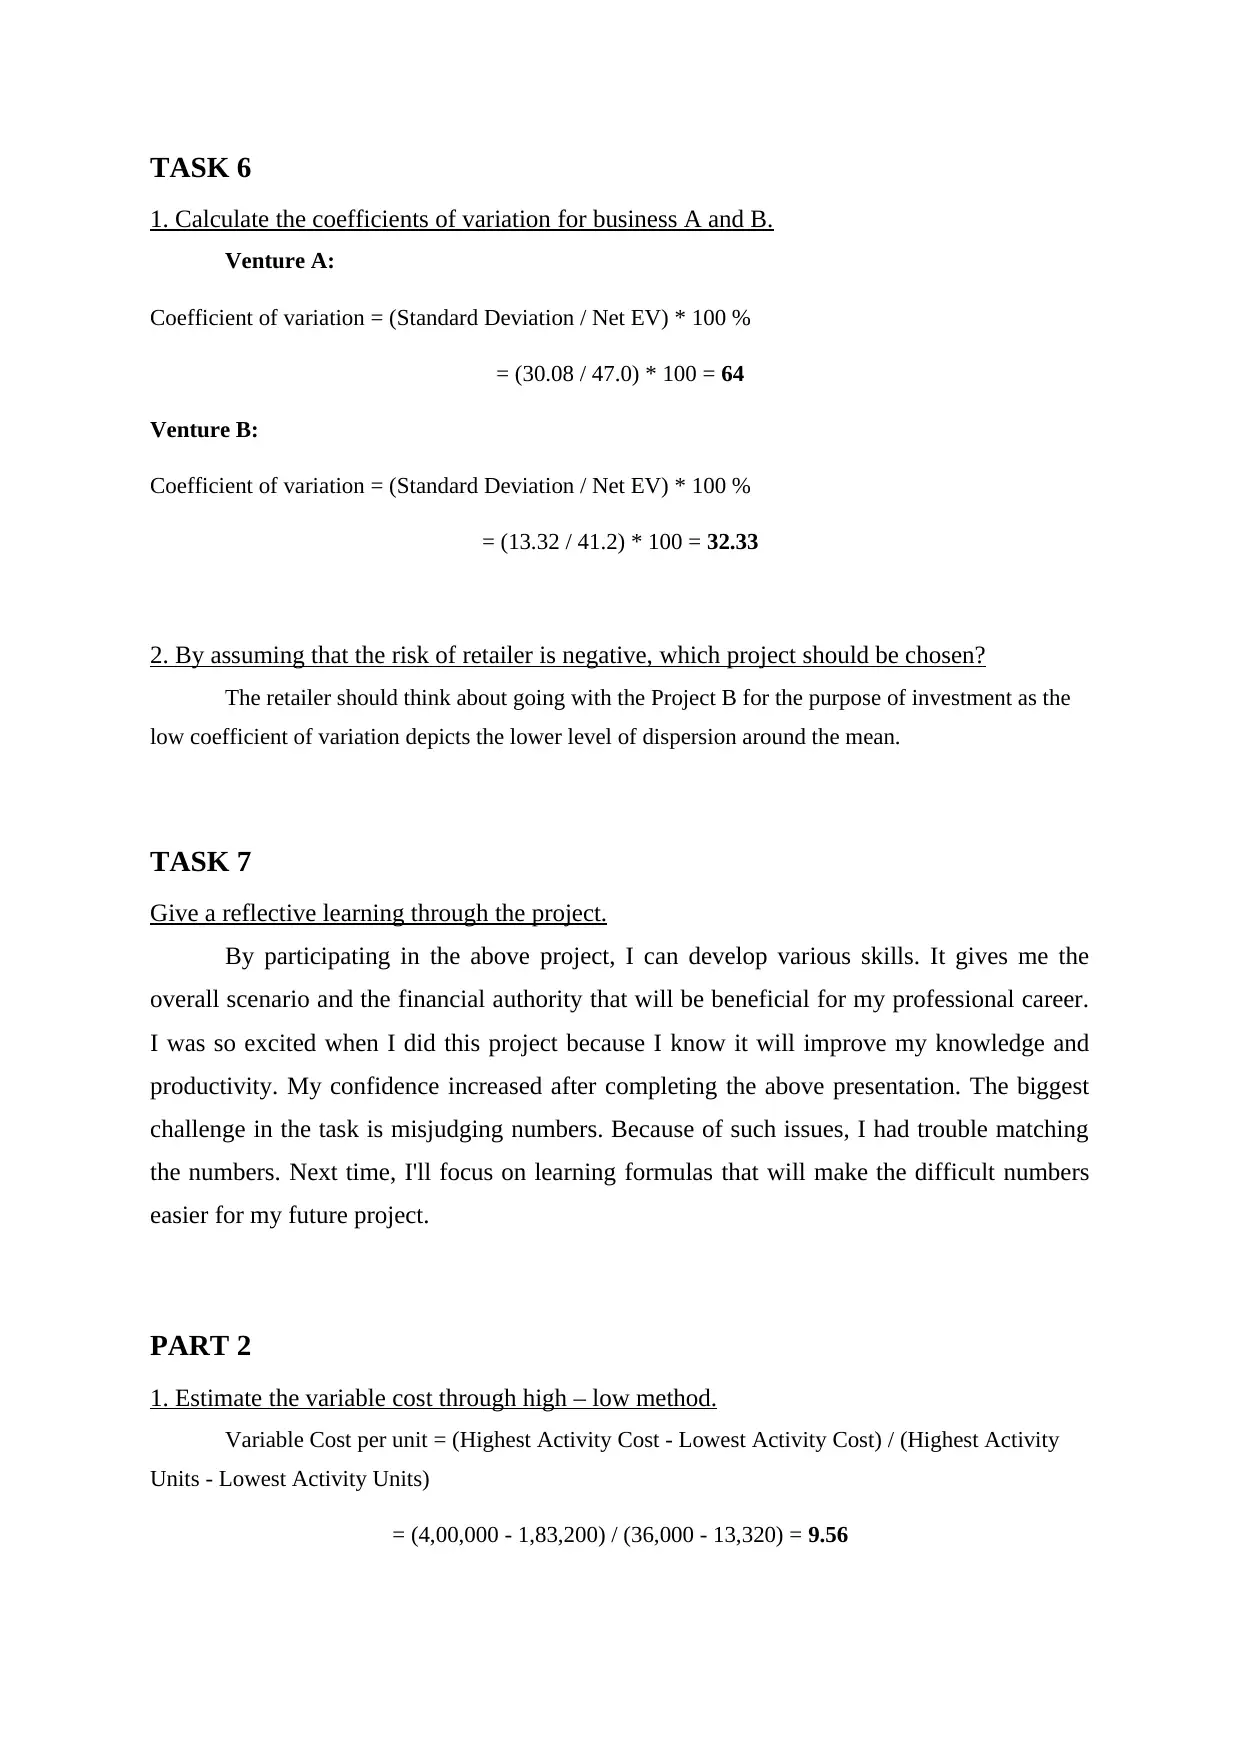
1. Calculate the coefficients of variation for business A and B.
Venture A:
Coefficient of variation = (Standard Deviation / Net EV) * 100 %
= (30.08 / 47.0) * 100 = 64
Venture B:
Coefficient of variation = (Standard Deviation / Net EV) * 100 %
= (13.32 / 41.2) * 100 = 32.33
2. By assuming that the risk of retailer is negative, which project should be chosen?
The retailer should think about going with the Project B for the purpose of investment as the
low coefficient of variation depicts the lower level of dispersion around the mean.
TASK 7
Give a reflective learning through the project.
By participating in the above project, I can develop various skills. It gives me the
overall scenario and the financial authority that will be beneficial for my professional career.
I was so excited when I did this project because I know it will improve my knowledge and
productivity. My confidence increased after completing the above presentation. The biggest
challenge in the task is misjudging numbers. Because of such issues, I had trouble matching
the numbers. Next time, I'll focus on learning formulas that will make the difficult numbers
easier for my future project.
PART 2
1. Estimate the variable cost through high – low method.
Variable Cost per unit = (Highest Activity Cost - Lowest Activity Cost) / (Highest Activity
Units - Lowest Activity Units)
= (4,00,000 - 1,83,200) / (36,000 - 13,320) = 9.56
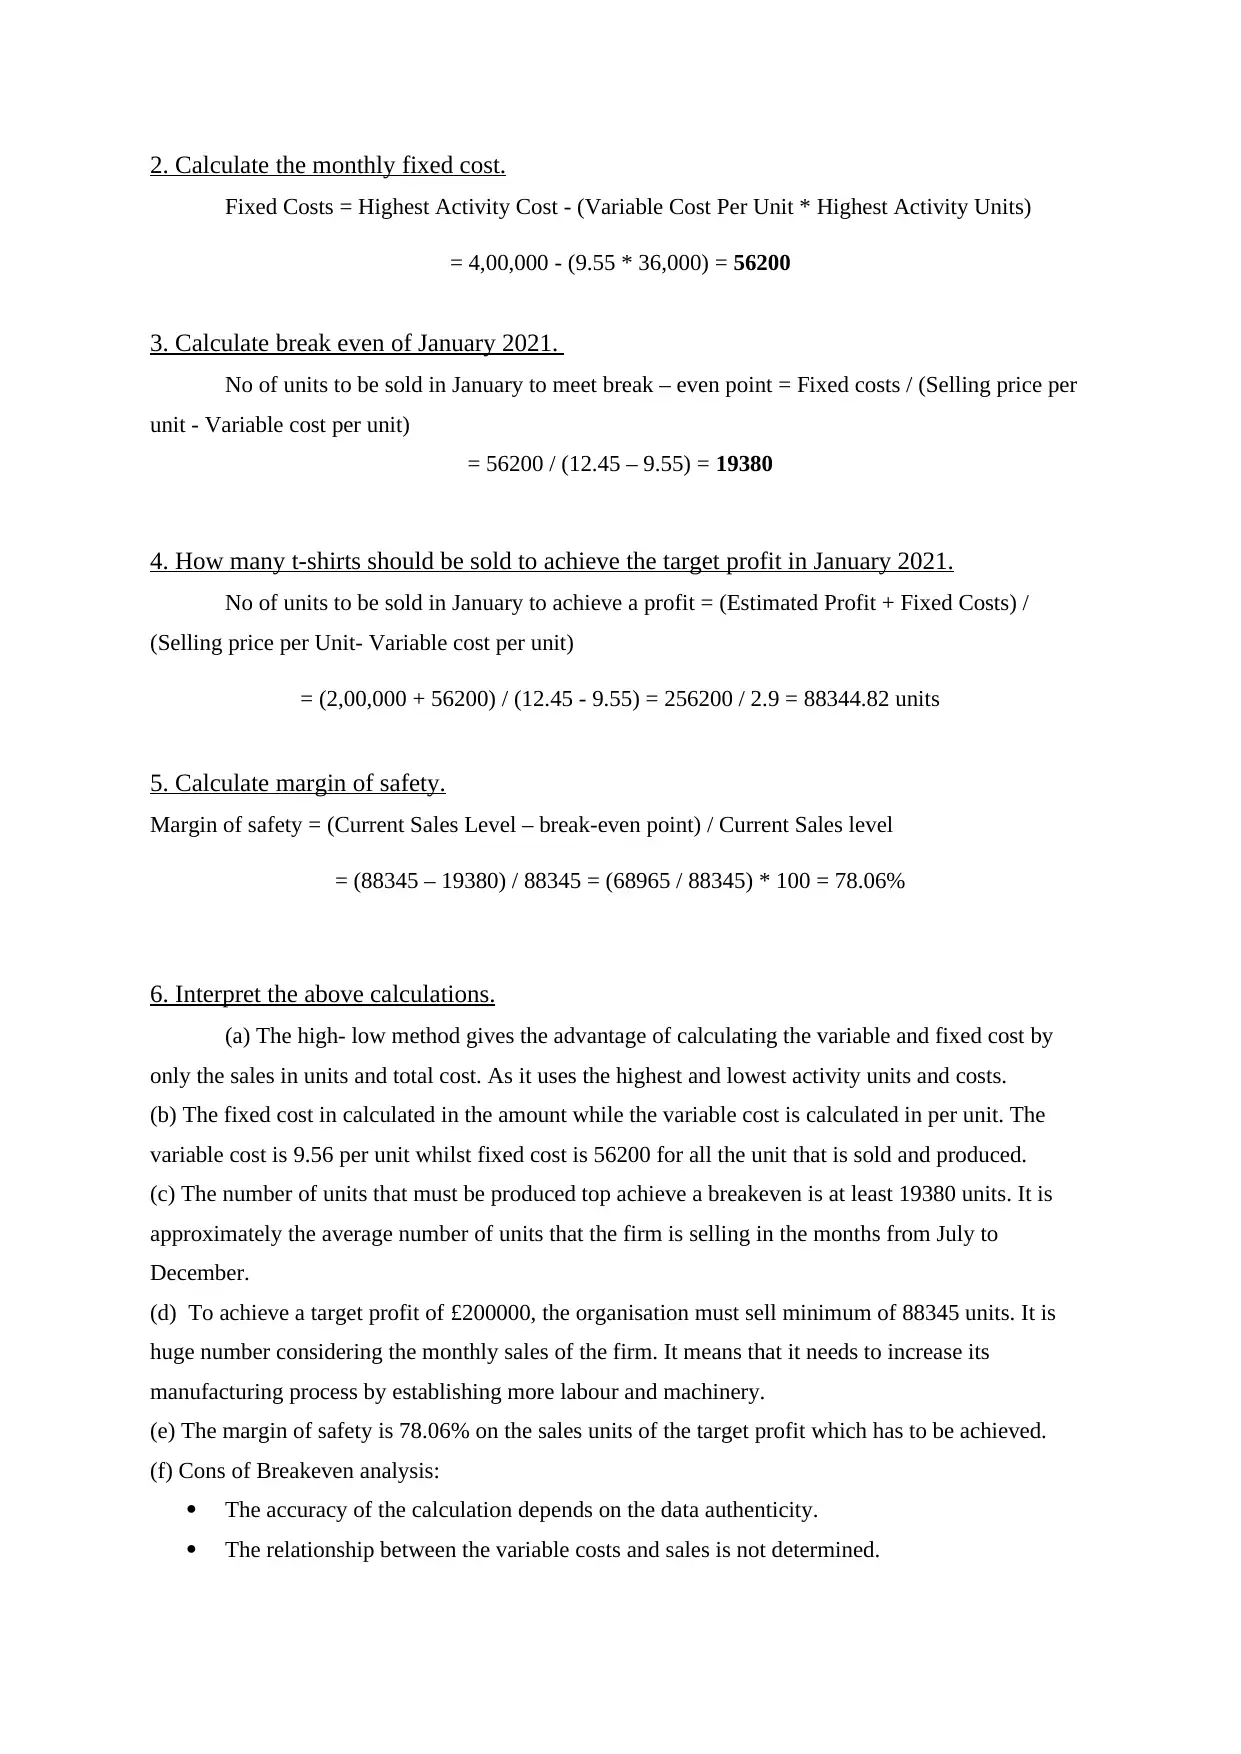
2. Calculate the monthly fixed cost.
Fixed Costs = Highest Activity Cost - (Variable Cost Per Unit * Highest Activity Units)
= 4,00,000 - (9.55 * 36,000) = 56200
3. Calculate break even of January 2021.
No of units to be sold in January to meet break – even point = Fixed costs / (Selling price per
unit - Variable cost per unit)
= 56200 / (12.45 – 9.55) = 19380
4. How many t-shirts should be sold to achieve the target profit in January 2021.
No of units to be sold in January to achieve a profit = (Estimated Profit + Fixed Costs) /
(Selling price per Unit- Variable cost per unit)
= (2,00,000 + 56200) / (12.45 - 9.55) = 256200 / 2.9 = 88344.82 units
5. Calculate margin of safety.
Margin of safety = (Current Sales Level – break-even point) / Current Sales level
= (88345 – 19380) / 88345 = (68965 / 88345) * 100 = 78.06%
6. Interpret the above calculations.
(a) The high- low method gives the advantage of calculating the variable and fixed cost by
only the sales in units and total cost. As it uses the highest and lowest activity units and costs.
(b) The fixed cost in calculated in the amount while the variable cost is calculated in per unit. The
variable cost is 9.56 per unit whilst fixed cost is 56200 for all the unit that is sold and produced.
(c) The number of units that must be produced top achieve a breakeven is at least 19380 units. It is
approximately the average number of units that the firm is selling in the months from July to
December.
(d) To achieve a target profit of £200000, the organisation must sell minimum of 88345 units. It is
huge number considering the monthly sales of the firm. It means that it needs to increase its
manufacturing process by establishing more labour and machinery.
(e) The margin of safety is 78.06% on the sales units of the target profit which has to be achieved.
(f) Cons of Breakeven analysis:
The accuracy of the calculation depends on the data authenticity.
The relationship between the variable costs and sales is not determined.
⊘ This is a preview!⊘
Do you want full access?
Subscribe today to unlock all pages.
Trusted by 1+ million students worldwide
1 out of 13
Related Documents


Your All-in-One AI-Powered Toolkit for Academic Success.
+13062052269
info@desklib.com
Available 24*7 on WhatsApp / Email
![[object Object]](/_next/static/media/star-bottom.7253800d.svg)
Unlock your academic potential
Copyright © 2020–2026 A2Z Services. All Rights Reserved. Developed and managed by ZUCOL.