Business Decision Making: Analysis of Data for Strategic Decisions
VerifiedAdded on 2019/12/03
|18
|3821
|156
Report
AI Summary
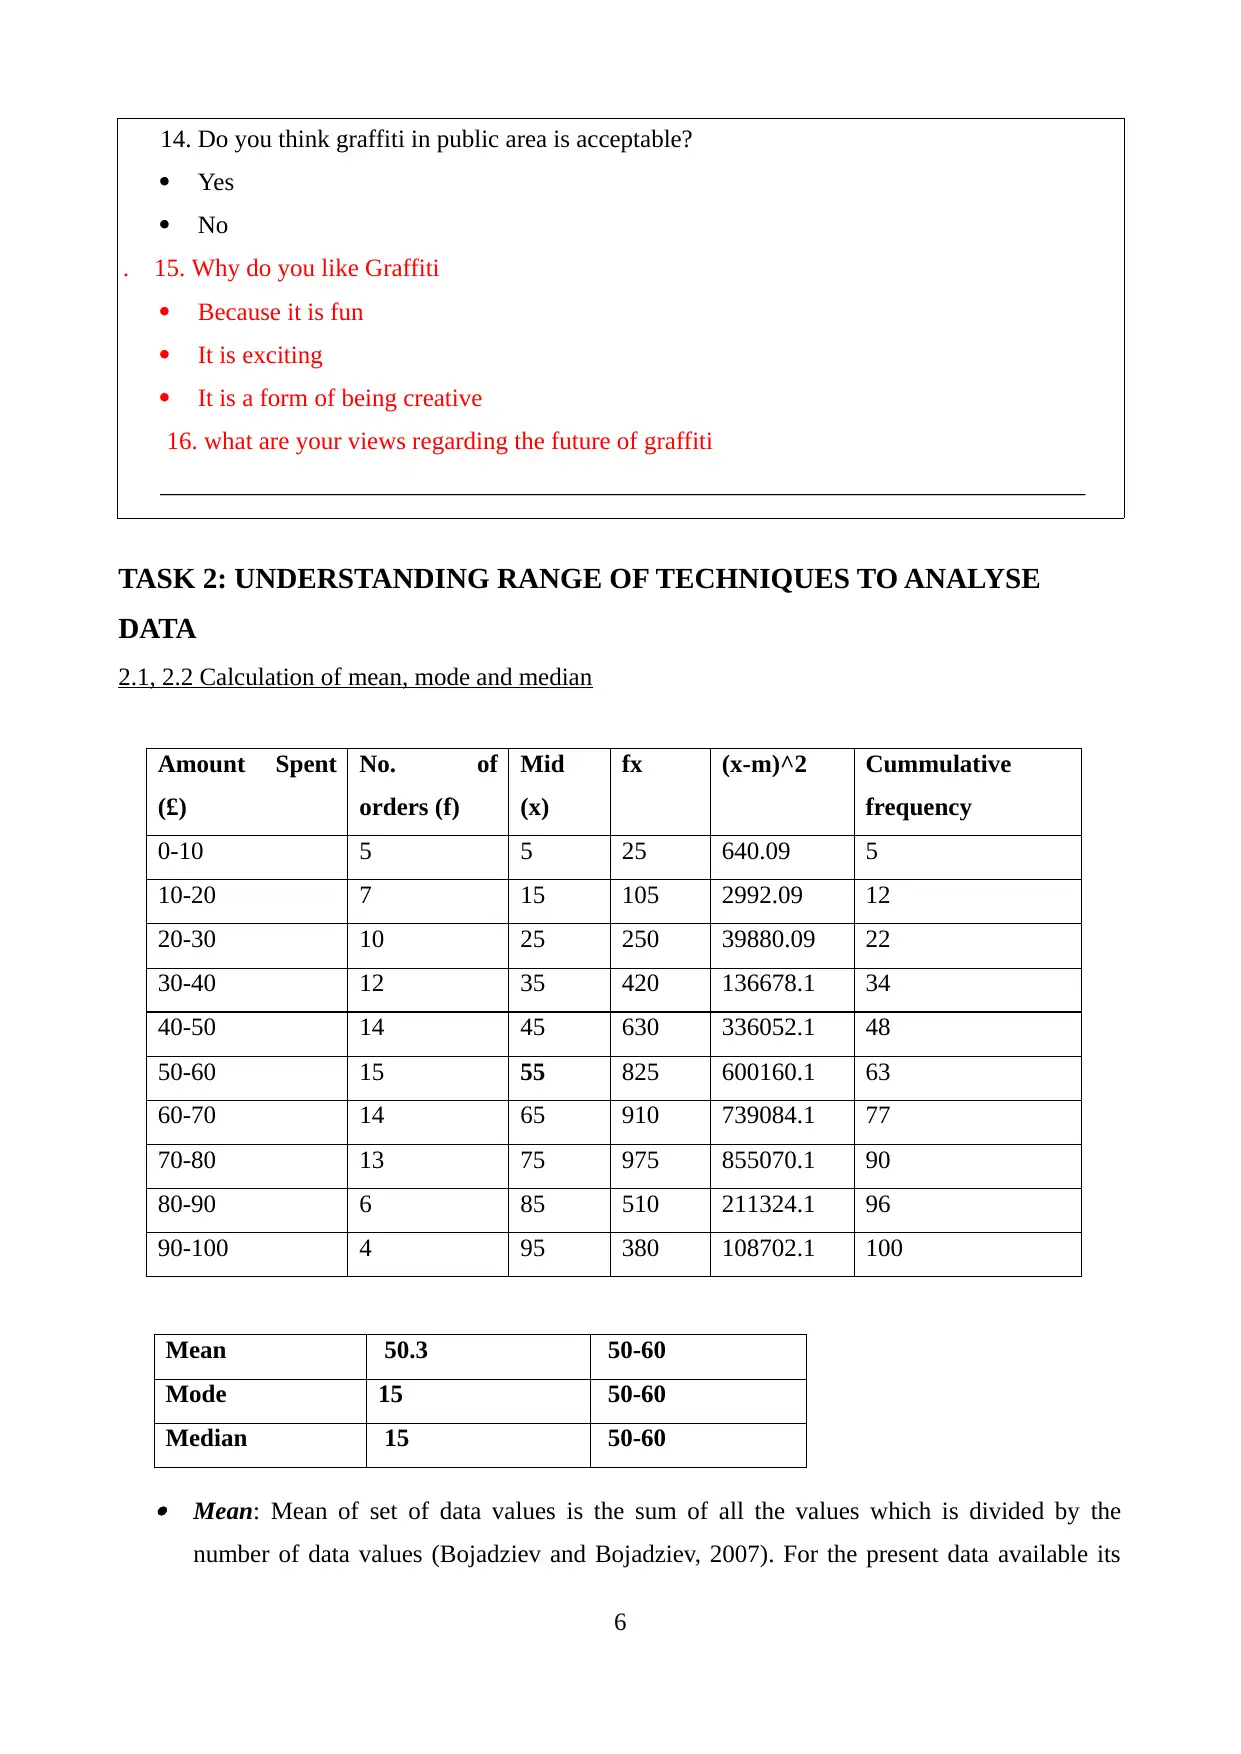
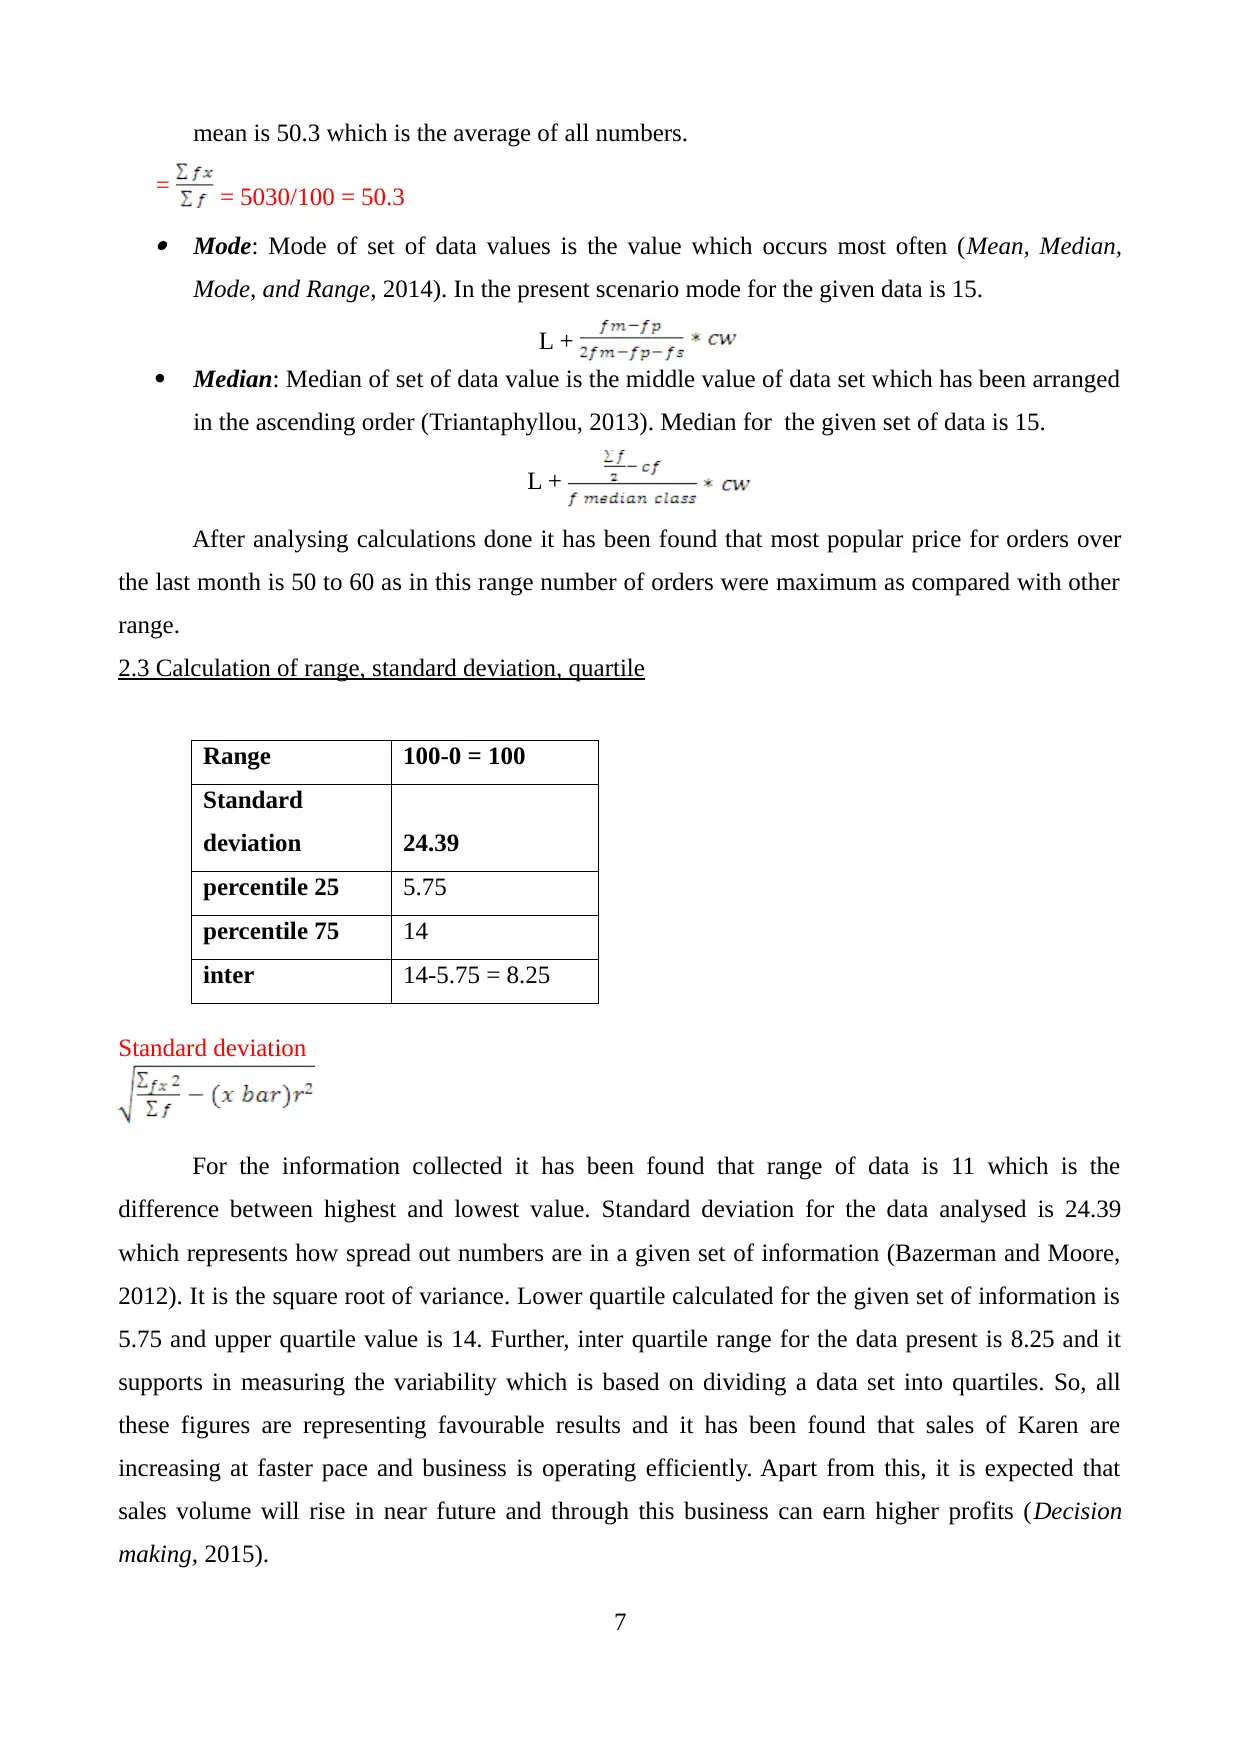
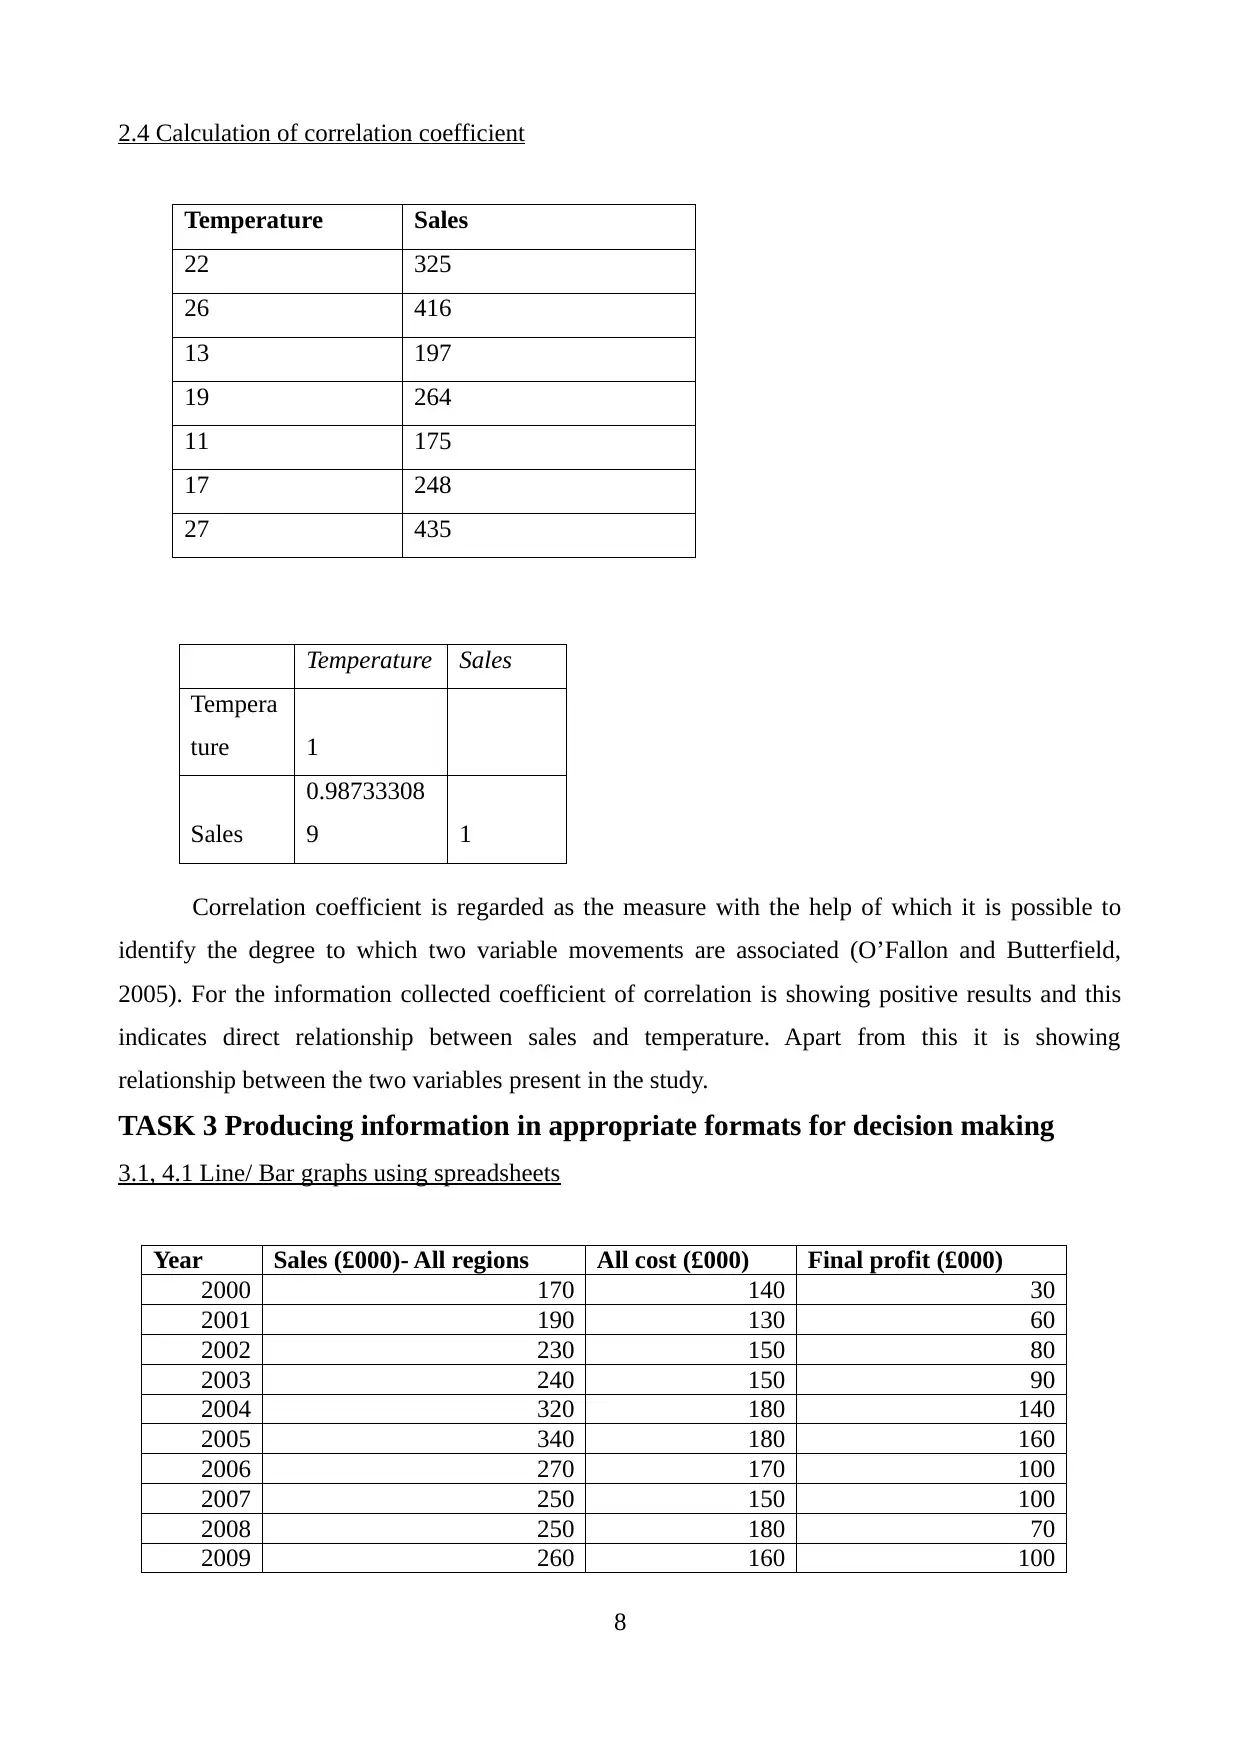
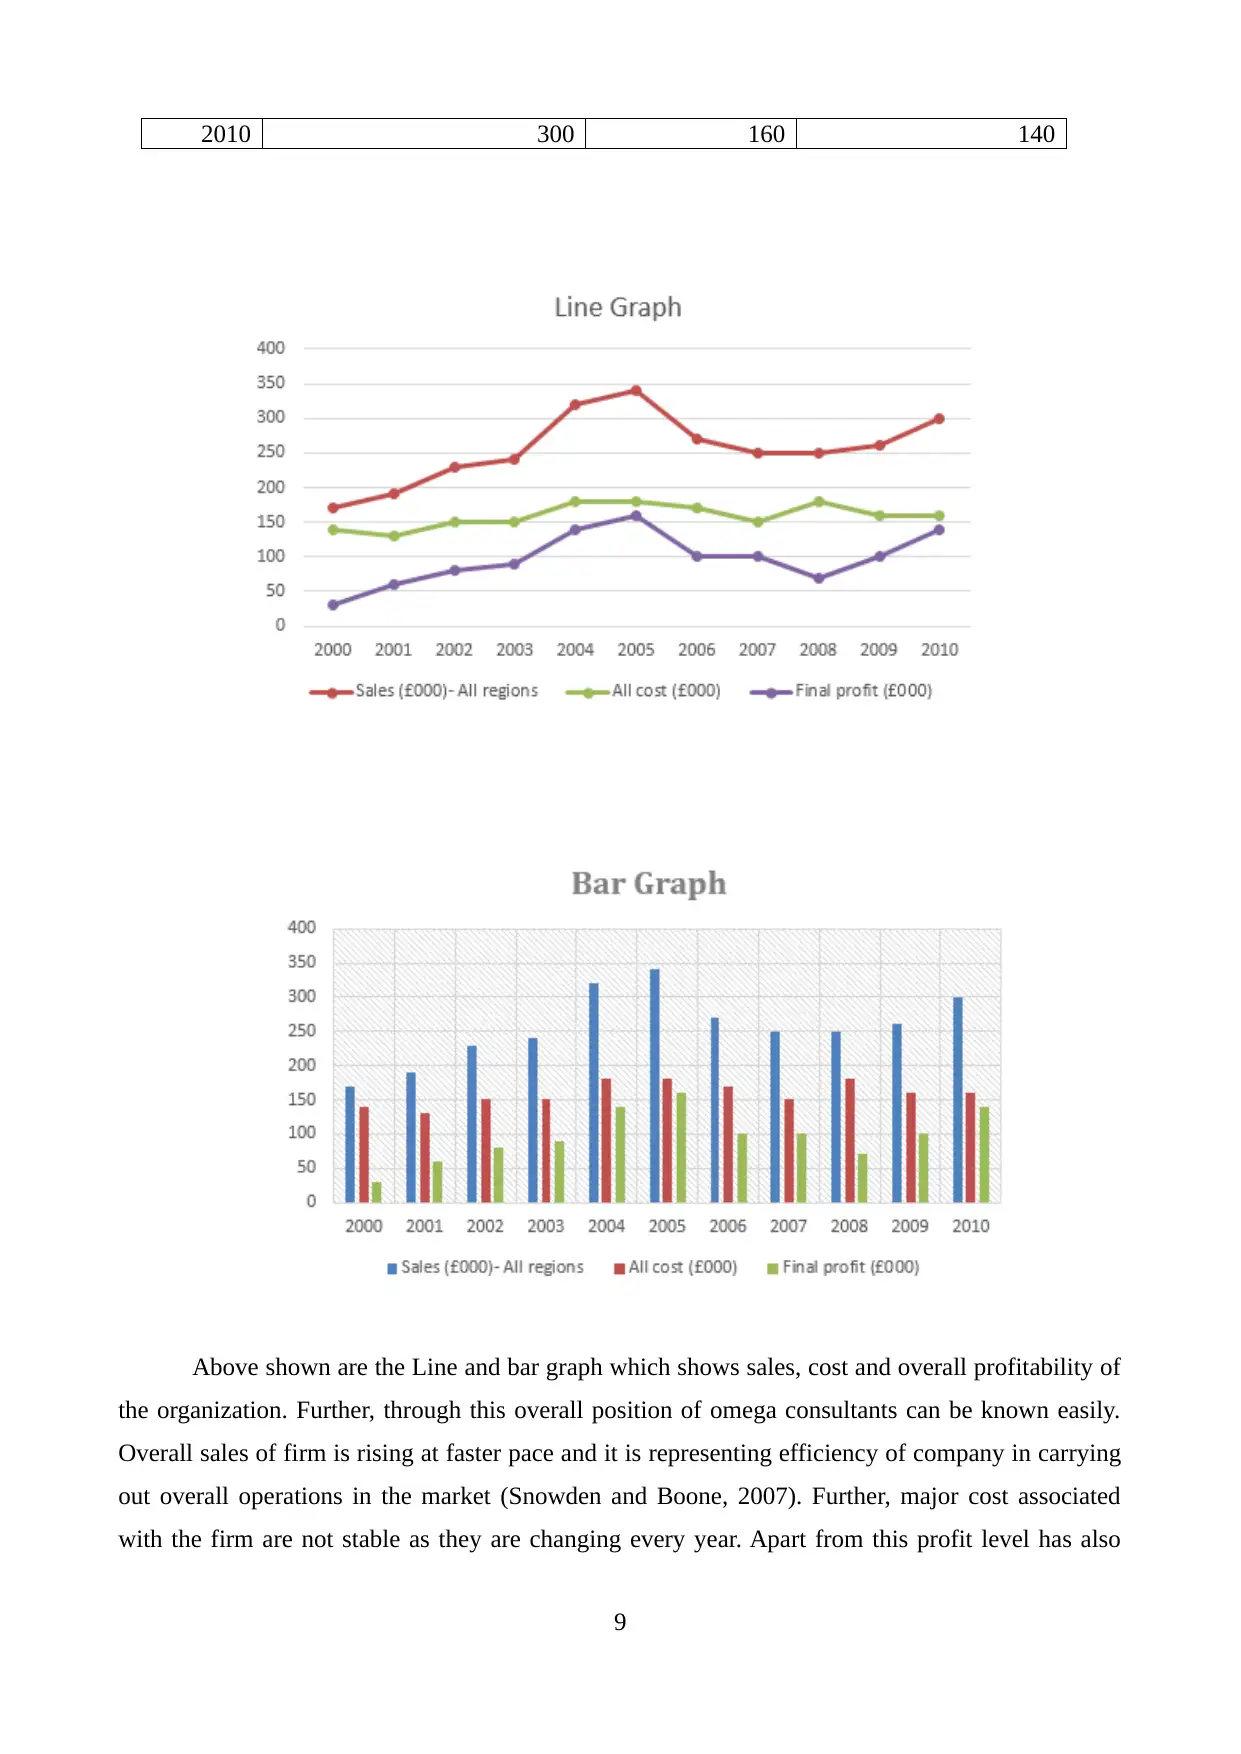
This report delves into the critical aspects of business decision-making, encompassing various stages from data collection to strategic implementation. It outlines a plan for gathering both primary and secondary data, emphasizing the use of questionnaires and online surveys. The report details survey methodologies and sampling frames, along with a sample questionnaire designed to gather insights into consumer preferences. Furthermore, it demonstrates the application of diverse data analysis techniques, including calculations of mean, mode, median, range, standard deviation, and correlation coefficients. The study also focuses on producing information in appropriate formats, utilizing line and bar graphs, trend lines, and formal business reports generated through spreadsheets and PPT presentations. Finally, the report explores the utilization of software-generated information for project duration calculations, critical path analysis, and investment appraisal techniques like payback, IRR, and NPV, providing a comprehensive overview of the decision-making process.

1 out of 18
Related Documents


Your All-in-One AI-Powered Toolkit for Academic Success.
+13062052269
info@desklib.com
Available 24*7 on WhatsApp / Email
![[object Object]](/_next/static/media/star-bottom.7253800d.svg)
Copyright © 2020–2026 A2Z Services. All Rights Reserved. Developed and managed by ZUCOL.