HND Business Decision-Making Report: Food for Friends Expansion Plan
VerifiedAdded on 2020/10/04
|25
|4097
|157
Report
AI Summary
This report analyzes business decision-making processes for the expansion of the Food for Friends restaurant in central London. It begins by outlining a plan for gathering both primary and secondary data, detailing survey methodologies, sampling frames, and the design of a questionnaire. The report then delves into data analysis techniques, including the use of representative values like mean, median, and mode, along with an evaluation of collected data to draw valid business conclusions. Measures of dispersion are also analyzed. Furthermore, it covers the application of different charts and graphs, including trend lines, and information processing tools, such as critical path analysis and investment appraisal methods. The research employs both quantitative and qualitative research methodologies. The report includes questionnaire results that are analyzed to provide insights into customer preferences, pricing, and location for the new restaurant. The analysis includes calculations of mean, median, and mode for various survey questions. Finally, it provides a comprehensive overview of data analysis, its importance in business decision-making, and how the restaurant can use the findings for expansion.

Business Decision-
making
making
Paraphrase This Document
Need a fresh take? Get an instant paraphrase of this document with our AI Paraphraser
INTRODUCTION...........................................................................................................................3
TASK 1............................................................................................................................................3
1.1 Create a plan for gathering of primary and secondary data:............................................3
1.2 Survey methodology and sampling frame used:..............................................................4
1.3 Questionnaire....................................................................................................................5
TASK 2............................................................................................................................................6
2.1: Designing data with the help of representative values....................................................6
2.2: Evaluation of data those are collected from research .....................................................9
2.3: Analysing measure of dispersion..................................................................................10
2.4: Advantages of using quartile, percentile and coefficient correlation............................11
TASK 3..........................................................................................................................................11
3.1: Different charts and graphs.....................................................................................................11
3.2: Trend line......................................................................................................................18
3.3: Covered in PPT.............................................................................................................19
TASK 4..........................................................................................................................................20
4.1 Appropriate information processing tools:.....................................................................20
4.2 Critical path: ..................................................................................................................21
4.3 Investment appraisal method:.........................................................................................23
CONCLUSION..............................................................................................................................24
REFERENCES..............................................................................................................................25
INTRODUCTION
For making an effective decisions, various managers uses diverse tools. The researcher
would do research according to the requirement of the firm. Although, by using primary and
secondary research, company could use an effective strategy that can be used by the company for
achieving its pre-set targets (Yager and Zadeh, 2012). This report is based on the Food for
friends restaurant which is planning to expand its operations in central London. For expanding
the operations of food for friends, there is a strong needs to have research so that they could
form an effective decisions.
TASK 1
1.1 Create a plan for gathering of primary and secondary data:
Data is the tool which is used by the company for making an effective decisions for the
firm. Although, this can be said that the researcher can use primary and secondary methods for
making business objectives effective and efficient manner. Under this case, this can be said that
the food for friend is going to use various data collection method in order to make decisions
regarding expansion in central London (Hastie and Dawes, 2010).
Primary data: This is the technique which is used by the researcher for the first time.
However, this is the time consuming process as this requires much time for gathering data via
primary data collection methods. This can be used where the data requirement is less. In that
case, the data can be gathered by using this tool. Although, this can be said that the food for
friends restaurant would adopt the primary methodology for collecting the data from the central
London. With the help of primary data, company could use an effective strategy that can be used
by the company for gaining sustainability. Here are various data collection tool under primary
research. Which are: questionnaire, observation, interview and case study.
Secondary method: This is the method which is used by the researcher if the data
requirement is huge. There are various tools that can be used by the researcher for gathering
secondary data method. Secondary data can be collected by way of books, articles, and any other
modes which have already been published (Zavadskas and Turskis, 2011). Secondary data is
implemented in order to enhance the sampling size of the research studies and is likewise
selected for efficiency which emerges while using already published data. Secondary data helps
the researcher for gathering the data in a huge quantity. The most common of current secondary
3
⊘ This is a preview!⊘
Do you want full access?
Subscribe today to unlock all pages.
Trusted by 1+ million students worldwide
data covers data gathered by the public departments, libraries, internet. Companies implement
market research in order to draw on the current information from social media by way of
secondary data. Here, some of the information are gathered from secondary data tool. Such as,
market information of Central London, main competitors data.
1.2 Survey methodology and sampling frame used:
Survey method could be elaborated as questioning individuals on a topics and then
elaborates their responses. In the business research, primary data collection is implemented in
order to test concepts which demonstrates the attitude of people, forming level of customer
satisfaction, convene segmentation research and other purpose (Ghattas, Soffer and Peleg, 2014).
Survey method could be used quantitative and qualitative basis.
1. Survey method follows two crucial aspects or characteristic of population and
2. Testing hypothesis about the nature of connection within the population.
Survey method could be highly divided into three categories: Mail survey, telephone
survey and interview. Descriptive research is mostly covers survey and organise study which
aims to identify the facts which renders state of affairs as this exist during the research. On the
other hand, analytical research is based on the research practices which is differences in other
ways. Under this research, researchers would implement already published data for forming vital
assessment of the material.
Exploratory research tool is intended to explore survey areas which can't attempts to offer
closing answers to a research questions.
Qualitative research methodology: Under this research, research is convened by using
qualitative research methodology. As this is based on the facts and figures. Although, this is a
most effective tool that can be used for making business decision making (Power and Phillips-
Wren, 2011).
Sampling framing methodology: For aiming of identifying positive results from a
research work, this is crucial to form similar samples from the available group of consumers.
This is likewise to divided into various parts:
Random sampling: This is higher effective sampling tools which is used over a selected
number of people out of the group. Sampling method is the tool which is used while gathering
data from the market. Under this, few respondents are selected out of the total population. There
are few other sampling tools like Quota, stratified, cluster and others. This is the research which
4
Paraphrase This Document
Need a fresh take? Get an instant paraphrase of this document with our AI Paraphraser
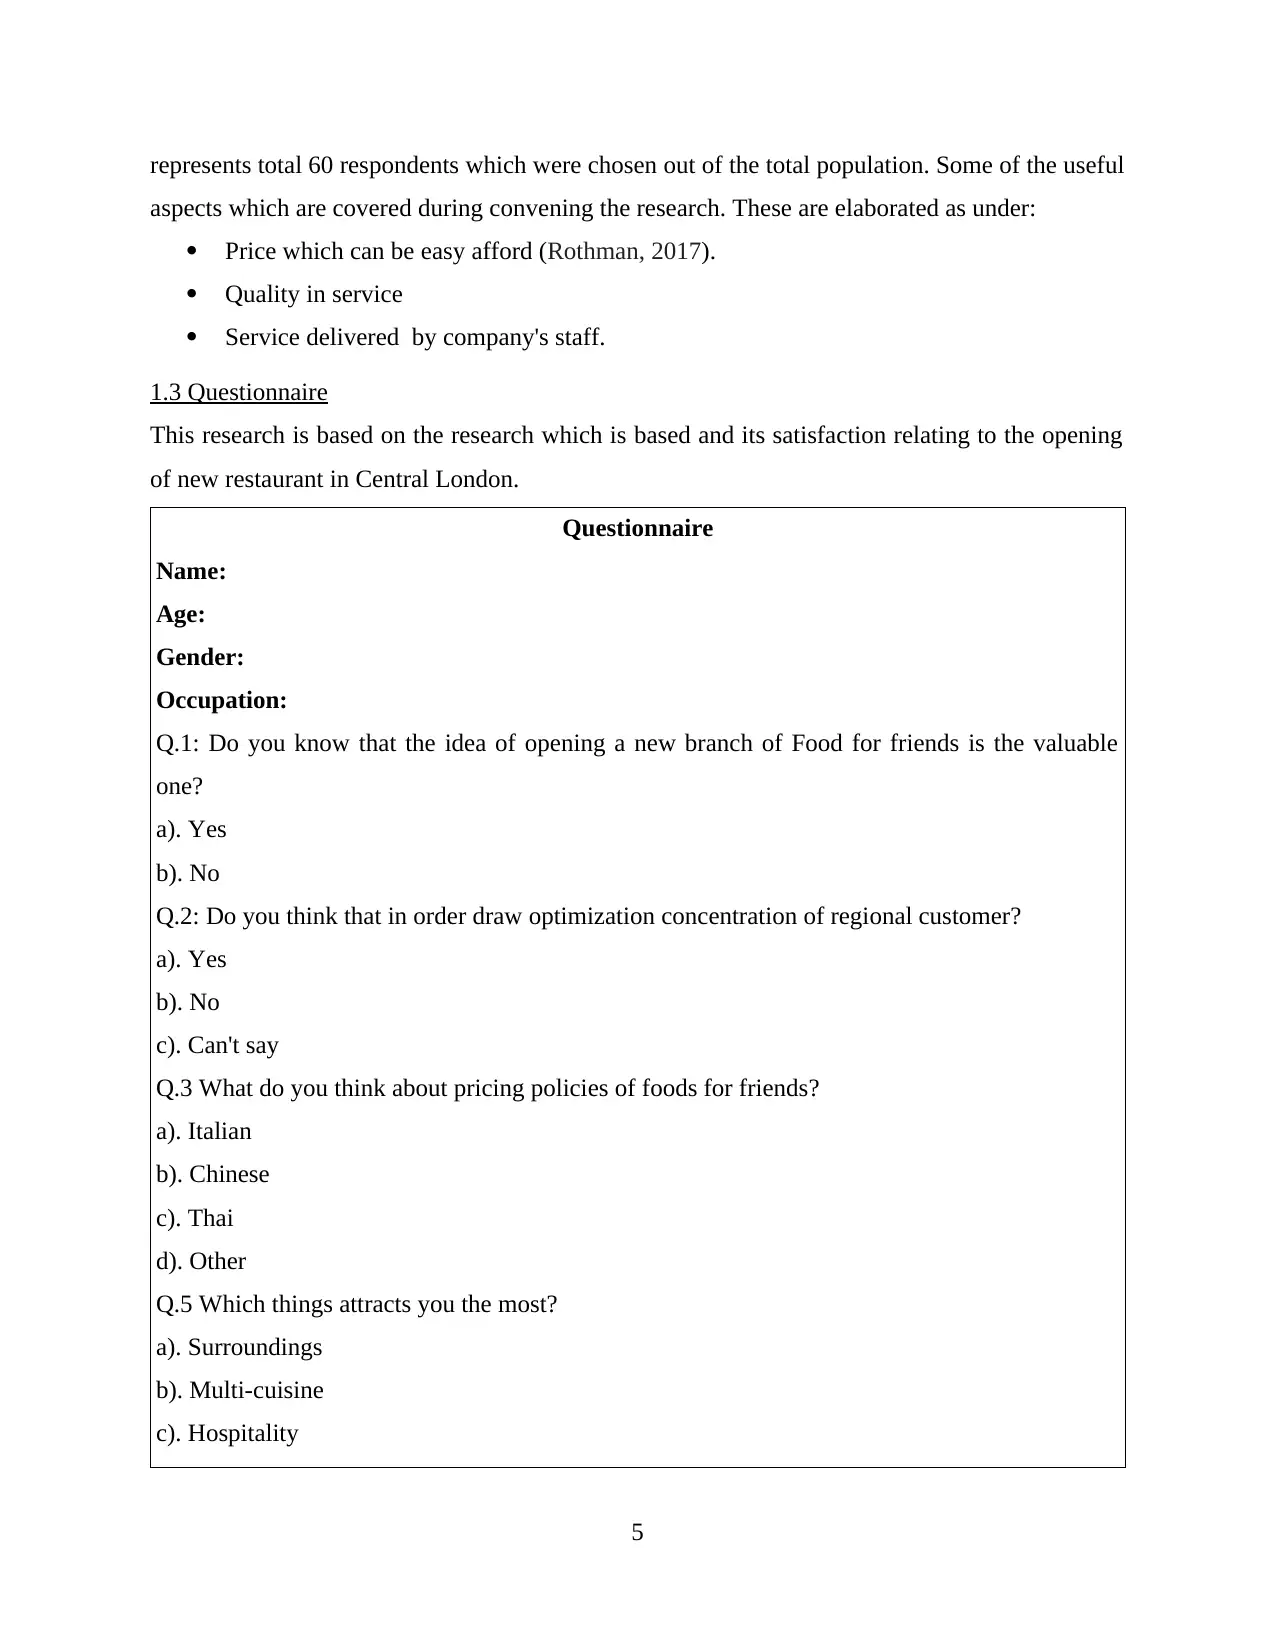
represents total 60 respondents which were chosen out of the total population. Some of the useful
aspects which are covered during convening the research. These are elaborated as under:
Price which can be easy afford (Rothman, 2017).
Quality in service
Service delivered by company's staff.
1.3 Questionnaire
This research is based on the research which is based and its satisfaction relating to the opening
of new restaurant in Central London.
Questionnaire
Name:
Age:
Gender:
Occupation:
Q.1: Do you know that the idea of opening a new branch of Food for friends is the valuable
one?
a). Yes
b). No
Q.2: Do you think that in order draw optimization concentration of regional customer?
a). Yes
b). No
c). Can't say
Q.3 What do you think about pricing policies of foods for friends?
a). Italian
b). Chinese
c). Thai
d). Other
Q.5 Which things attracts you the most?
a). Surroundings
b). Multi-cuisine
c). Hospitality
5
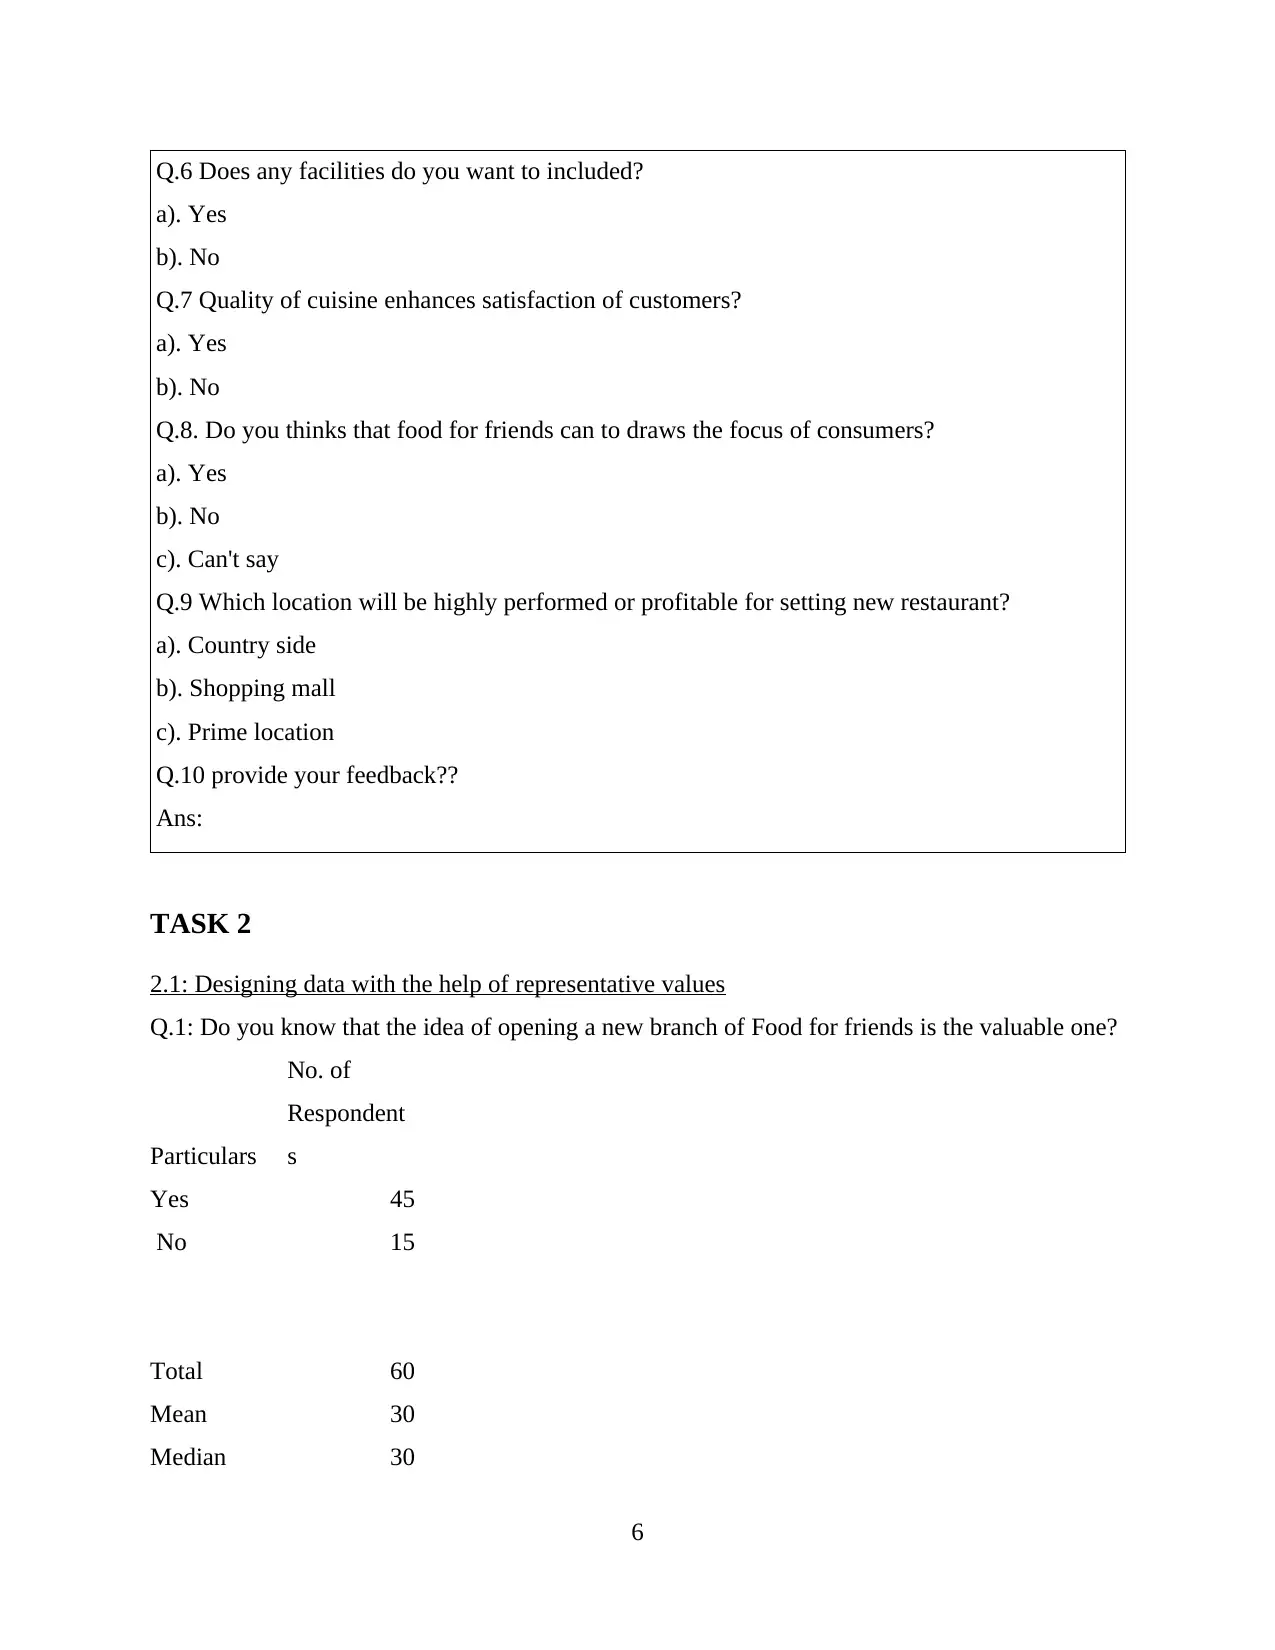
Q.6 Does any facilities do you want to included?
a). Yes
b). No
Q.7 Quality of cuisine enhances satisfaction of customers?
a). Yes
b). No
Q.8. Do you thinks that food for friends can to draws the focus of consumers?
a). Yes
b). No
c). Can't say
Q.9 Which location will be highly performed or profitable for setting new restaurant?
a). Country side
b). Shopping mall
c). Prime location
Q.10 provide your feedback??
Ans:
TASK 2
2.1: Designing data with the help of representative values
Q.1: Do you know that the idea of opening a new branch of Food for friends is the valuable one?
Particulars
No. of
Respondent
s
Yes 45
No 15
Total 60
Mean 30
Median 30
6
a). Yes
b). No
Q.7 Quality of cuisine enhances satisfaction of customers?
a). Yes
b). No
Q.8. Do you thinks that food for friends can to draws the focus of consumers?
a). Yes
b). No
c). Can't say
Q.9 Which location will be highly performed or profitable for setting new restaurant?
a). Country side
b). Shopping mall
c). Prime location
Q.10 provide your feedback??
Ans:
TASK 2
2.1: Designing data with the help of representative values
Q.1: Do you know that the idea of opening a new branch of Food for friends is the valuable one?
Particulars
No. of
Respondent
s
Yes 45
No 15
Total 60
Mean 30
Median 30
6
⊘ This is a preview!⊘
Do you want full access?
Subscribe today to unlock all pages.
Trusted by 1+ million students worldwide
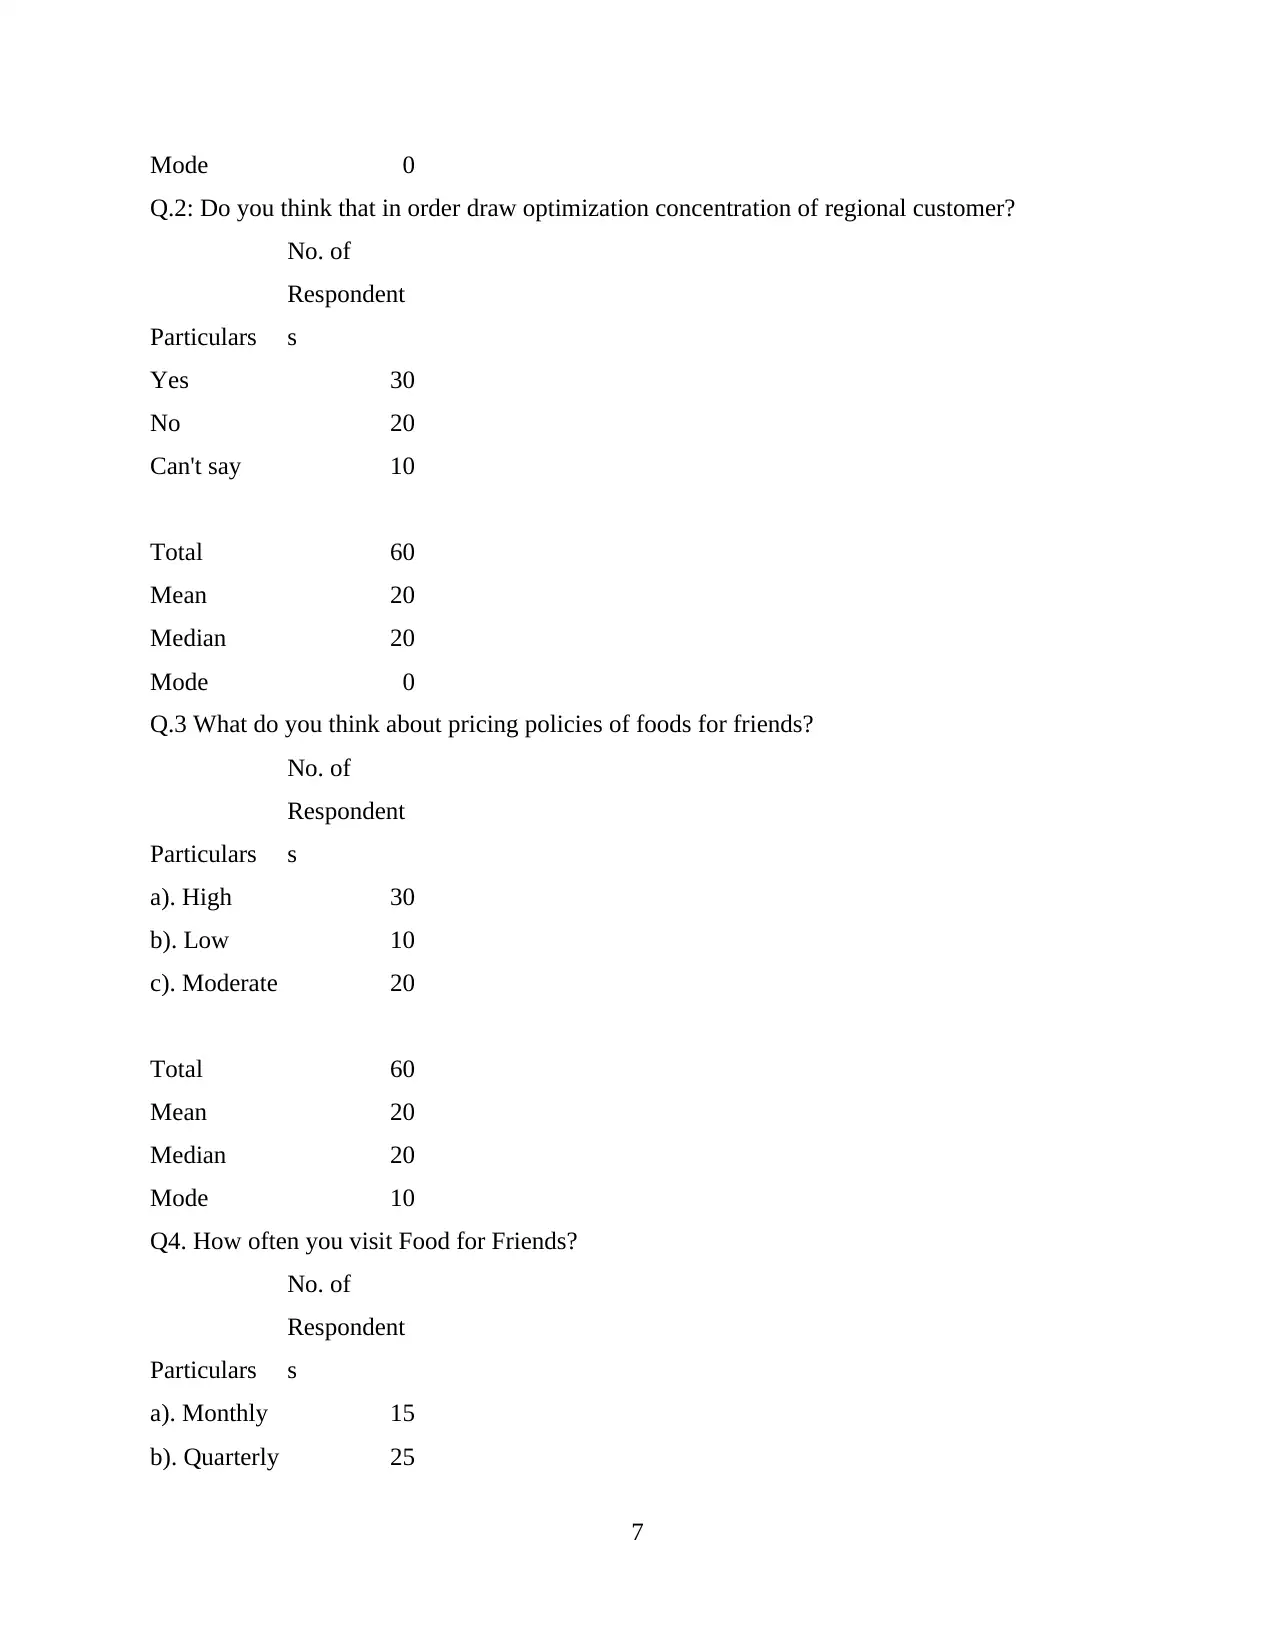
Mode 0
Q.2: Do you think that in order draw optimization concentration of regional customer?
Particulars
No. of
Respondent
s
Yes 30
No 20
Can't say 10
Total 60
Mean 20
Median 20
Mode 0
Q.3 What do you think about pricing policies of foods for friends?
Particulars
No. of
Respondent
s
a). High 30
b). Low 10
c). Moderate 20
Total 60
Mean 20
Median 20
Mode 10
Q4. How often you visit Food for Friends?
Particulars
No. of
Respondent
s
a). Monthly 15
b). Quarterly 25
7
Paraphrase This Document
Need a fresh take? Get an instant paraphrase of this document with our AI Paraphraser
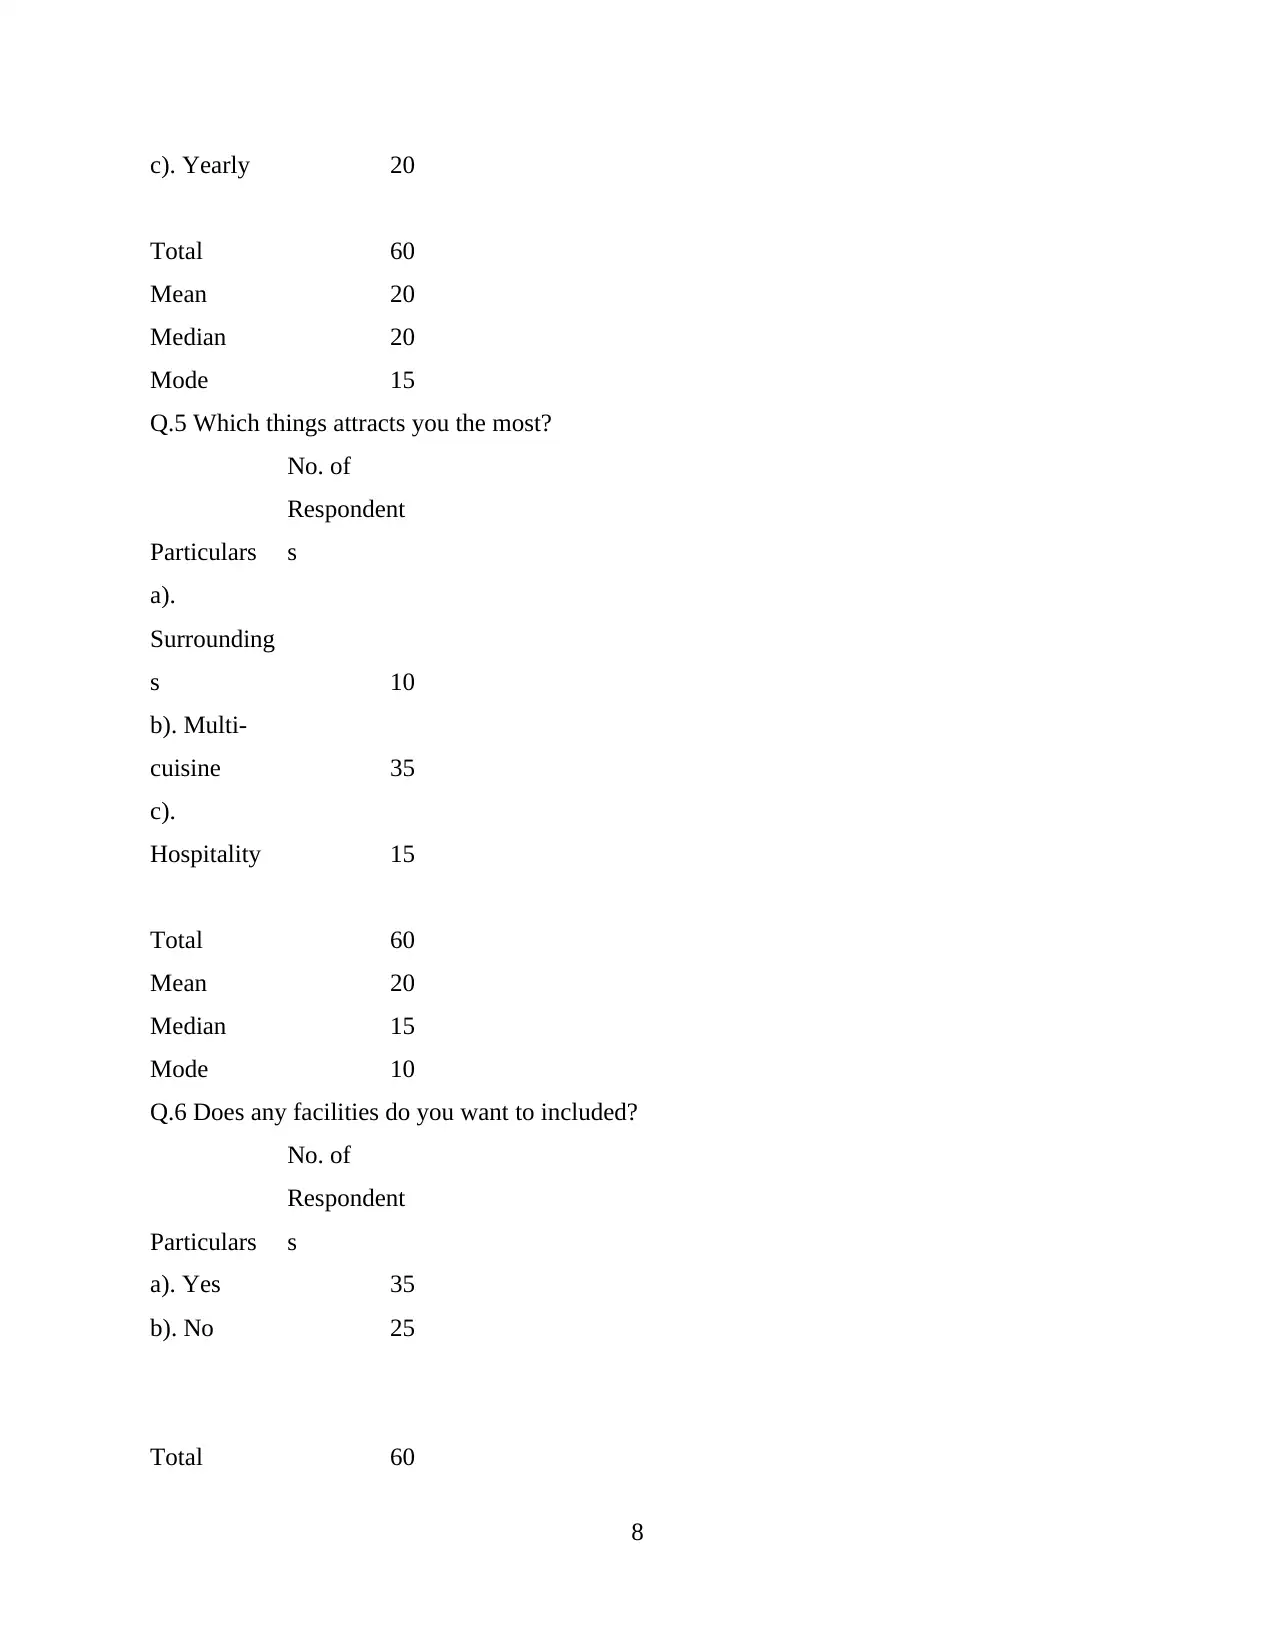
c). Yearly 20
Total 60
Mean 20
Median 20
Mode 15
Q.5 Which things attracts you the most?
Particulars
No. of
Respondent
s
a).
Surrounding
s 10
b). Multi-
cuisine 35
c).
Hospitality 15
Total 60
Mean 20
Median 15
Mode 10
Q.6 Does any facilities do you want to included?
Particulars
No. of
Respondent
s
a). Yes 35
b). No 25
Total 60
8
Total 60
Mean 20
Median 20
Mode 15
Q.5 Which things attracts you the most?
Particulars
No. of
Respondent
s
a).
Surrounding
s 10
b). Multi-
cuisine 35
c).
Hospitality 15
Total 60
Mean 20
Median 15
Mode 10
Q.6 Does any facilities do you want to included?
Particulars
No. of
Respondent
s
a). Yes 35
b). No 25
Total 60
8
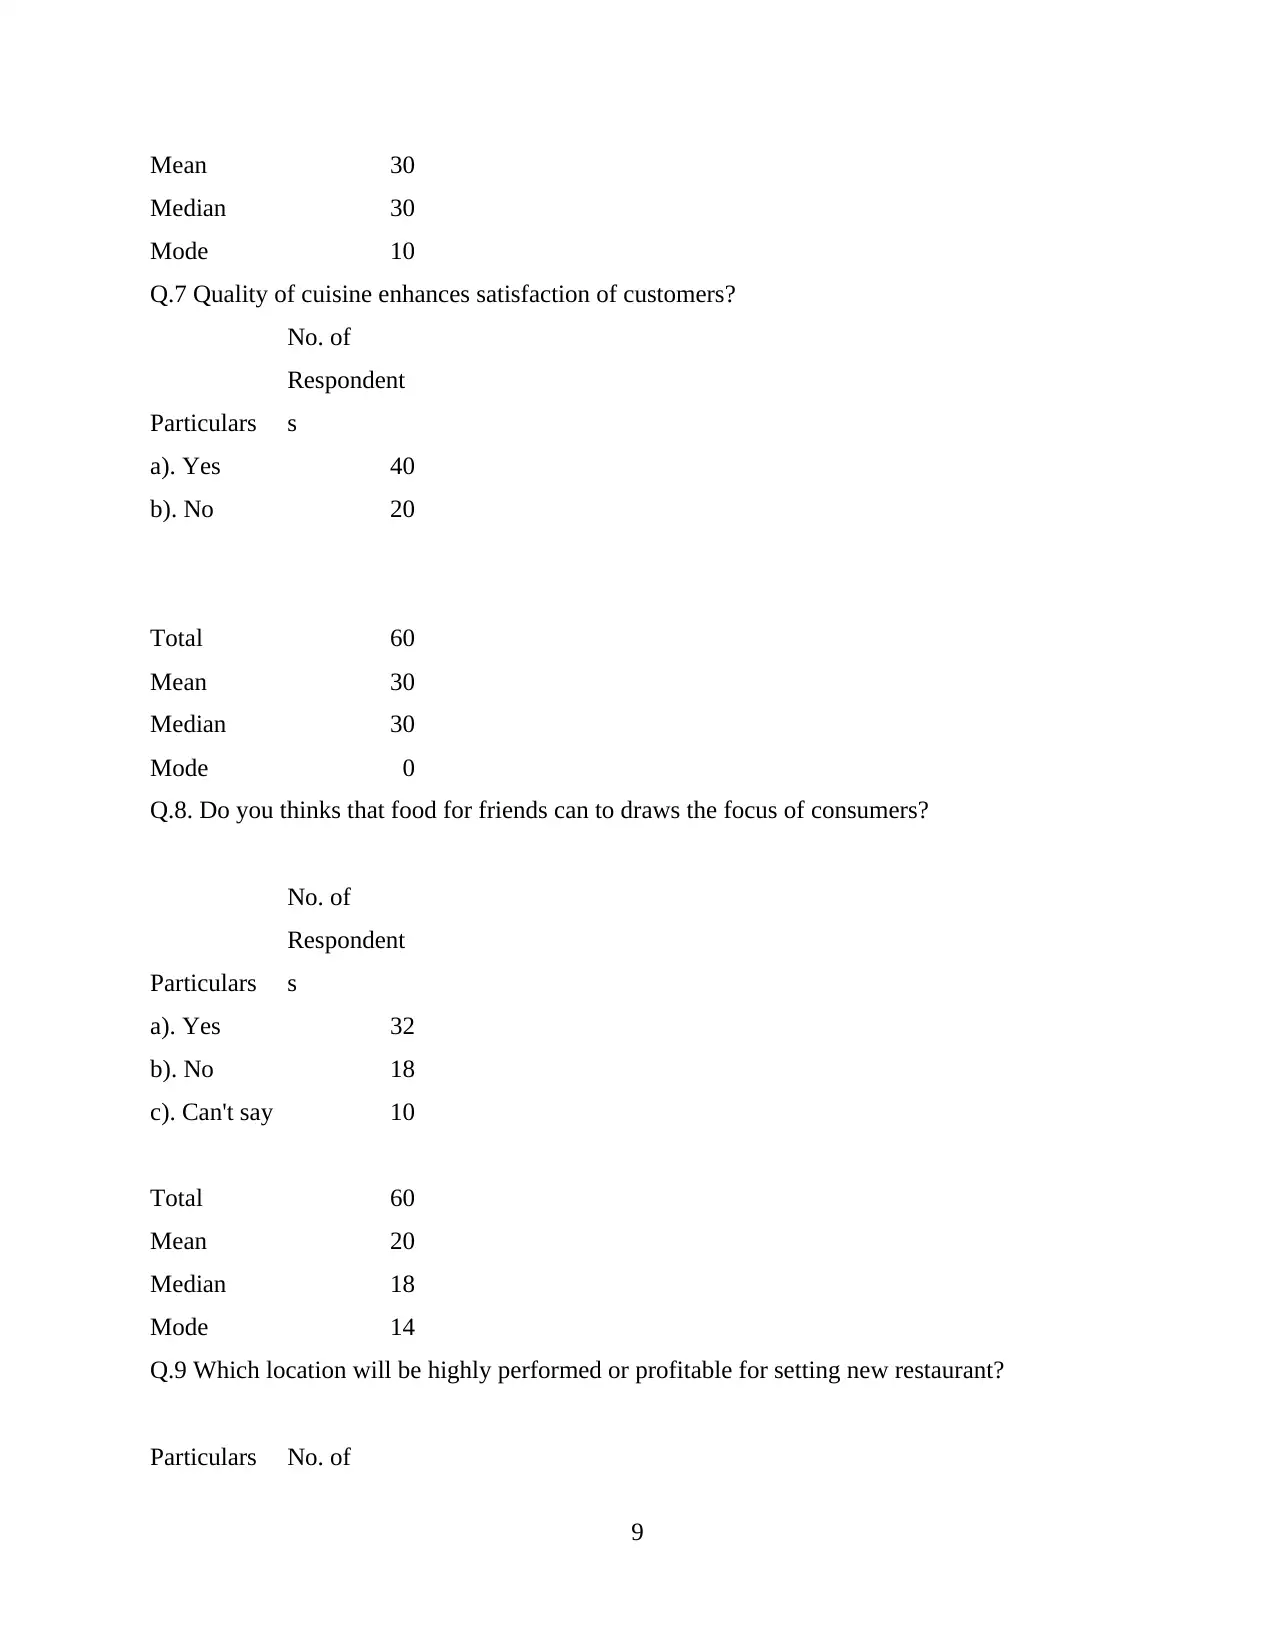
Mean 30
Median 30
Mode 10
Q.7 Quality of cuisine enhances satisfaction of customers?
Particulars
No. of
Respondent
s
a). Yes 40
b). No 20
Total 60
Mean 30
Median 30
Mode 0
Q.8. Do you thinks that food for friends can to draws the focus of consumers?
Particulars
No. of
Respondent
s
a). Yes 32
b). No 18
c). Can't say 10
Total 60
Mean 20
Median 18
Mode 14
Q.9 Which location will be highly performed or profitable for setting new restaurant?
Particulars No. of
9
Median 30
Mode 10
Q.7 Quality of cuisine enhances satisfaction of customers?
Particulars
No. of
Respondent
s
a). Yes 40
b). No 20
Total 60
Mean 30
Median 30
Mode 0
Q.8. Do you thinks that food for friends can to draws the focus of consumers?
Particulars
No. of
Respondent
s
a). Yes 32
b). No 18
c). Can't say 10
Total 60
Mean 20
Median 18
Mode 14
Q.9 Which location will be highly performed or profitable for setting new restaurant?
Particulars No. of
9
⊘ This is a preview!⊘
Do you want full access?
Subscribe today to unlock all pages.
Trusted by 1+ million students worldwide
Respondent
s
a). Country
side 12
b). Shopping
mall 18
c). Prime
location 30
Total 60
Mean 20
Median 18
Mode 12
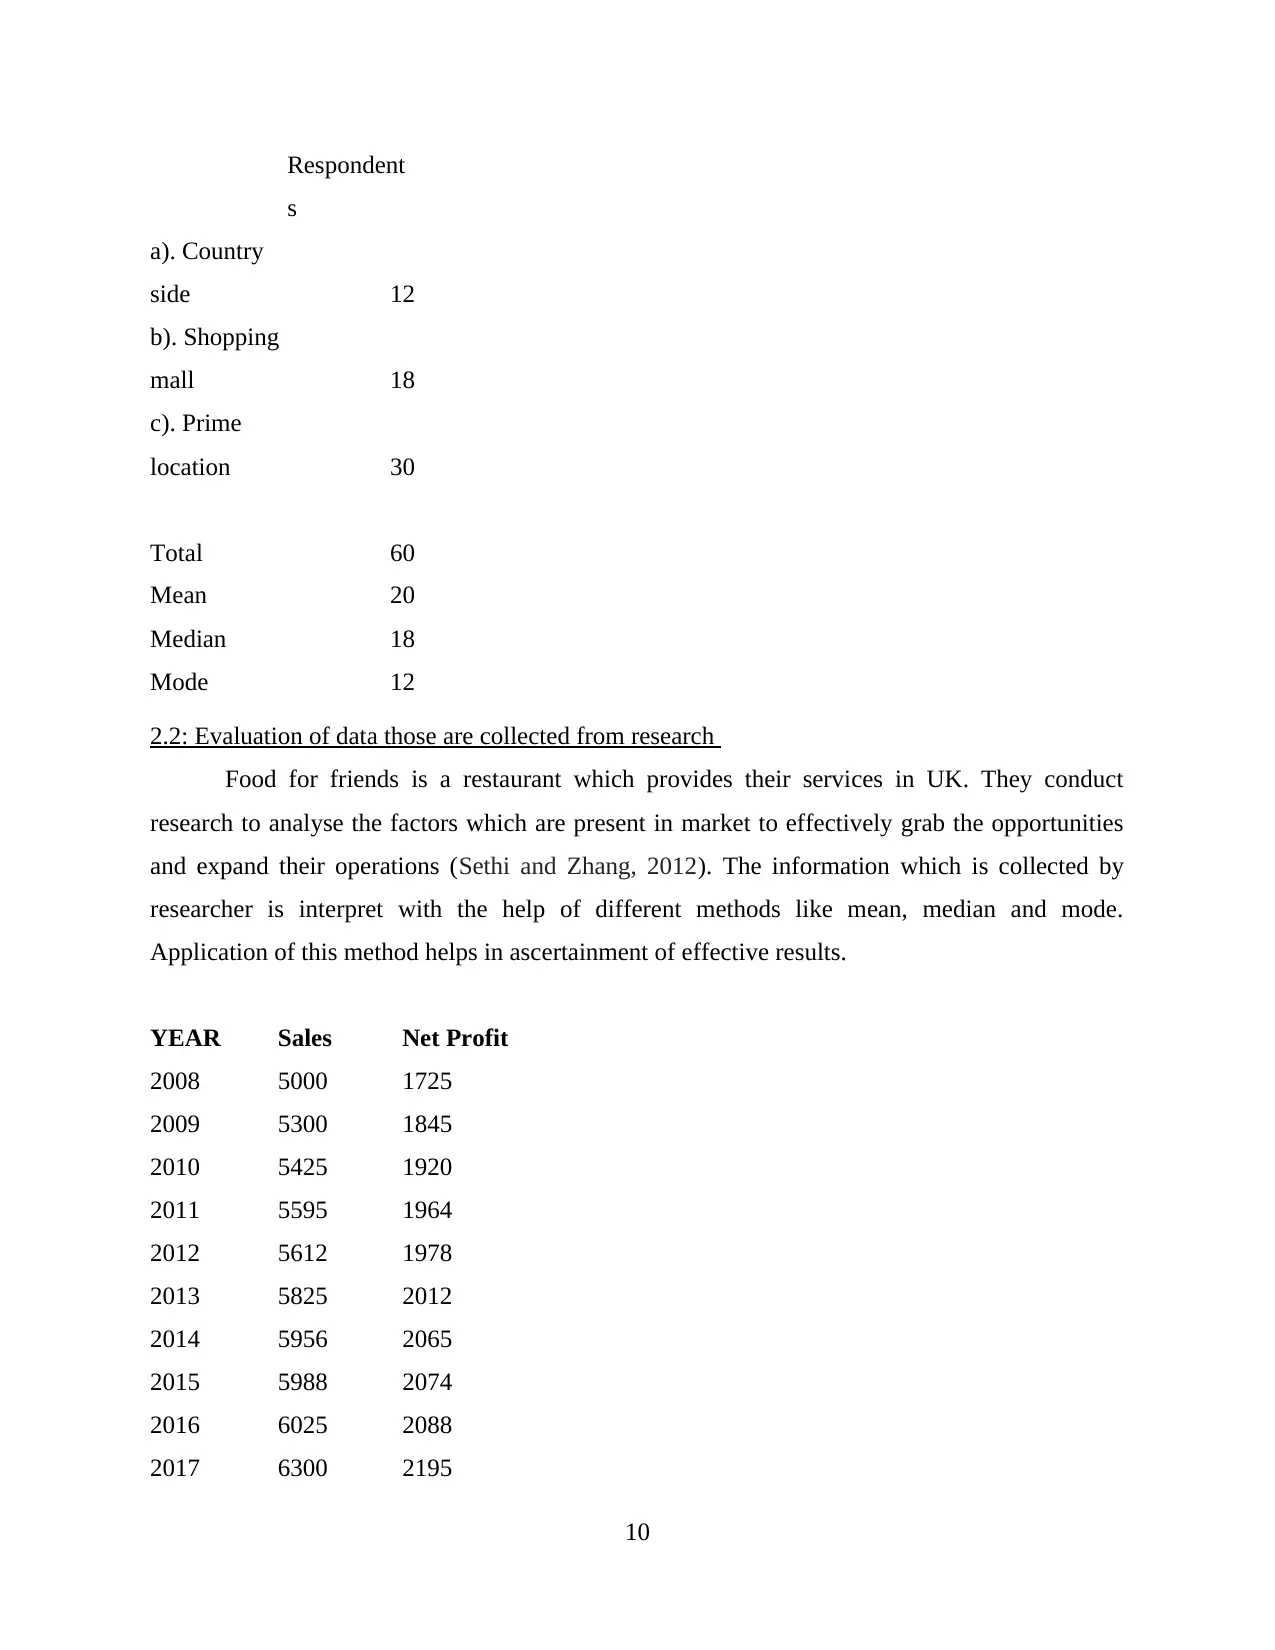
2.2: Evaluation of data those are collected from research
Food for friends is a restaurant which provides their services in UK. They conduct
research to analyse the factors which are present in market to effectively grab the opportunities
and expand their operations (Sethi and Zhang, 2012). The information which is collected by
researcher is interpret with the help of different methods like mean, median and mode.
Application of this method helps in ascertainment of effective results.
YEAR Sales Net Profit
2008 5000 1725
2009 5300 1845
2010 5425 1920
2011 5595 1964
2012 5612 1978
2013 5825 2012
2014 5956 2065
2015 5988 2074
2016 6025 2088
2017 6300 2195
10
s
a). Country
side 12
b). Shopping
mall 18
c). Prime
location 30
Total 60
Mean 20
Median 18
Mode 12
2.2: Evaluation of data those are collected from research
Food for friends is a restaurant which provides their services in UK. They conduct
research to analyse the factors which are present in market to effectively grab the opportunities
and expand their operations (Sethi and Zhang, 2012). The information which is collected by
researcher is interpret with the help of different methods like mean, median and mode.
Application of this method helps in ascertainment of effective results.
YEAR Sales Net Profit
2008 5000 1725
2009 5300 1845
2010 5425 1920
2011 5595 1964
2012 5612 1978
2013 5825 2012
2014 5956 2065
2015 5988 2074
2016 6025 2088
2017 6300 2195
10
Paraphrase This Document
Need a fresh take? Get an instant paraphrase of this document with our AI Paraphraser
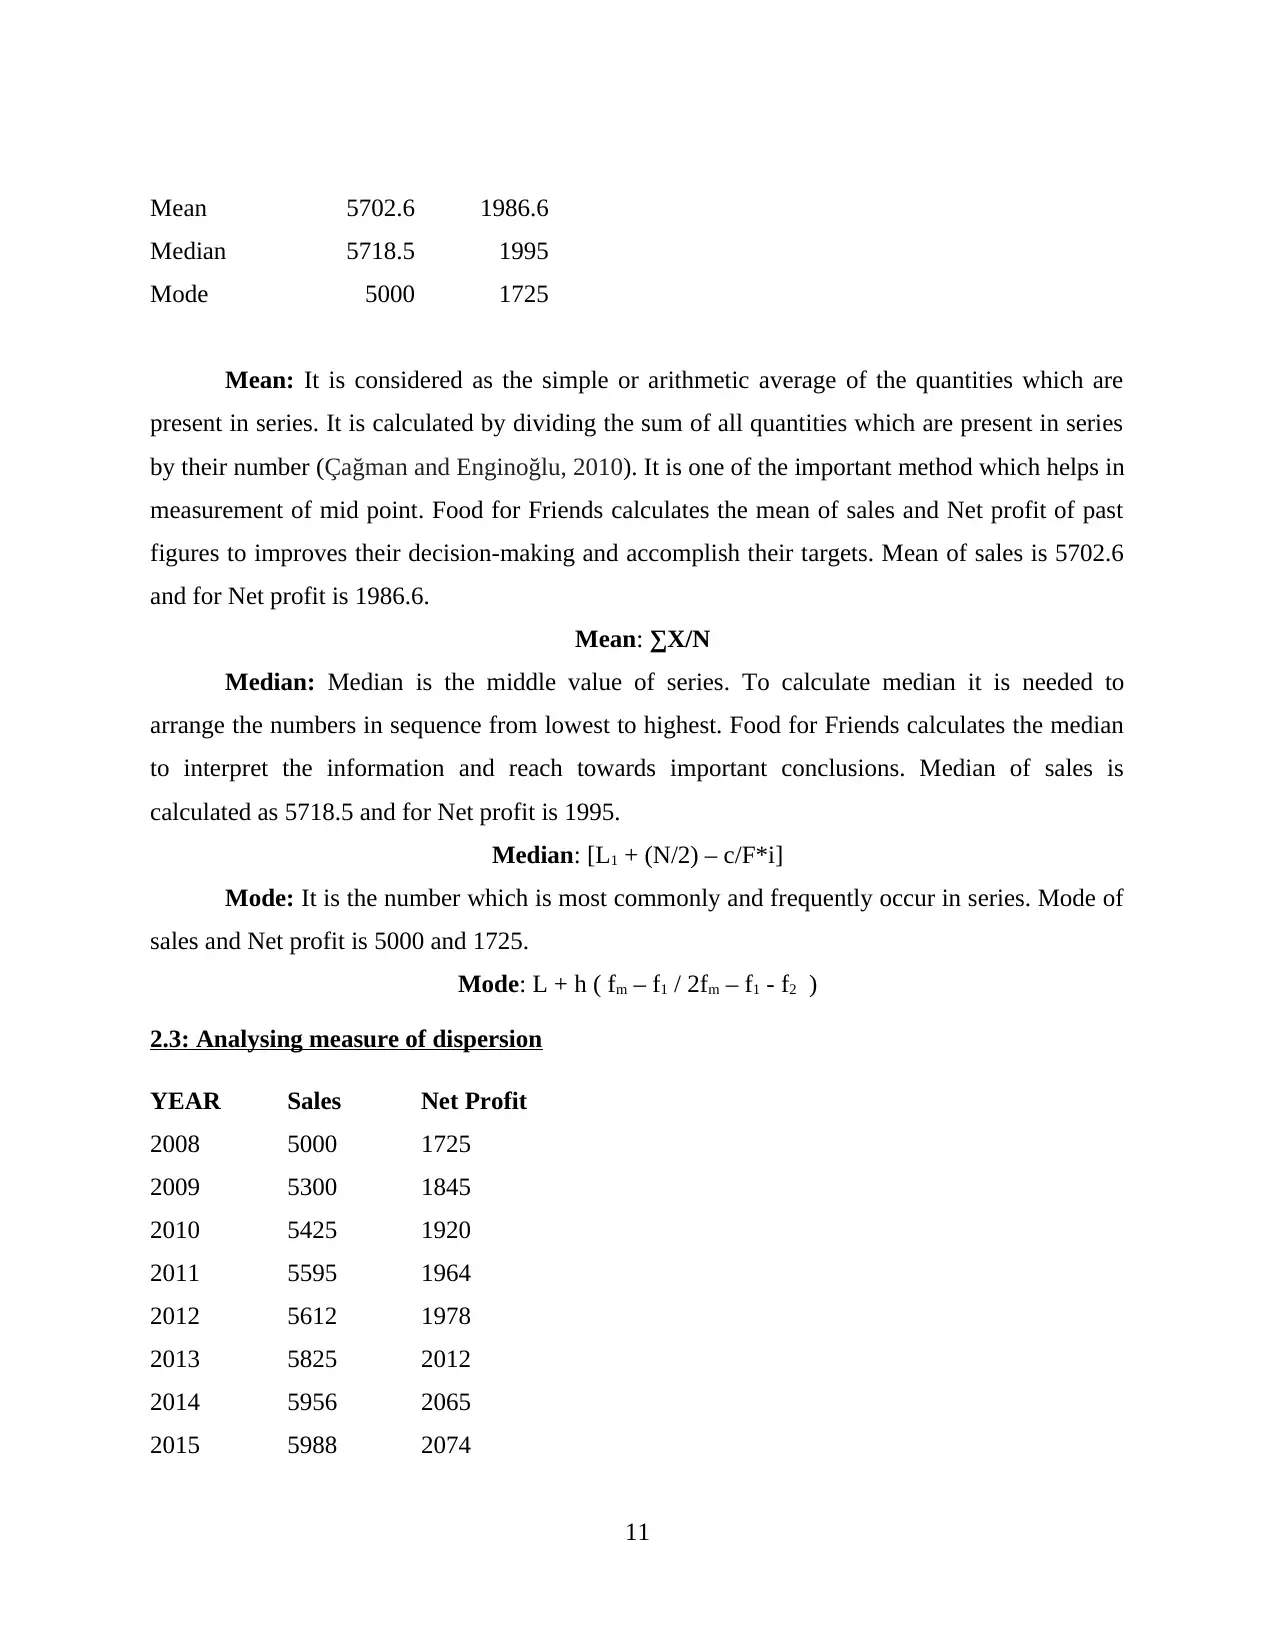
Mean 5702.6 1986.6
Median 5718.5 1995
Mode 5000 1725
Mean: It is considered as the simple or arithmetic average of the quantities which are
present in series. It is calculated by dividing the sum of all quantities which are present in series
by their number (Çağman and Enginoğlu, 2010). It is one of the important method which helps in
measurement of mid point. Food for Friends calculates the mean of sales and Net profit of past
figures to improves their decision-making and accomplish their targets. Mean of sales is 5702.6
and for Net profit is 1986.6.
Mean: ∑X/N
Median: Median is the middle value of series. To calculate median it is needed to
arrange the numbers in sequence from lowest to highest. Food for Friends calculates the median
to interpret the information and reach towards important conclusions. Median of sales is
calculated as 5718.5 and for Net profit is 1995.
Median: [L1 + (N/2) – c/F*i]
Mode: It is the number which is most commonly and frequently occur in series. Mode of
sales and Net profit is 5000 and 1725.
Mode: L + h ( fm – f1 / 2fm – f1 - f2 )
2.3: Analysing measure of dispersion
YEAR Sales Net Profit
2008 5000 1725
2009 5300 1845
2010 5425 1920
2011 5595 1964
2012 5612 1978
2013 5825 2012
2014 5956 2065
2015 5988 2074
11
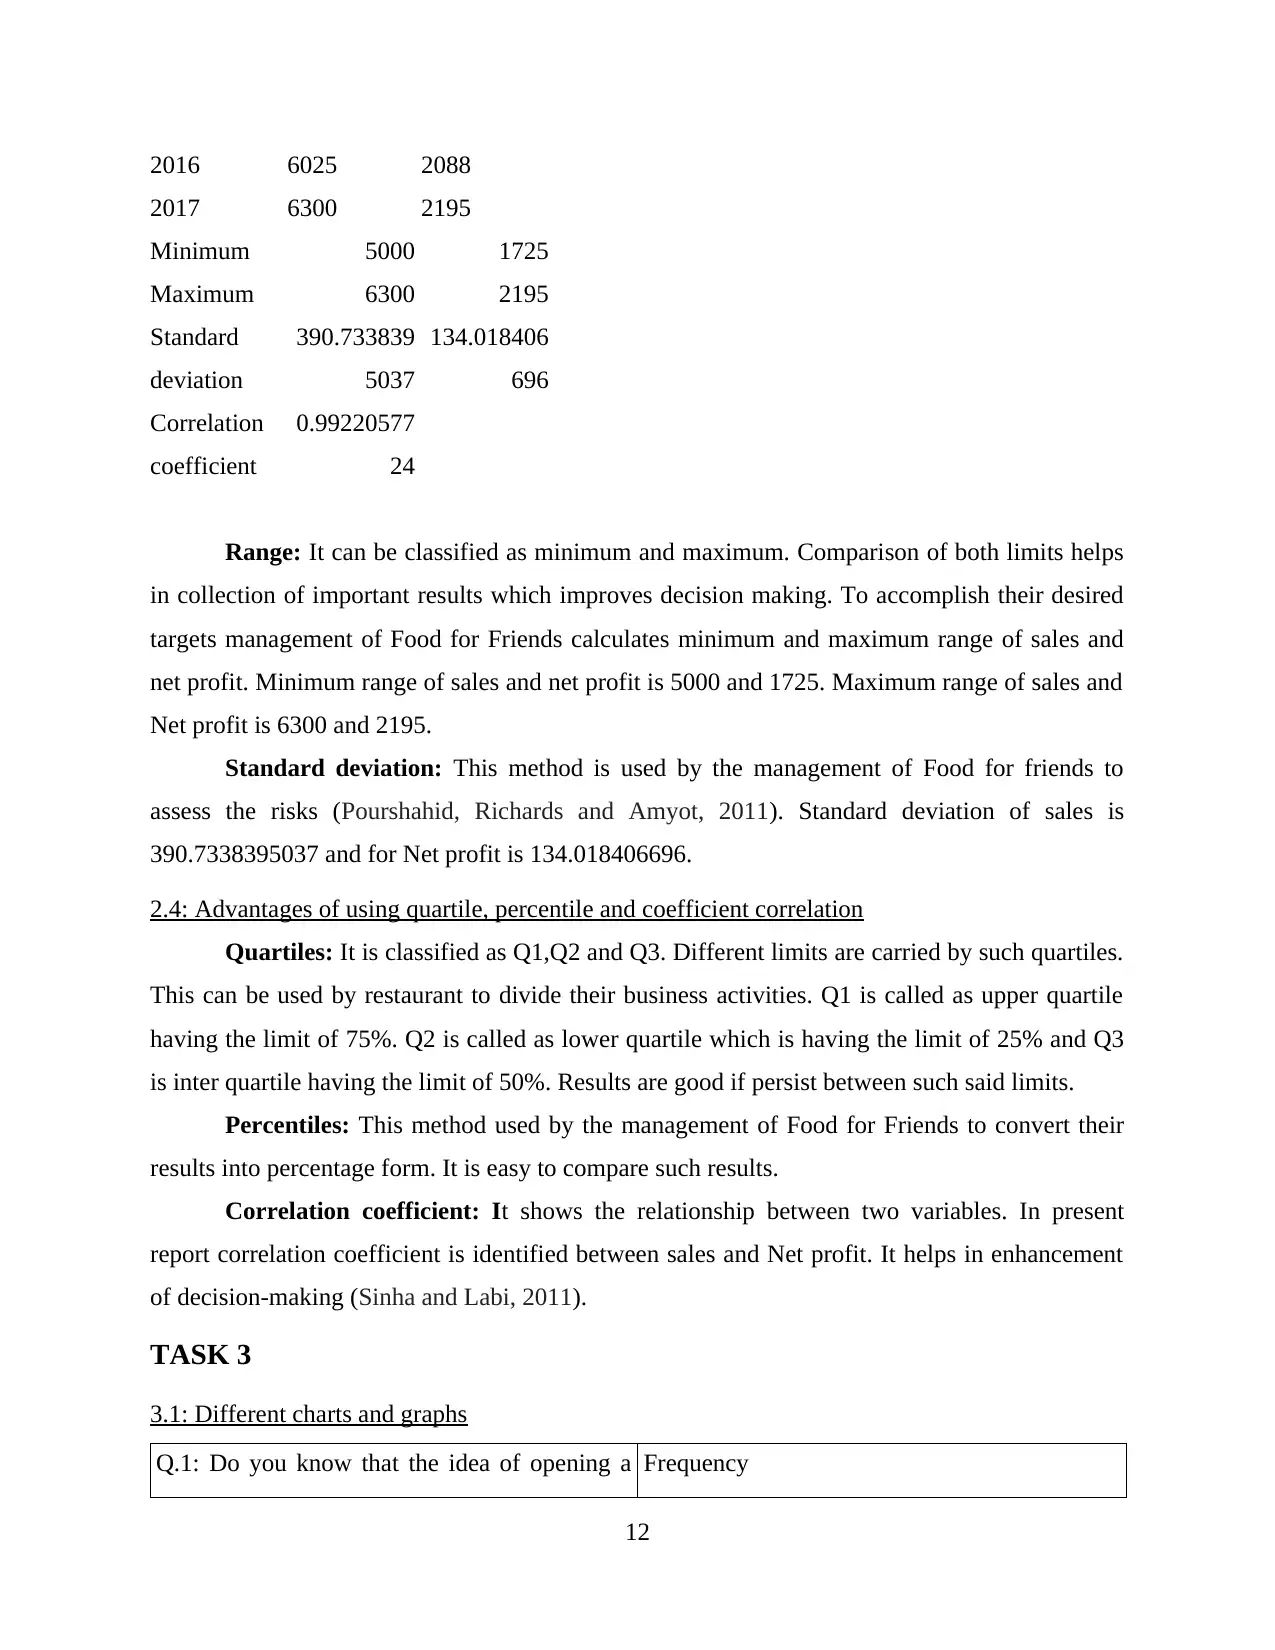
2016 6025 2088
2017 6300 2195
Minimum 5000 1725
Maximum 6300 2195
Standard
deviation
390.733839
5037
134.018406
696
Correlation
coefficient
0.99220577
24
Range: It can be classified as minimum and maximum. Comparison of both limits helps
in collection of important results which improves decision making. To accomplish their desired
targets management of Food for Friends calculates minimum and maximum range of sales and
net profit. Minimum range of sales and net profit is 5000 and 1725. Maximum range of sales and
Net profit is 6300 and 2195.
Standard deviation: This method is used by the management of Food for friends to
assess the risks (Pourshahid, Richards and Amyot, 2011). Standard deviation of sales is
390.7338395037 and for Net profit is 134.018406696.
2.4: Advantages of using quartile, percentile and coefficient correlation
Quartiles: It is classified as Q1,Q2 and Q3. Different limits are carried by such quartiles.
This can be used by restaurant to divide their business activities. Q1 is called as upper quartile
having the limit of 75%. Q2 is called as lower quartile which is having the limit of 25% and Q3
is inter quartile having the limit of 50%. Results are good if persist between such said limits.
Percentiles: This method used by the management of Food for Friends to convert their
results into percentage form. It is easy to compare such results.
Correlation coefficient: It shows the relationship between two variables. In present
report correlation coefficient is identified between sales and Net profit. It helps in enhancement
of decision-making (Sinha and Labi, 2011).
TASK 3
3.1: Different charts and graphs
Q.1: Do you know that the idea of opening a Frequency
12
⊘ This is a preview!⊘
Do you want full access?
Subscribe today to unlock all pages.
Trusted by 1+ million students worldwide
1 out of 25
Related Documents


Your All-in-One AI-Powered Toolkit for Academic Success.
+13062052269
info@desklib.com
Available 24*7 on WhatsApp / Email
![[object Object]](/_next/static/media/star-bottom.7253800d.svg)
Unlock your academic potential
Copyright © 2020–2026 A2Z Services. All Rights Reserved. Developed and managed by ZUCOL.