Business Decision Making Report: Analyzing Company Performance Data
VerifiedAdded on 2023/03/31
|13
|334
|176
Report
AI Summary
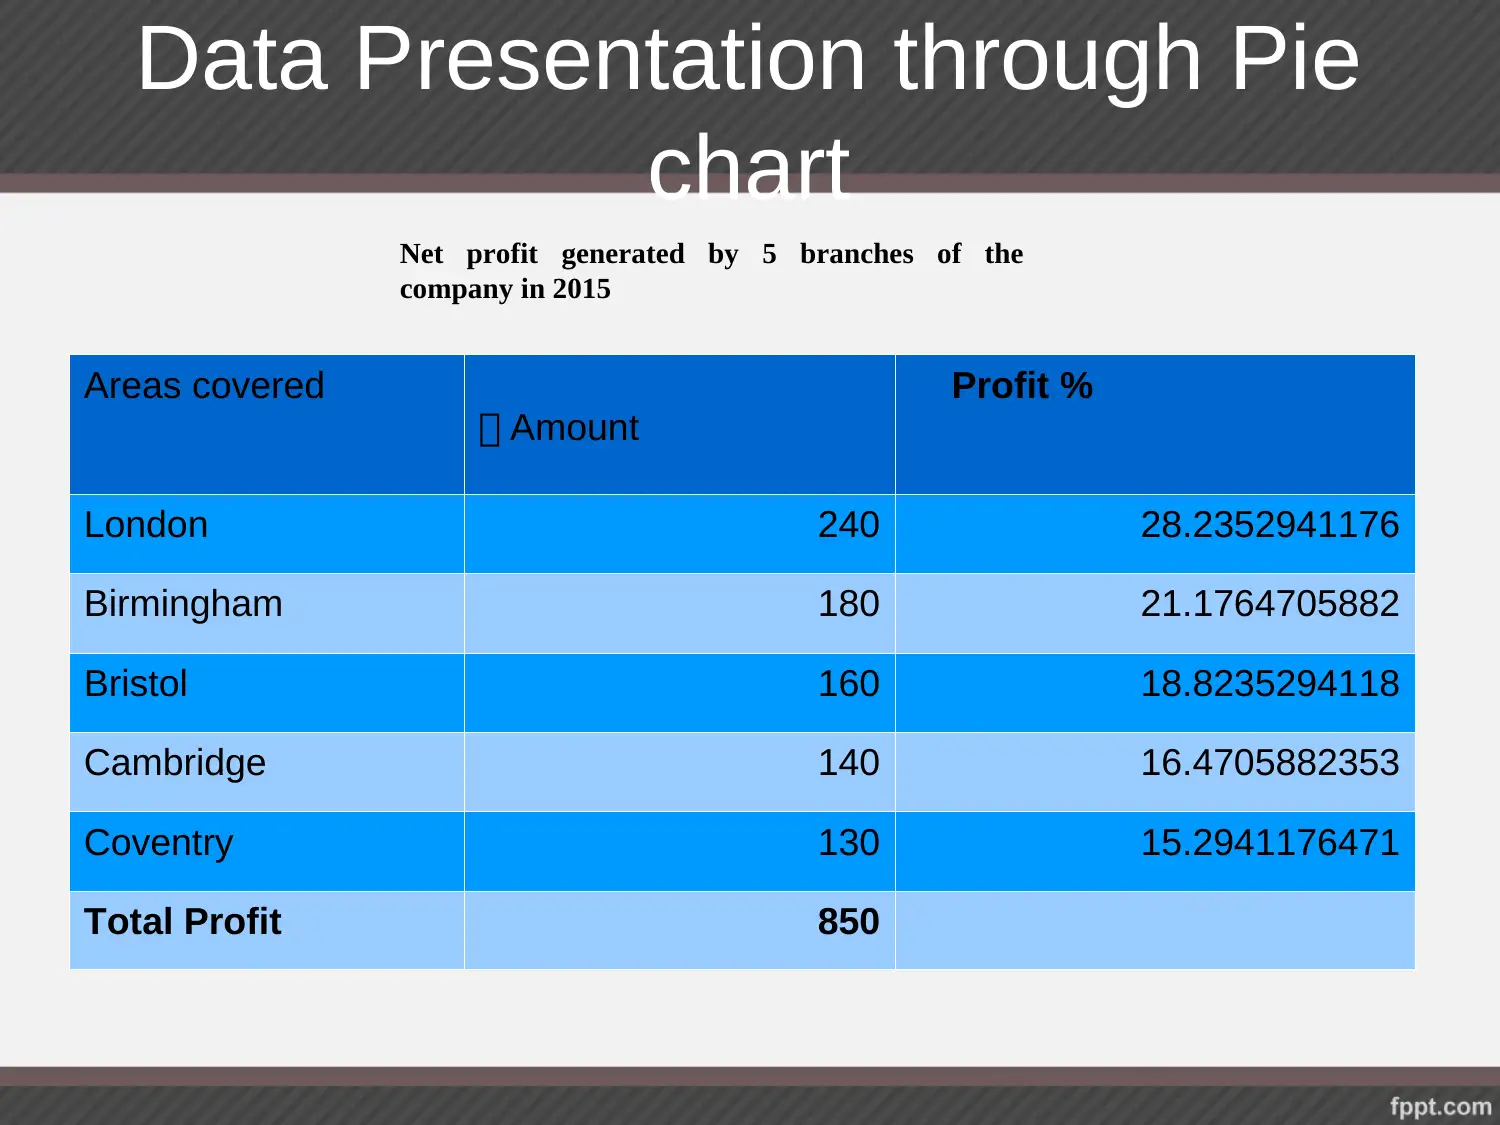
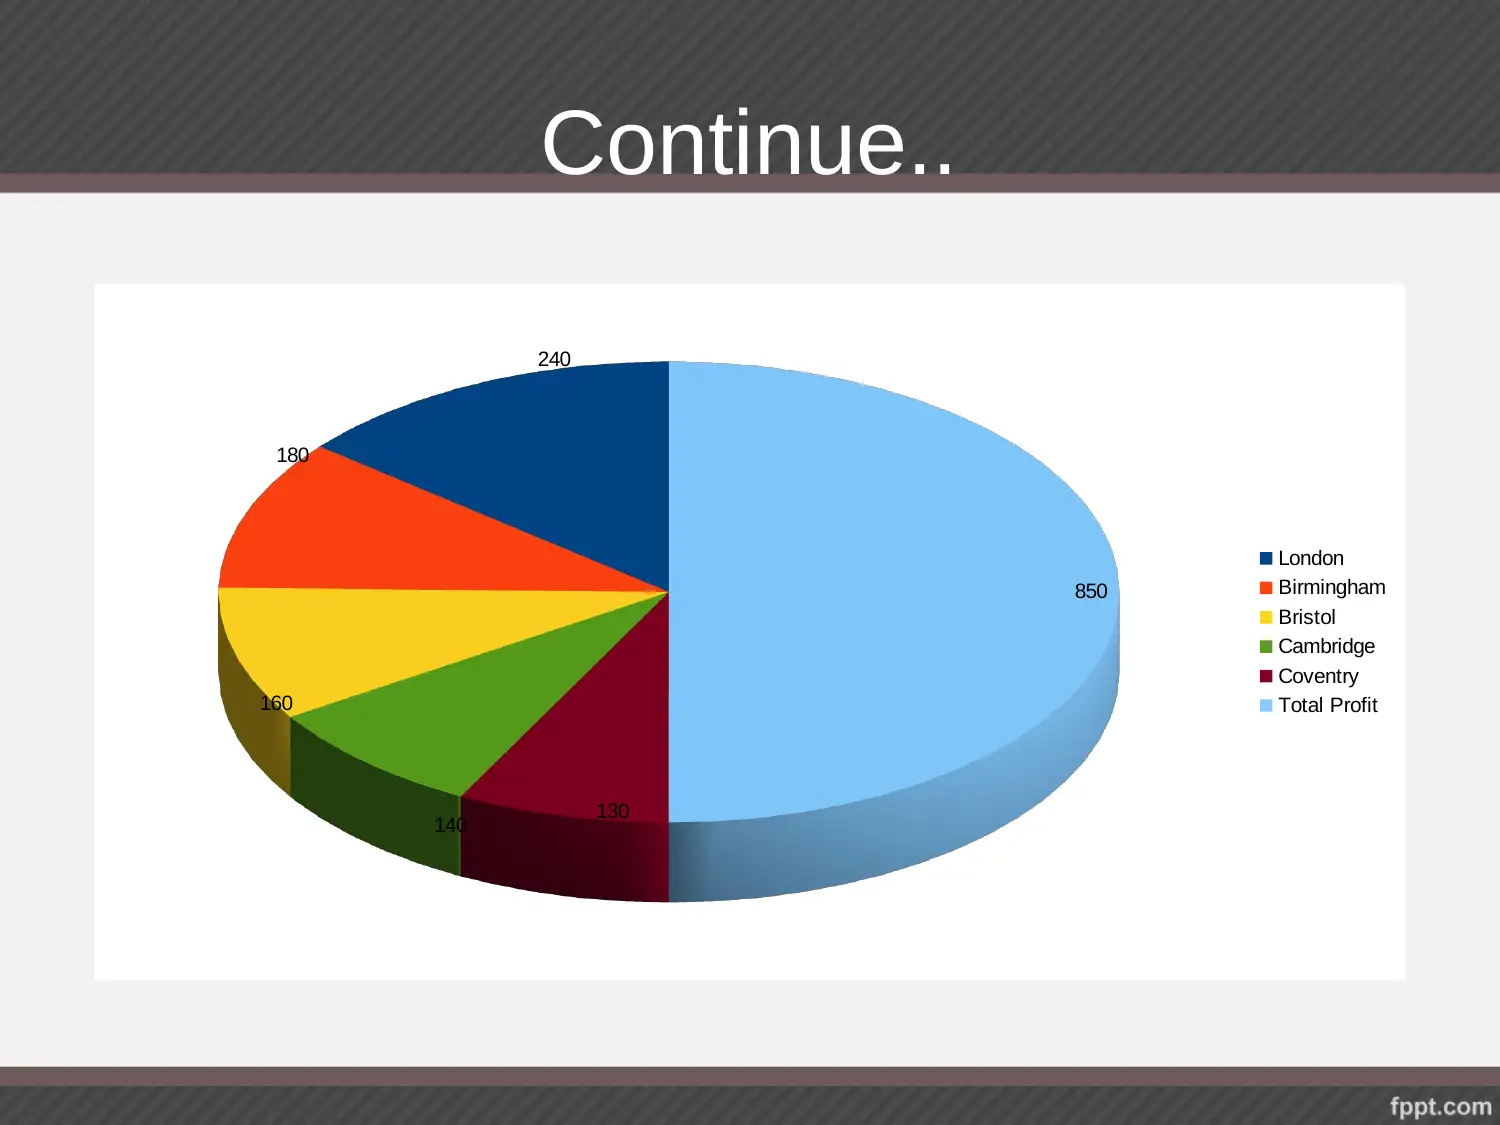
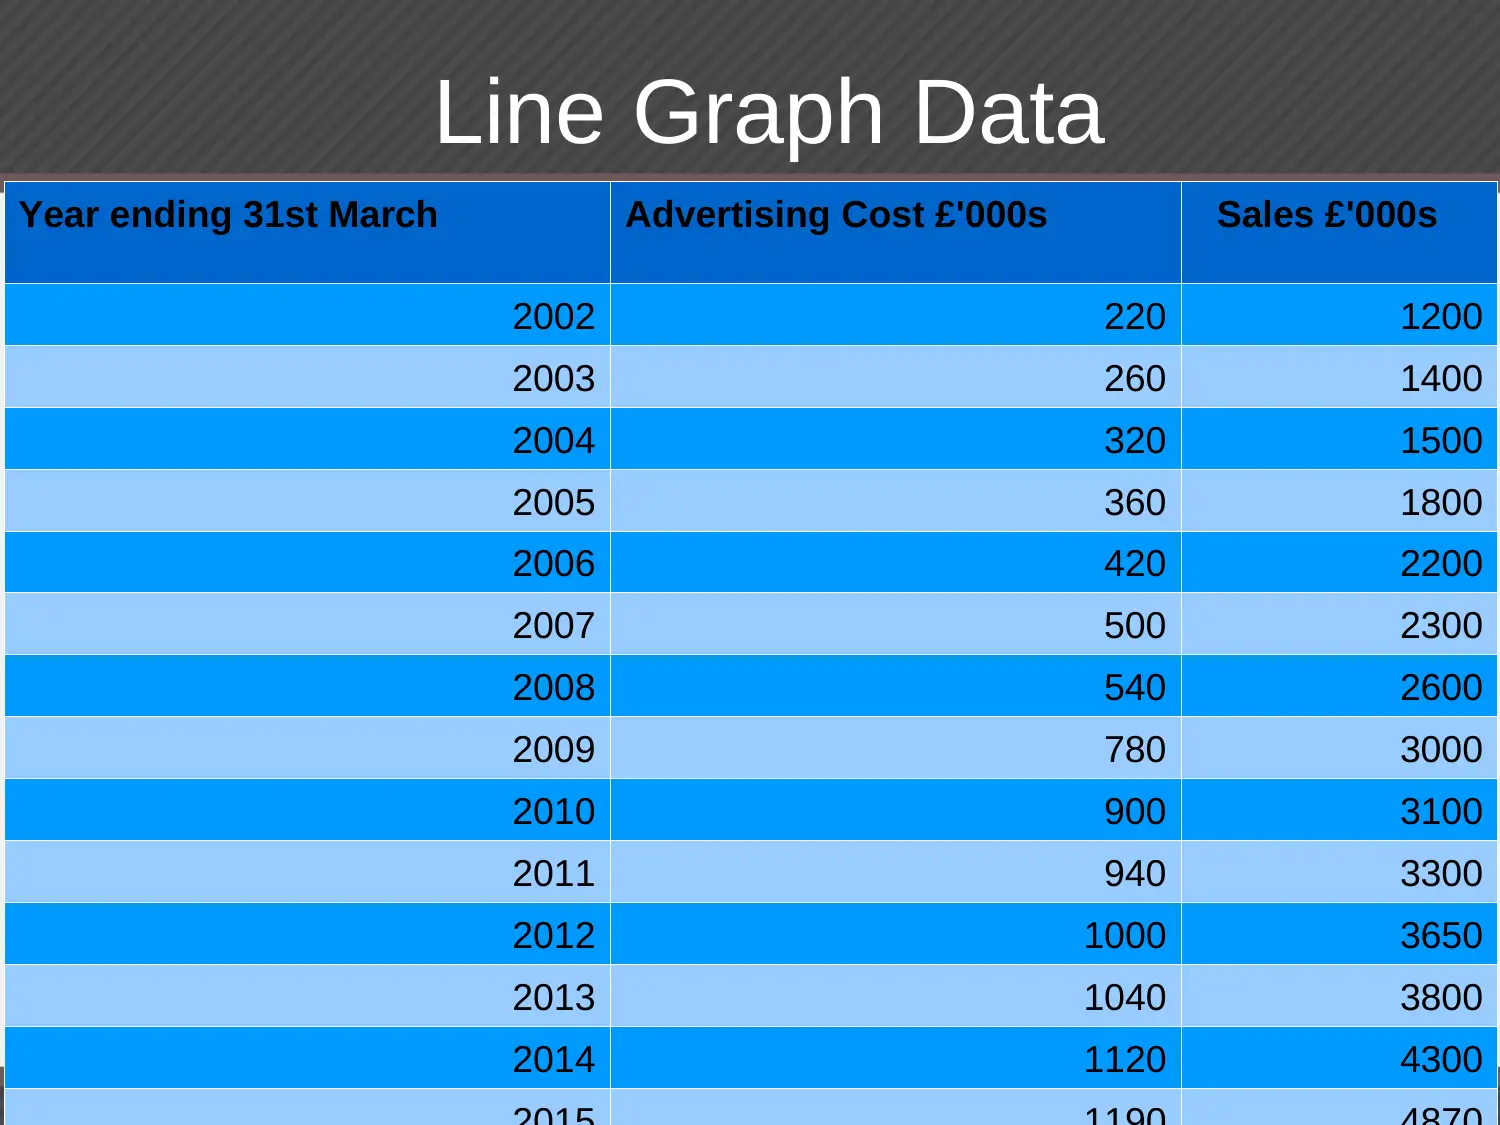
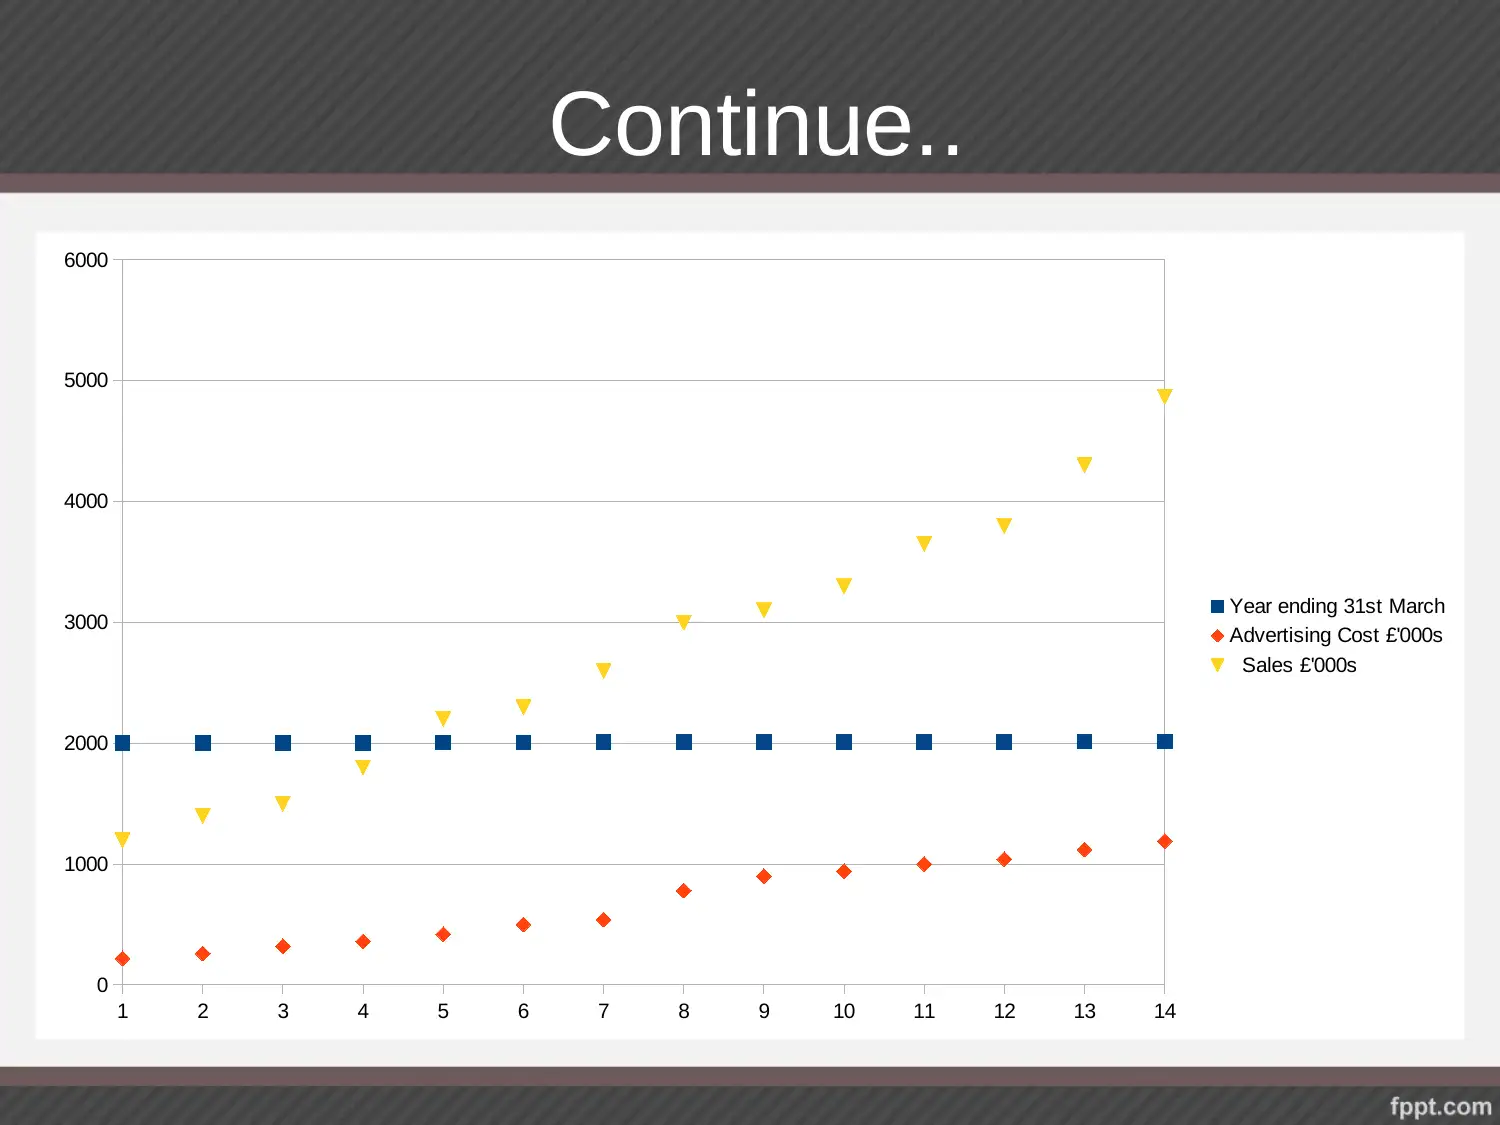
This report provides an analysis of business decision-making, focusing on data presentation and company performance. The report includes an introduction, objectives, and research methodology. Data is presented using pie charts and line graphs, showcasing profit distribution across different company branches and sales trends over time. Key findings highlight that the London branch generates the most profit and that sales increase with advertising costs. The report suggests additional promotional methods and market diversification. References to relevant academic sources support the analysis. This report is a valuable resource for understanding business decision-making processes and analyzing company performance data, and is available on Desklib, a platform offering AI-based study tools.


1 out of 13
Related Documents


Your All-in-One AI-Powered Toolkit for Academic Success.
+13062052269
info@desklib.com
Available 24*7 on WhatsApp / Email
![[object Object]](/_next/static/media/star-bottom.7253800d.svg)
Copyright © 2020–2026 A2Z Services. All Rights Reserved. Developed and managed by ZUCOL.