Business Development: Data Analysis and Interpretation Report, APR22

Verified

Added on  2023/06/10

|13
|1803
|347
Report
AI Summary
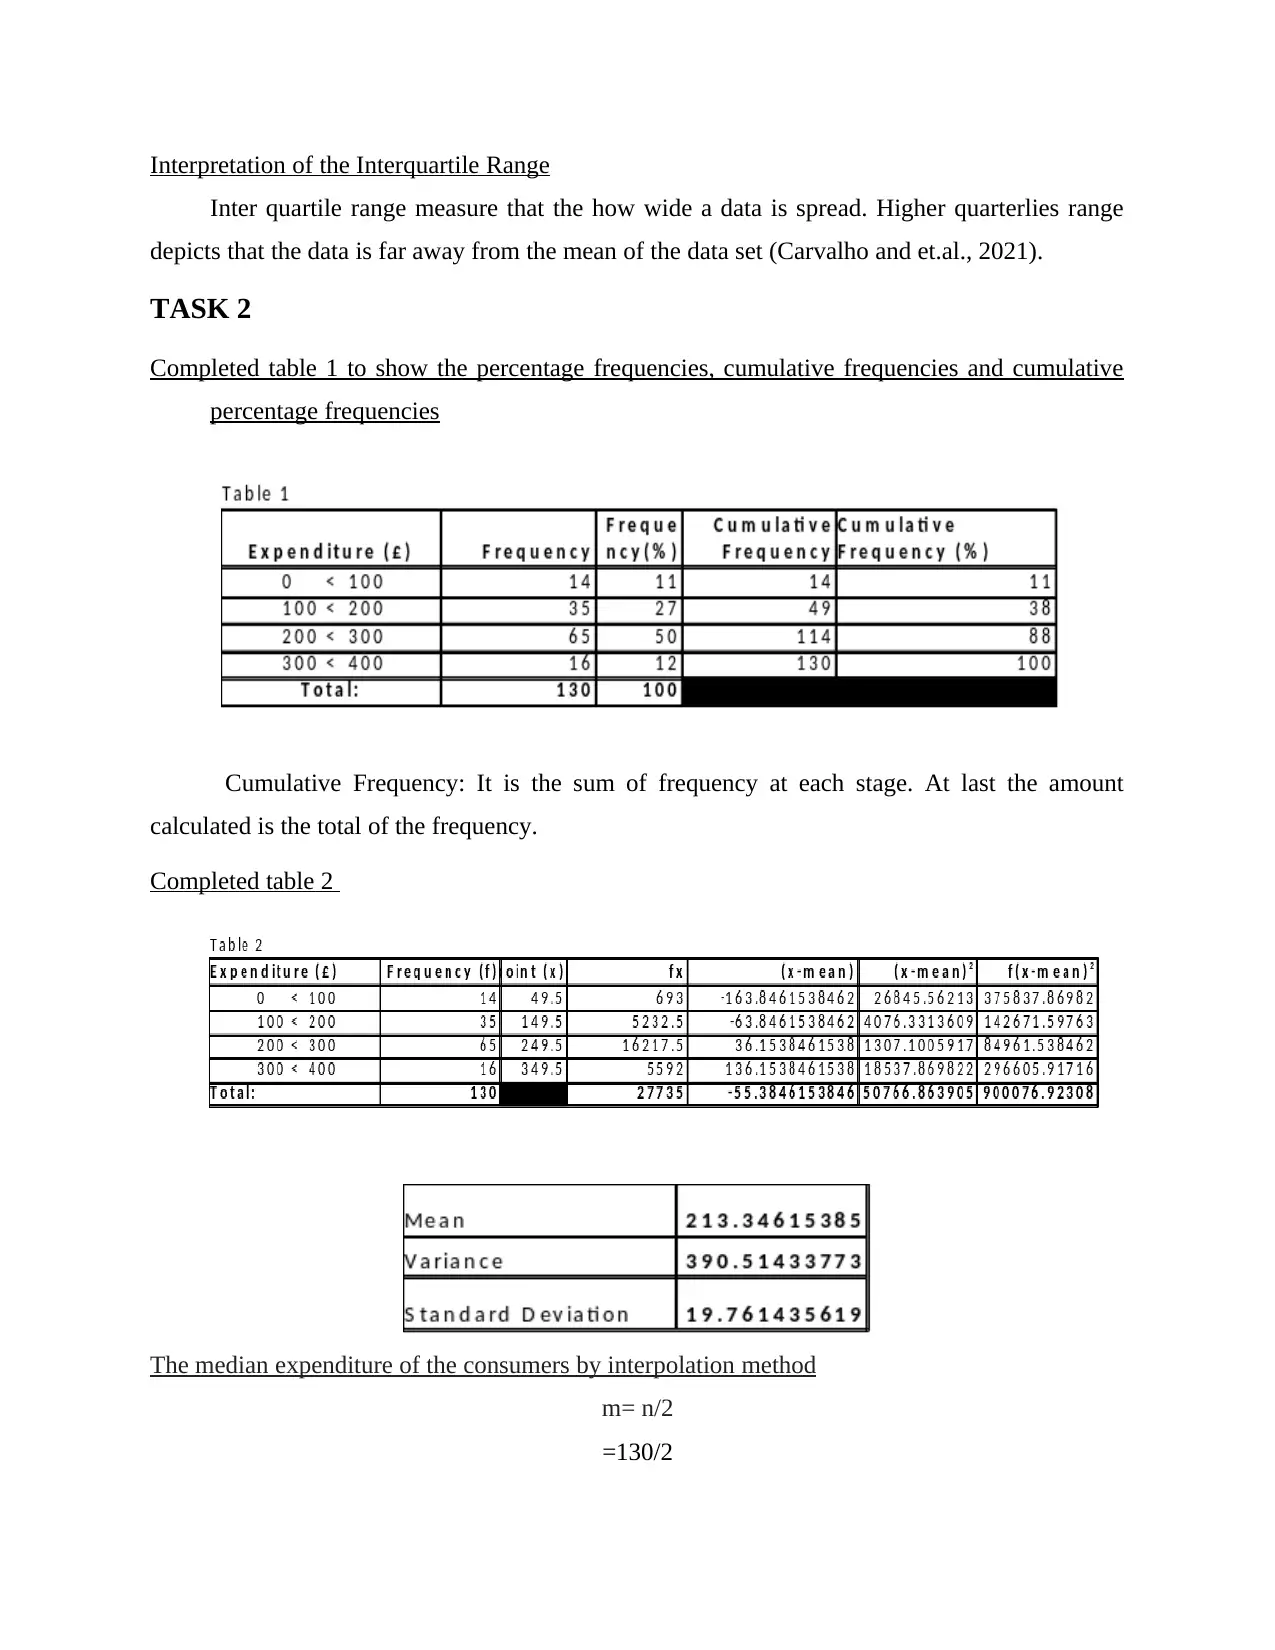
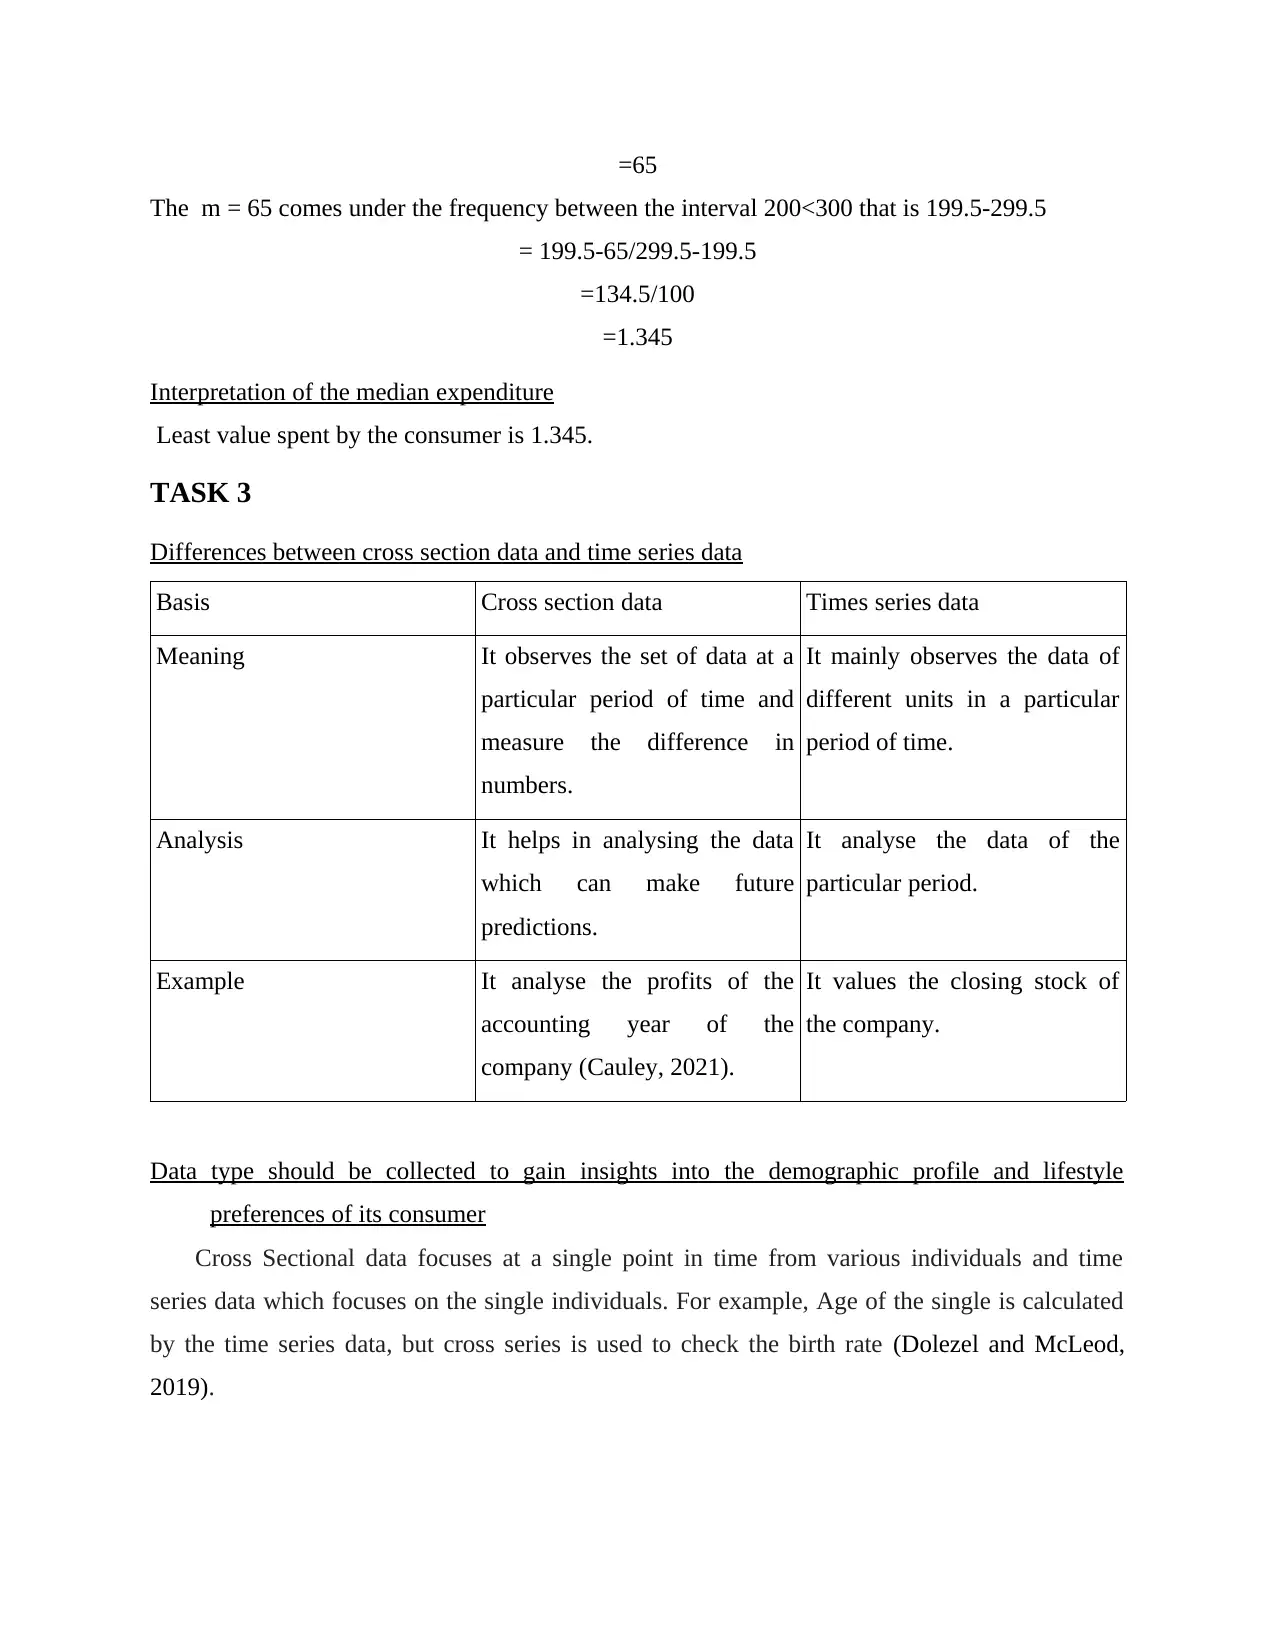
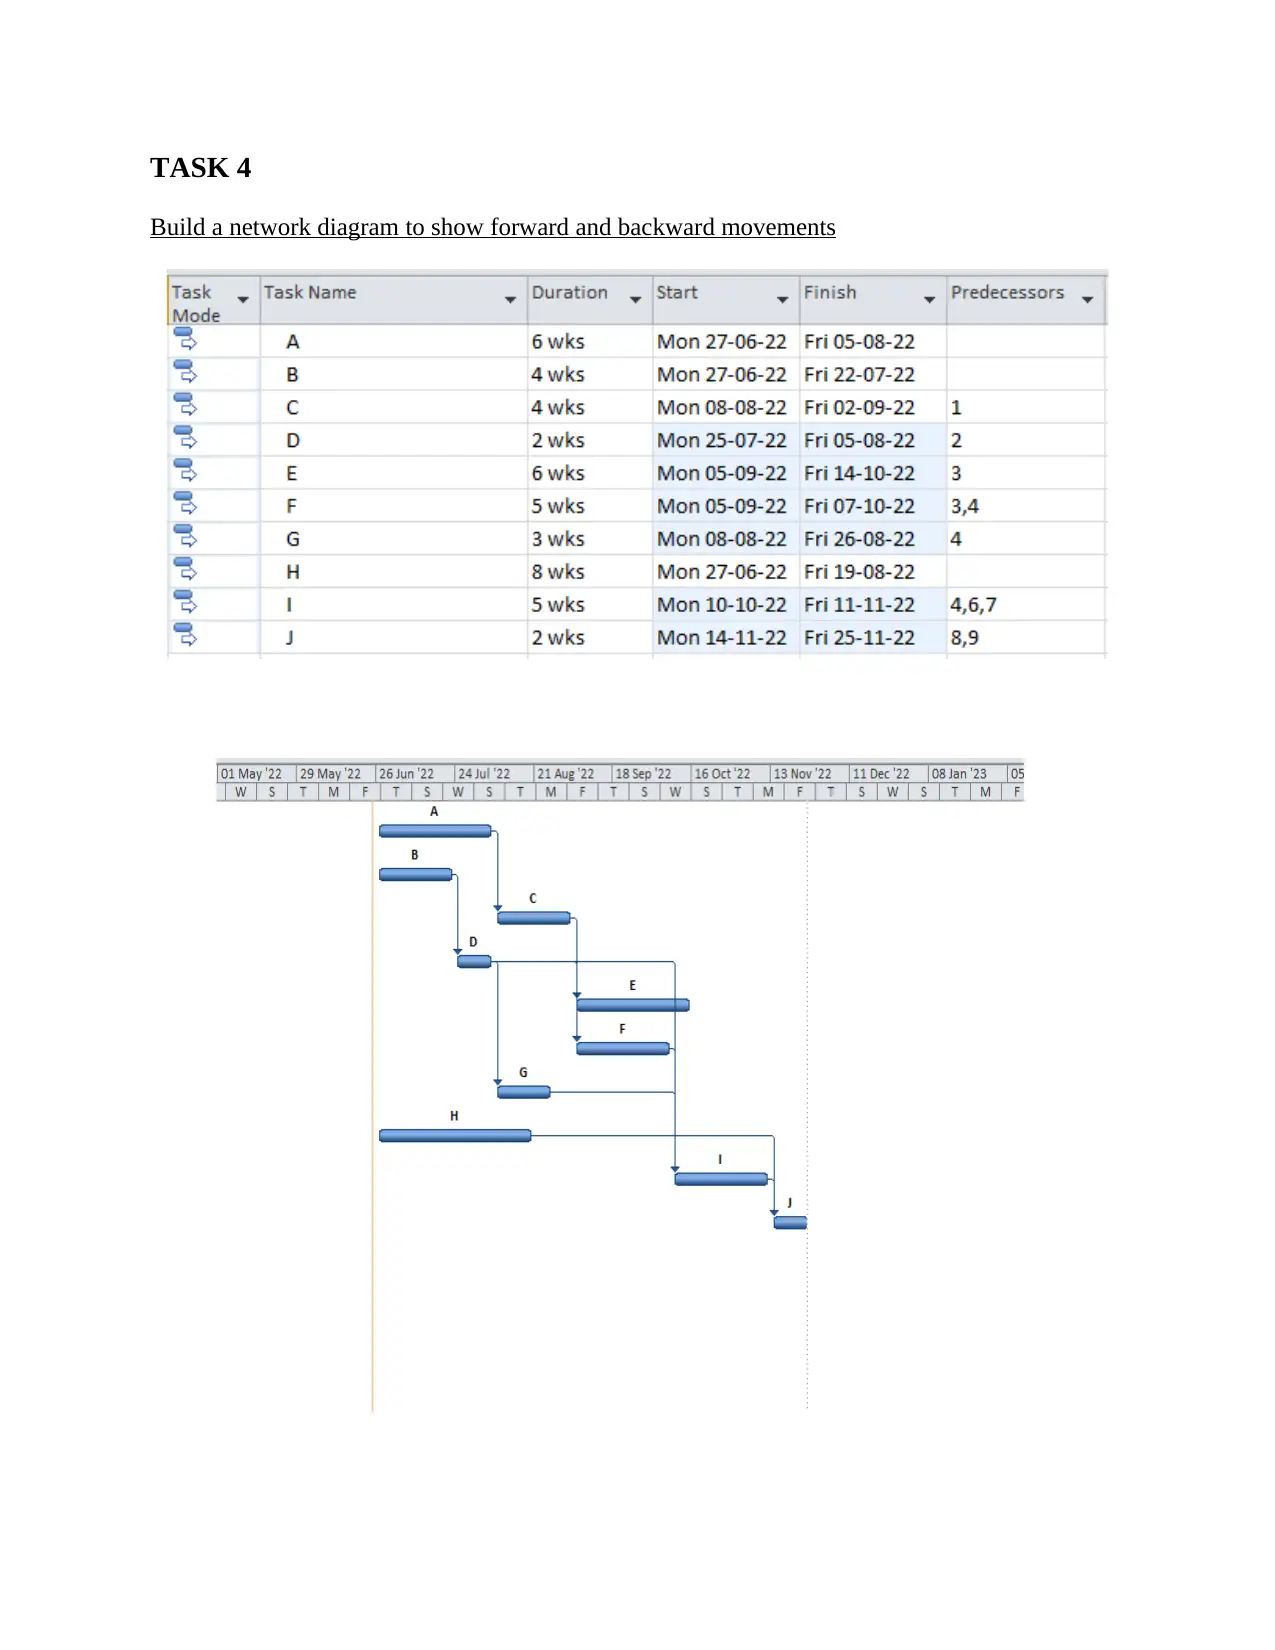
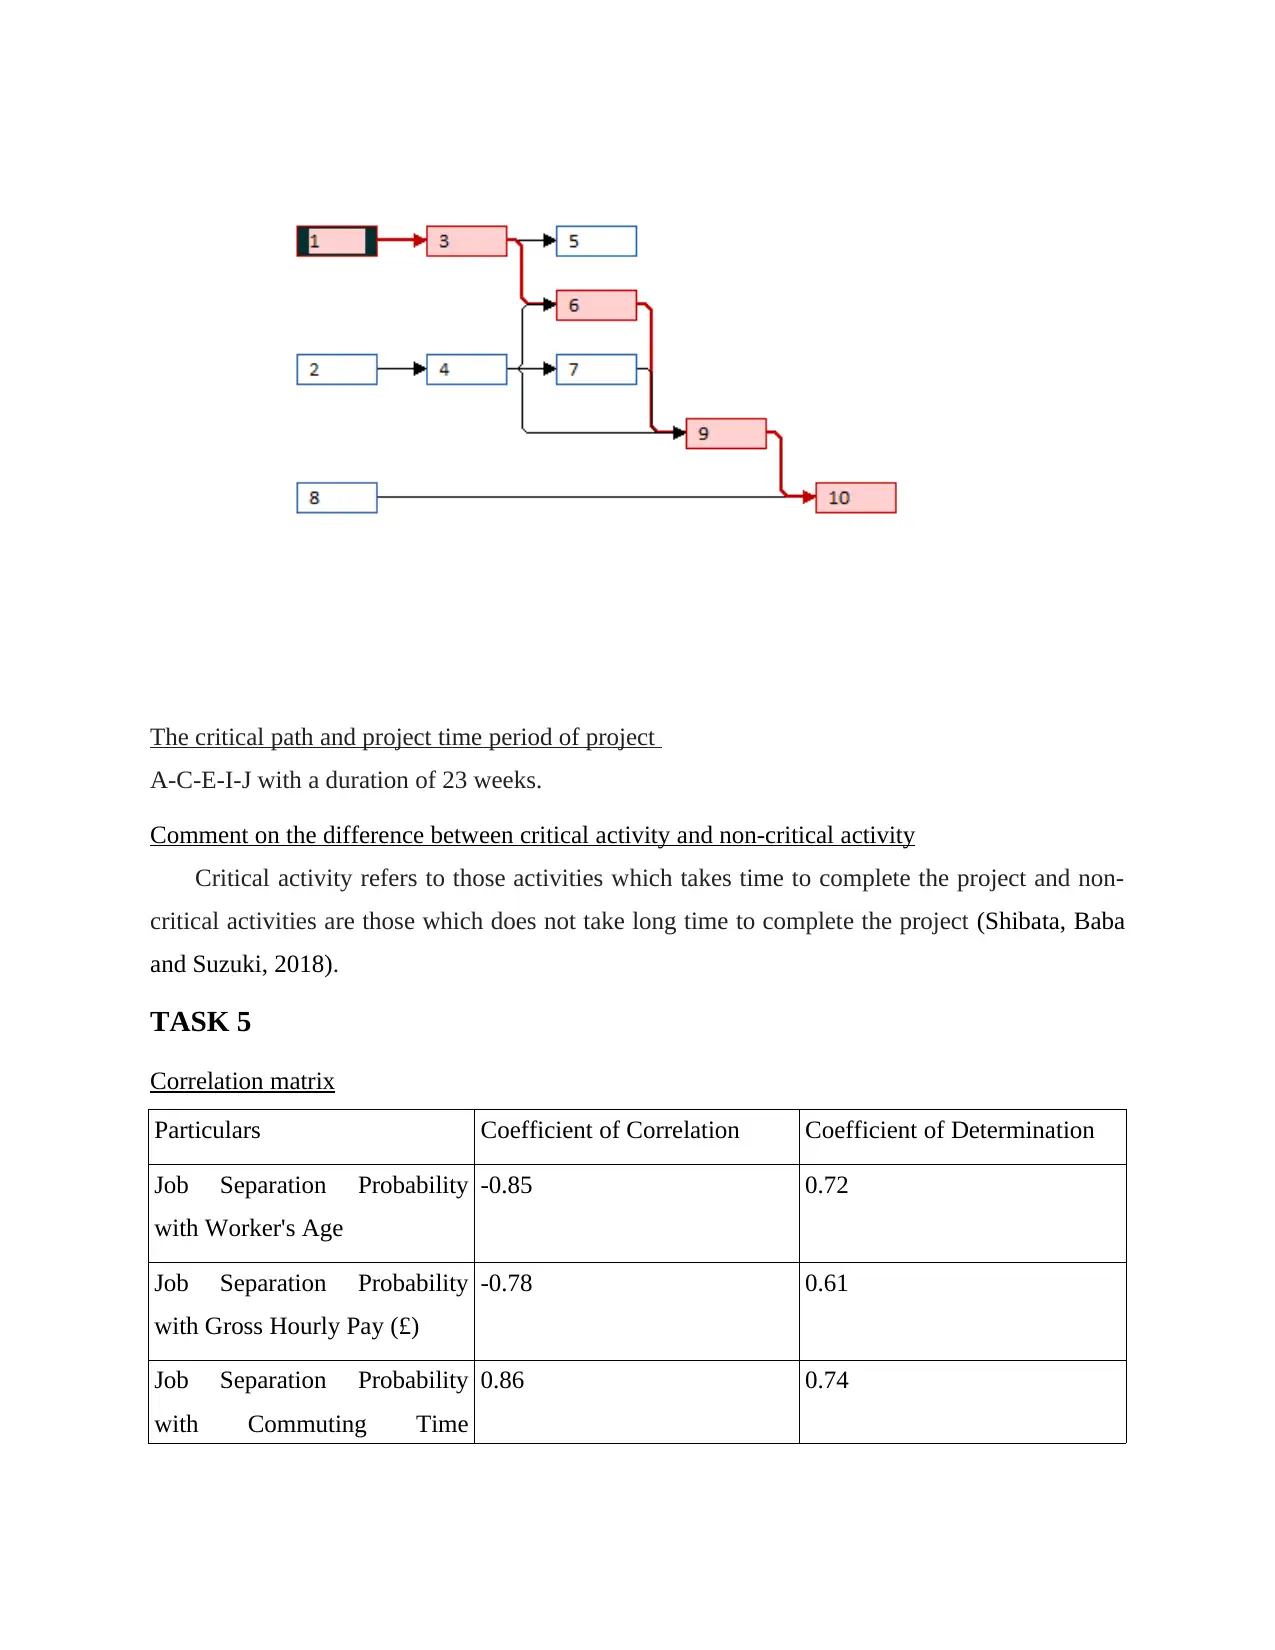
This report presents a comprehensive analysis of data, encompassing various statistical techniques and business applications. It begins with calculations of standard deviation, coefficient of variance, and interquartile range, followed by an interpretation of these measures. The report then differentiates between cross-sectional and time series data, discussing their applications in understanding consumer demographics and preferences. A network diagram is constructed to illustrate project management, highlighting the critical path. Further analysis includes a correlation matrix to identify predictors of job separation and interpretations of correlation and determination coefficients. The report concludes with a financial analysis, calculating variable costs, fixed costs, break-even points, and margin of safety for a T-shirt business, providing recommendations to the sales manager. The report also includes references to relevant academic sources.
tabler-icon-diamond-filled.svg

Contribute Materials

Your contribution can guide someone’s learning journey. Share your documents today.
Document Page
Understanding and
Managing Data APR22
Intake
tabler-icon-diamond-filled.svg

Secure Best Marks with AI Grader

Need help grading? Try our AI Grader for instant feedback on your assignments.
Document Page
Document Page
Table of Contents
MAIN BODY...................................................................................................................................4
TASK 1............................................................................................................................................4
Standard Deviation.................................................................................................................4
Coefficient of variance...........................................................................................................4
Interquartile Range.................................................................................................................4
Interpretation of the Standard Deviation................................................................................4
Interpretation of the Interquartile Range................................................................................5
TASK 2............................................................................................................................................5
Completed table 1 to show the percentage frequencies, cumulative frequencies and cumulative
percentage frequencies...........................................................................................................5
Completed table 2...................................................................................................................5
The median expenditure of the consumers by interpolation method.....................................5
Interpretation of the median expenditure...............................................................................6
TASK 3............................................................................................................................................6
Differences between cross section data and time series data.................................................6
Data type should be collected to gain insights into the demographic profile and lifestyle
preferences of its consumer....................................................................................................6
TASK 4............................................................................................................................................7
Build a network diagram to show forward and backward movements..................................7
The critical path and project time period of project...............................................................8
Comment on the difference between critical activity and non-critical activity......................8
TASK 5............................................................................................................................................8
Correlation matrix..................................................................................................................8
Identify best predictor of Job Separation*(Probability).........................................................9
Interpretation of coefficient of correlation.............................................................................9
Interpretation of coefficient of determination........................................................................9
TASK 6............................................................................................................................................9
PART 2............................................................................................................................................9
Variable cost per T-shirt.........................................................................................................9
Document Page
Monthly fixed cost................................................................................................................10
Break-even point for January 2022......................................................................................10
No. of T-shirts to be sold in order to earn profit of £200,000..............................................10
Margin of Safety for January 2022.......................................................................................10
Advises to the Sales manager of Tvestan Ltd......................................................................11
REFERENCES..............................................................................................................................12
tabler-icon-diamond-filled.svg

Secure Best Marks with AI Grader

Need help grading? Try our AI Grader for instant feedback on your assignments.
Document Page
MAIN BODY
TASK 1
Standard Deviation
= (maximum range – minimum range)/4
= (369-68)4
=£75.25
Coefficient of variance
= Standard deviation/ mean
= 75.25/224*100
=33.60 %
Interquartile Range
= Upper Quartile- lower quartile
=336-112
=224
Interpretation of the Standard Deviation
Standard Deviation calculates the variance in the data set which depicts the difference in
the value of the available data set, from the mean value of the data set.
Document Page
Interpretation of the Interquartile Range
Inter quartile range measure that the how wide a data is spread. Higher quarterlies range
depicts that the data is far away from the mean of the data set (Carvalho and et.al., 2021).
TASK 2
Completed table 1 to show the percentage frequencies, cumulative frequencies and cumulative
percentage frequencies
Cumulative Frequency: It is the sum of frequency at each stage. At last the amount
calculated is the total of the frequency.
Completed table 2
The median expenditure of the consumers by interpolation method
m= n/2
=130/2
Document Page
=65
The m = 65 comes under the frequency between the interval 200<300 that is 199.5-299.5
= 199.5-65/299.5-199.5
=134.5/100
=1.345
Interpretation of the median expenditure
Least value spent by the consumer is 1.345.
TASK 3
Differences between cross section data and time series data
Basis Cross section data Times series data
Meaning It observes the set of data at a
particular period of time and
measure the difference in
numbers.
It mainly observes the data of
different units in a particular
period of time.
Analysis It helps in analysing the data
which can make future
predictions.
It analyse the data of the
particular period.
Example It analyse the profits of the
accounting year of the
company (Cauley, 2021).
It values the closing stock of
the company.
Data type should be collected to gain insights into the demographic profile and lifestyle
preferences of its consumer
Cross Sectional data focuses at a single point in time from various individuals and time
series data which focuses on the single individuals. For example, Age of the single is calculated
by the time series data, but cross series is used to check the birth rate (Dolezel and McLeod,
2019).
tabler-icon-diamond-filled.svg

Paraphrase This Document

Need a fresh take? Get an instant paraphrase of this document with our AI Paraphraser
Document Page
TASK 4
Build a network diagram to show forward and backward movements
Document Page
The critical path and project time period of project
A-C-E-I-J with a duration of 23 weeks.
Comment on the difference between critical activity and non-critical activity
Critical activity refers to those activities which takes time to complete the project and non-
critical activities are those which does not take long time to complete the project (Shibata, Baba
and Suzuki, 2018).
TASK 5
Correlation matrix
Particulars Coefficient of Correlation Coefficient of Determination
Job Separation Probability
with Worker's Age
-0.85 0.72
Job Separation Probability
with Gross Hourly Pay (£)
-0.78 0.61
Job Separation Probability
with Commuting Time
0.86 0.74
Document Page
(Minutes)
Job Separation Probability
with Average Weekly Hours of
Work
-0.18 0.03
Identify best predictor of Job Separation*(Probability)
According to the correlation matrix, predictor of job separation is the commuting time
whose value is 0.86 which is above the matrix. It suggests that it is highly correlated with Job
Separation Probability.
Interpretation of coefficient of correlation
Coefficient of correlation states the relationship between one variable with the other variable
(Tucker, 2020).
Interpretation of coefficient of determination
It shows the variability of one factor with the other factor and how it is affected.
TASK 6
This project aid in enhancing and understanding the analytical skills. This assignment has
various parts which test the analytical skills as well as the calculation efficiency. It includes
monthly foxed cost, variable cost, margin of safety and breakeven point. The most challenging
part in the TASK 2 is the median expenditure of the consumer which is calculation by using
interpolation method. It helps in further studying the insights of the methods and knowing the
outcomes of the methods. I need to focus on the business and financial management concepts
which will help in commanding over the subject.
PART 2
Variable cost per T-shirt
Using the High-Low method, estimated variable cost per T-shirt produced and sold can
be calculated as follows:
= (Highest total cost-Lowest total cost)/(highest total sales unit- Lowest total sales unit)
= (370000-150000)/ (35000-13000)
=220000/22000
tabler-icon-diamond-filled.svg

Secure Best Marks with AI Grader

Need help grading? Try our AI Grader for instant feedback on your assignments.
Document Page
=10 per T-shirt.
Monthly fixed cost
Same as above using the High-Low method, fixed cost can be calculated as follows:
=Highest total cost- (variable cost * highest sales units)
=370000 – (10*35000)
=20000.
or it can be also calculated as follows:
=Lowest total cost – (variable cost * lowest sales units)
=150000 – (10*13000)
=£20000.
Break-even point for January 2022
Break even sales units can be calculated as by using the formula below:
=Fixed cost / (Sale price per T-shirt- variable cost per T-shirt)
=20000/ (20-10)
=2000 T-shirts.
Hence, Tvestan Ltd should produce and sell 2000 T-shirts in January 2022 to get at break-even
point.
No. of T-shirts to be sold in order to earn profit of £200,000
The number of T-shirts should produce and sell by the company to achieve a profit of
£200,000 in January 2022 can be calculated as under:
= (£200,000 + £200,00)/ (20-10)
=22000T-Shirts.
Therefore, Tvestan Ltd should produce and sell 22000 T-Shirts to earn a profit of £200,000 in the
January 2022.
Margin of Safety for January 2022
Margin of Safety for January 2022 can be calculated as under assuming that the profit
target has been achieved by the company:
Margin of Safety in percentage = (sales units for the month – break-even sales units for the
month)/sales units for the month * 100
= (22000-2000)/22000*100
Document Page
=91%.
It can also be expressed in pound and units as well.
Margin of safety in pound = Total sales in January 2022 – Total Break-even sales in January
2022
=£440000 - £40000
=£400000.
Margin of safety in Units = Sales units in January 2022 – Break-even sales point in January 2022
=22000-2000
=20000 T-shirt.
Advises to the Sales manager of Tvestan Ltd
(I) The method followed is the appropriate method for calculating the variable cost and its
findings which is not properly mentioned in the given situation. In the such case, it is the best
method to determine the different cost of the company (Ye, Jiao and Yan, 2020).
(II) High margin safety ratio for the month of January 2022 of Tvestan Ltd shows that the
organisation is earning a significant amount of profits above the breakeven point of company.
(III) Break even Analysis helps in determining the no. of products that are required to sell to
reach a stage where there is no profit or loss for the company.
Document Page
REFERENCES
Books and Journals
Beier, K.M., 2021. Managing paraphilic interests in the community: An international
perspective. Sexual deviance: Understanding and managing deviant sexual interests
and paraphilic disorders, pp.268-281.
Carvalho, A. and et.al., 2021. When good blocks go bad: Managing unwanted blockchain
data. International Journal of Information Management, 57, p.102263.
Cauley, M.R., 2021. Person in Process of Practice: Between helping and managing helping.
In Academy of Management Proceedings (Vol. 2021, No. 1, p. 13550). Briarcliff
Manor, NY 10510: Academy of Management.
Colasse, V., Posseme, B., Philippe, M.H., Picard, L. and Guiet, S., 2019. Collaborative approach
for understanding and agriculturally managing wet grasslands in Brittany: exploiting a
network of" reference farms". Fourrages, (237), pp.33-40.
Dolezel, D. and McLeod, A., 2019. Managing security risk: modeling the root causes of data
breaches. The Health Care Manager, 38(4), pp.322-330.
Shibata, T., Baba, Y. and Suzuki, J., 2018. Managing Exploration Processes for New Business-
The Successes and Failures of Fujifilm and Kodak (No. 83). Graduate School of
Economics and Management, Tohoku University.
Tucker, O.M., 2020. Understanding the risks and challenges of shell companies in managing
AML compliance. Journal of Financial Compliance, 3(4), pp.340-358.
Ye, Y., Jiao, W. and Yan, H., 2020. Managing relief inventories responding to natural disasters:
Gaps between practice and literature. Production and Operations Management, 29(4),
pp.807-832.
chevron_up_icon
1 out of 13
circle_padding
hide_on_mobile
zoom_out_icon
logo.png

Your All-in-One AI-Powered Toolkit for Academic Success.

Available 24*7 on WhatsApp / Email

[object Object]