Business Decision Making Report - Module: Business Decision Making
VerifiedAdded on 2020/07/22
|16
|4174
|53
Report
AI Summary
This report focuses on business decision-making for Blackfriars Restaurant, which is planning to open a new restaurant in London. It details the process of gathering primary and secondary data, including survey methodologies, sampling frames, and questionnaire design. The report includes data summarization, analysis using measures of central tendency and dispersion, and the utilization of quartiles, percentiles, and correlation. Furthermore, it incorporates graphs, charts, and trend lines, culminating in a business presentation and formal report. The project also explores the application of information processing tools, critical path analysis, and the calculation of NPV and IRR to support informed business decisions. The report covers data from a survey of 125 customers and analyses their views on food quality, service, and future restaurant plans. The report aims to provide insights for making strategic decisions.

BUSINESS DECISION
MAKING
MAKING
Paraphrase This Document
Need a fresh take? Get an instant paraphrase of this document with our AI Paraphraser
Table of Contents
INTRODUCTION...........................................................................................................................1
TASK1.............................................................................................................................................1
1.1 Plan for gathering of primary as well as secondary data .................................................1
1.2 Methodology for survey and sampling frame used ........................................................2
1.3 Questionnaire for gathering of data..................................................................................2
2.1 Creation of information and summarising of collected data ...........................................4
2.2 Analysation of result by using measurements of central tendency..................................6
2.3 Analysation of results by using measures of dispersion...................................................6
2.4 Utilisation of quartile, percentile and Correlation in process of decision making...........7
TASK 2 ...........................................................................................................................................8
3.1 Incorporation of graphs and some charts..........................................................................8
3.2 Trend line..........................................................................................................................9
3.3 Business presentation.....................................................................................................10
3.4 Formal business report ..................................................................................................10
TASK3...........................................................................................................................................11
4.1 Utilisation of information processing tools....................................................................11
4.2 Critical path....................................................................................................................12
4.3 Calculation of NPV and IRR..........................................................................................12
CONCLUSION..............................................................................................................................13
REFERENCES..............................................................................................................................14
INTRODUCTION
Decision making is considered as one of the most important part of a business
organisation. If play significant role in success or failure of a company. Earlier enterprises did
not take focus too much on statistical data but now they consider various trends and conduct
different types of analyses. Blackfriars Restaurant is operating in Newcastle and they are
planning to open another restaurant in London. This project will discuss about planning of
primary and secondary data which is necessary for solving a problem. Various survey
methodology, sampling frame and questionnaire will also become part of this report. Use of
quartile, percentile and coefficient is included in this file, spreadsheet and trend lines will get
cover under this assignment (Aronson, Liang and Turban, 2011). This project will discuss about
some financial and processing tool which are important for at the time of decision making.
TASK1
1.1 Plan for gathering of primary as well as secondary data
Information of different areas is crucial for successful operation of a business. If an
organisation want to achieve their set objectives than they have to collect various types of data
that is available in the company, and outside of the enterprise. A good decision can not be made
without having proper knowledge of a matter. A firm have many option relating to tools for
planning. They can chose appropriate technique according to their need and availability of
resources. Their are two types of data, first is primary, which is taken first time, and second is
secondary which is taken from accessible sources like newspapers, internet etc. Following is a
plan for collection of data:
Decision on method – An organisation has various choices so they have to select
something that fits for their enterprise and fulfil their main objectives. Quantitative information
is available in the form of numbers, maths and statistics are considered as its integral part
(Nielsen and Nielsen, 2011). It can be gathered through survey or observation. Qualitative
research is relates to the reason of 'why' & 'How' things are happening. Normally this kind of
content is gathered from conducting interviews or analysing past events. Researchers has to
make a call regarding selection of research which they are going to organise. If they have
essential resources than they can adopt both option.
1
⊘ This is a preview!⊘
Do you want full access?
Subscribe today to unlock all pages.
Trusted by 1+ million students worldwide
Planning for sources – Service user are considered as a reliable resource for collection of
information because they can tell flaws or good things by sharing their experiences. Government
also releases various document with contain significant data, it can be used at the time of
grouping of content (O’Fallon and Butterfield, 2011). An organisation can think about secondary
business data like financial records, they can assist them in assembling quantitative matter which
will be crucial for secondary data.
Most of the restaurant faces problem relating to lack of customers, they generally get
sufficient number of consumers on weekends but on other days most f their seats remain empty.
If they properly analyse primary and secondary information which they can gather from above
mentioned sources than they can make a pattern and decide their future policies accordingly.
1.2 Methodology for survey and sampling frame used
Most of the organisation have more trust in primary data, if it is compared from
secondary, because it is the information which is collected for first time as the chances of
addition or subtraction of content is not possible. Blackfriars Restaurant can use a questionnaire
or conduct an interview. They can ask questions about their food quality, prices which they
should charge, location etc. They will be the best option for them from the available methods of
survey methodologies. Primary research can give the sound and reliable data which can assist
them in taking correct decisions.
Cited restaurant can not take interview of every customer, they can not ask every person
to fill their questionnaire. One of all, they do not have resources for it and second, most of the
service user do not have to for this kind of thing (Pfeffer and Salancik, 2012). They have various
options like random sampling, stratifies sampling, etc. Instead of thinking about different choice
they can go for random sampling because it is easiest among all of them and it would be
convenient for cited organisation. Out of the total population they need to select some of them
without making any systematic pattern. This method has many advantages, chances of biasness
is almost negligible in this option. It do not involve much cost, which cited organisation can not
afford. This survey will help them in making right decision so they can attain their set goals in
pre-determined period of time.
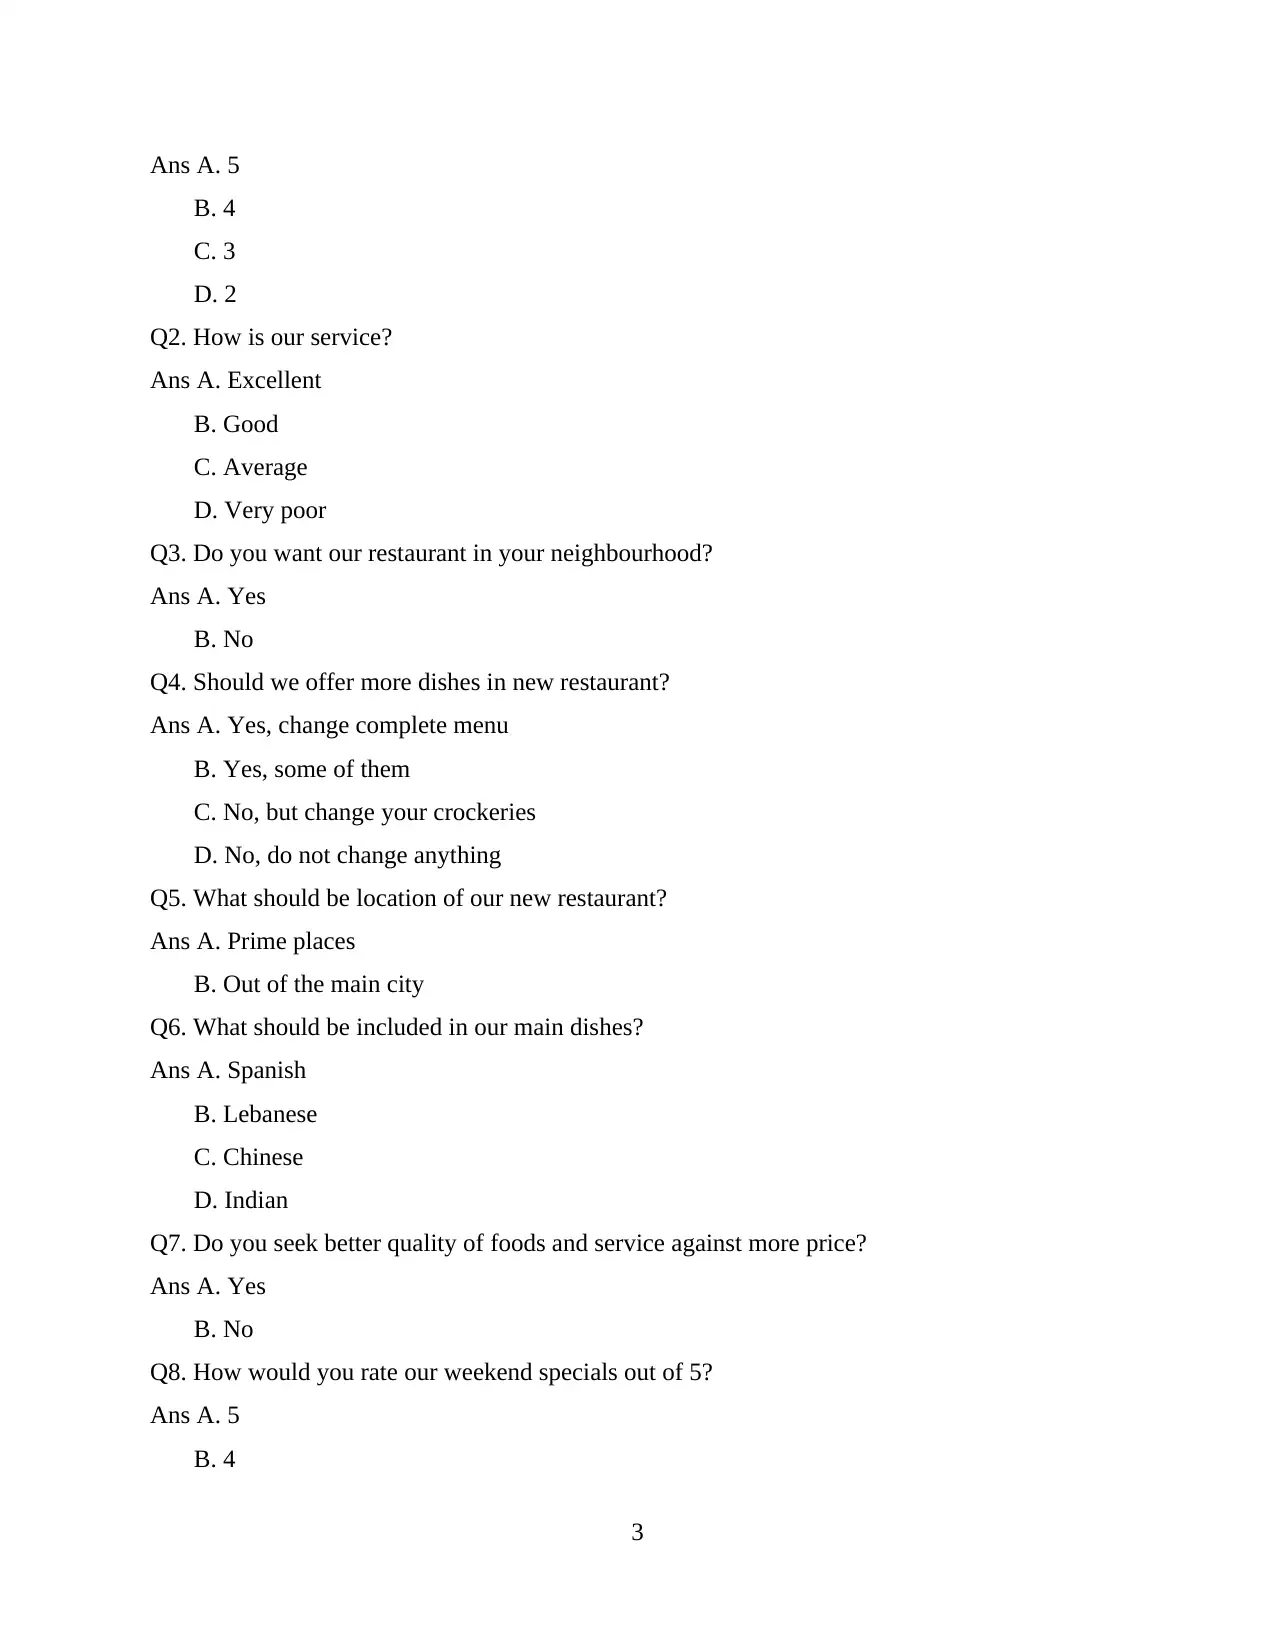
1.3 Questionnaire for gathering of data
This Questionnaire will be presented to 125 visitors.
Q1. What rating will you give to our food quality out of 5?
2
information because they can tell flaws or good things by sharing their experiences. Government
also releases various document with contain significant data, it can be used at the time of
grouping of content (O’Fallon and Butterfield, 2011). An organisation can think about secondary
business data like financial records, they can assist them in assembling quantitative matter which
will be crucial for secondary data.
Most of the restaurant faces problem relating to lack of customers, they generally get
sufficient number of consumers on weekends but on other days most f their seats remain empty.
If they properly analyse primary and secondary information which they can gather from above
mentioned sources than they can make a pattern and decide their future policies accordingly.
1.2 Methodology for survey and sampling frame used
Most of the organisation have more trust in primary data, if it is compared from
secondary, because it is the information which is collected for first time as the chances of
addition or subtraction of content is not possible. Blackfriars Restaurant can use a questionnaire
or conduct an interview. They can ask questions about their food quality, prices which they
should charge, location etc. They will be the best option for them from the available methods of
survey methodologies. Primary research can give the sound and reliable data which can assist
them in taking correct decisions.
Cited restaurant can not take interview of every customer, they can not ask every person
to fill their questionnaire. One of all, they do not have resources for it and second, most of the
service user do not have to for this kind of thing (Pfeffer and Salancik, 2012). They have various
options like random sampling, stratifies sampling, etc. Instead of thinking about different choice
they can go for random sampling because it is easiest among all of them and it would be
convenient for cited organisation. Out of the total population they need to select some of them
without making any systematic pattern. This method has many advantages, chances of biasness
is almost negligible in this option. It do not involve much cost, which cited organisation can not
afford. This survey will help them in making right decision so they can attain their set goals in
pre-determined period of time.
1.3 Questionnaire for gathering of data
This Questionnaire will be presented to 125 visitors.
Q1. What rating will you give to our food quality out of 5?
2
Paraphrase This Document
Need a fresh take? Get an instant paraphrase of this document with our AI Paraphraser
Ans A. 5
B. 4
C. 3
D. 2
Q2. How is our service?
Ans A. Excellent
B. Good
C. Average
D. Very poor
Q3. Do you want our restaurant in your neighbourhood?
Ans A. Yes
B. No
Q4. Should we offer more dishes in new restaurant?
Ans A. Yes, change complete menu
B. Yes, some of them
C. No, but change your crockeries
D. No, do not change anything
Q5. What should be location of our new restaurant?
Ans A. Prime places
B. Out of the main city
Q6. What should be included in our main dishes?
Ans A. Spanish
B. Lebanese
C. Chinese
D. Indian
Q7. Do you seek better quality of foods and service against more price?
Ans A. Yes
B. No
Q8. How would you rate our weekend specials out of 5?
Ans A. 5
B. 4
3
B. 4
C. 3
D. 2
Q2. How is our service?
Ans A. Excellent
B. Good
C. Average
D. Very poor
Q3. Do you want our restaurant in your neighbourhood?
Ans A. Yes
B. No
Q4. Should we offer more dishes in new restaurant?
Ans A. Yes, change complete menu
B. Yes, some of them
C. No, but change your crockeries
D. No, do not change anything
Q5. What should be location of our new restaurant?
Ans A. Prime places
B. Out of the main city
Q6. What should be included in our main dishes?
Ans A. Spanish
B. Lebanese
C. Chinese
D. Indian
Q7. Do you seek better quality of foods and service against more price?
Ans A. Yes
B. No
Q8. How would you rate our weekend specials out of 5?
Ans A. 5
B. 4
3
C. 3
D. 2 or less than two
Q9. Do you thing we have shortage of staff?
Ans A. Yes
B. Yes, but only on weekends
C. No
Q10. Would you like 3 more restaurants in upcoming time?
Ans A. 4 would be better
B. Yes, three will be fine
C. No, focus on existing one
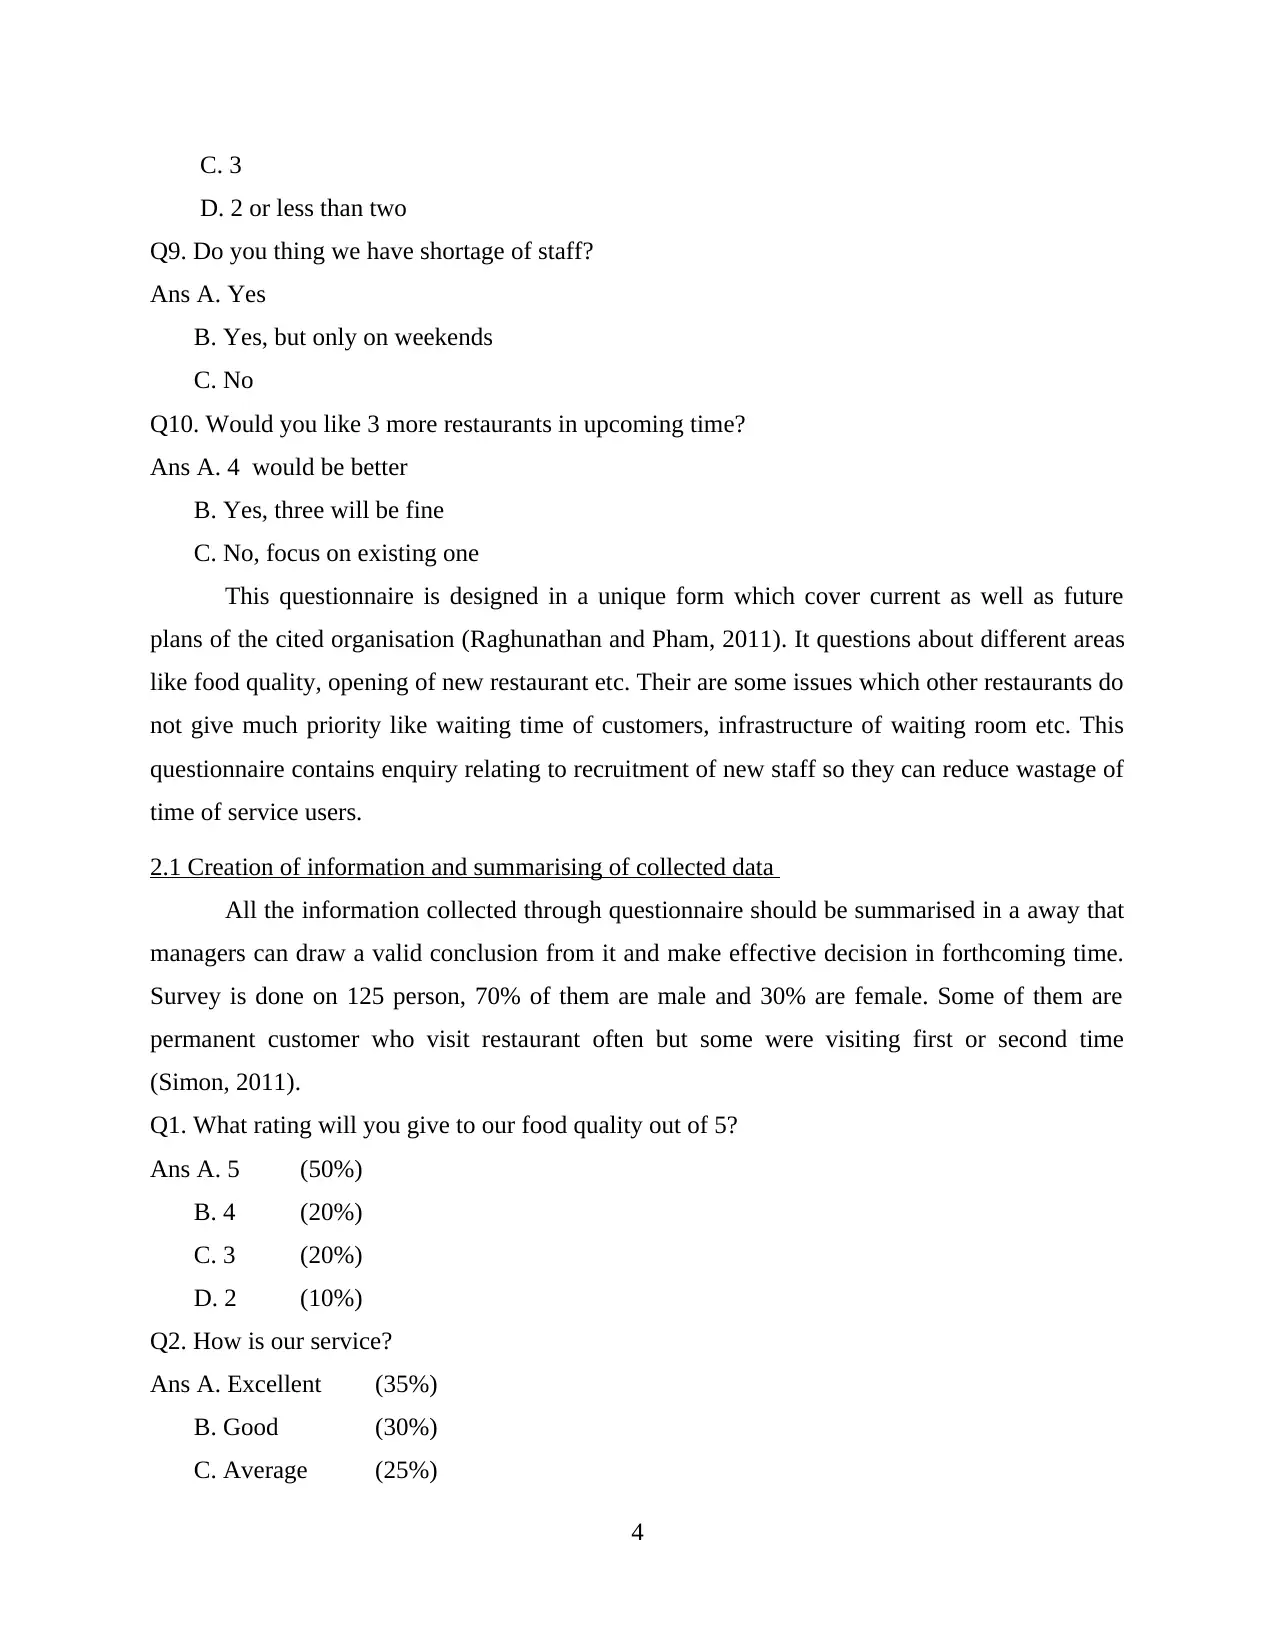
This questionnaire is designed in a unique form which cover current as well as future
plans of the cited organisation (Raghunathan and Pham, 2011). It questions about different areas
like food quality, opening of new restaurant etc. Their are some issues which other restaurants do
not give much priority like waiting time of customers, infrastructure of waiting room etc. This
questionnaire contains enquiry relating to recruitment of new staff so they can reduce wastage of
time of service users.
2.1 Creation of information and summarising of collected data
All the information collected through questionnaire should be summarised in a away that
managers can draw a valid conclusion from it and make effective decision in forthcoming time.
Survey is done on 125 person, 70% of them are male and 30% are female. Some of them are
permanent customer who visit restaurant often but some were visiting first or second time
(Simon, 2011).
Q1. What rating will you give to our food quality out of 5?
Ans A. 5 (50%)
B. 4 (20%)
C. 3 (20%)
D. 2 (10%)
Q2. How is our service?
Ans A. Excellent (35%)
B. Good (30%)
C. Average (25%)
4
D. 2 or less than two
Q9. Do you thing we have shortage of staff?
Ans A. Yes
B. Yes, but only on weekends
C. No
Q10. Would you like 3 more restaurants in upcoming time?
Ans A. 4 would be better
B. Yes, three will be fine
C. No, focus on existing one
This questionnaire is designed in a unique form which cover current as well as future
plans of the cited organisation (Raghunathan and Pham, 2011). It questions about different areas
like food quality, opening of new restaurant etc. Their are some issues which other restaurants do
not give much priority like waiting time of customers, infrastructure of waiting room etc. This
questionnaire contains enquiry relating to recruitment of new staff so they can reduce wastage of
time of service users.
2.1 Creation of information and summarising of collected data
All the information collected through questionnaire should be summarised in a away that
managers can draw a valid conclusion from it and make effective decision in forthcoming time.
Survey is done on 125 person, 70% of them are male and 30% are female. Some of them are
permanent customer who visit restaurant often but some were visiting first or second time
(Simon, 2011).
Q1. What rating will you give to our food quality out of 5?
Ans A. 5 (50%)
B. 4 (20%)
C. 3 (20%)
D. 2 (10%)
Q2. How is our service?
Ans A. Excellent (35%)
B. Good (30%)
C. Average (25%)
4
⊘ This is a preview!⊘
Do you want full access?
Subscribe today to unlock all pages.
Trusted by 1+ million students worldwide
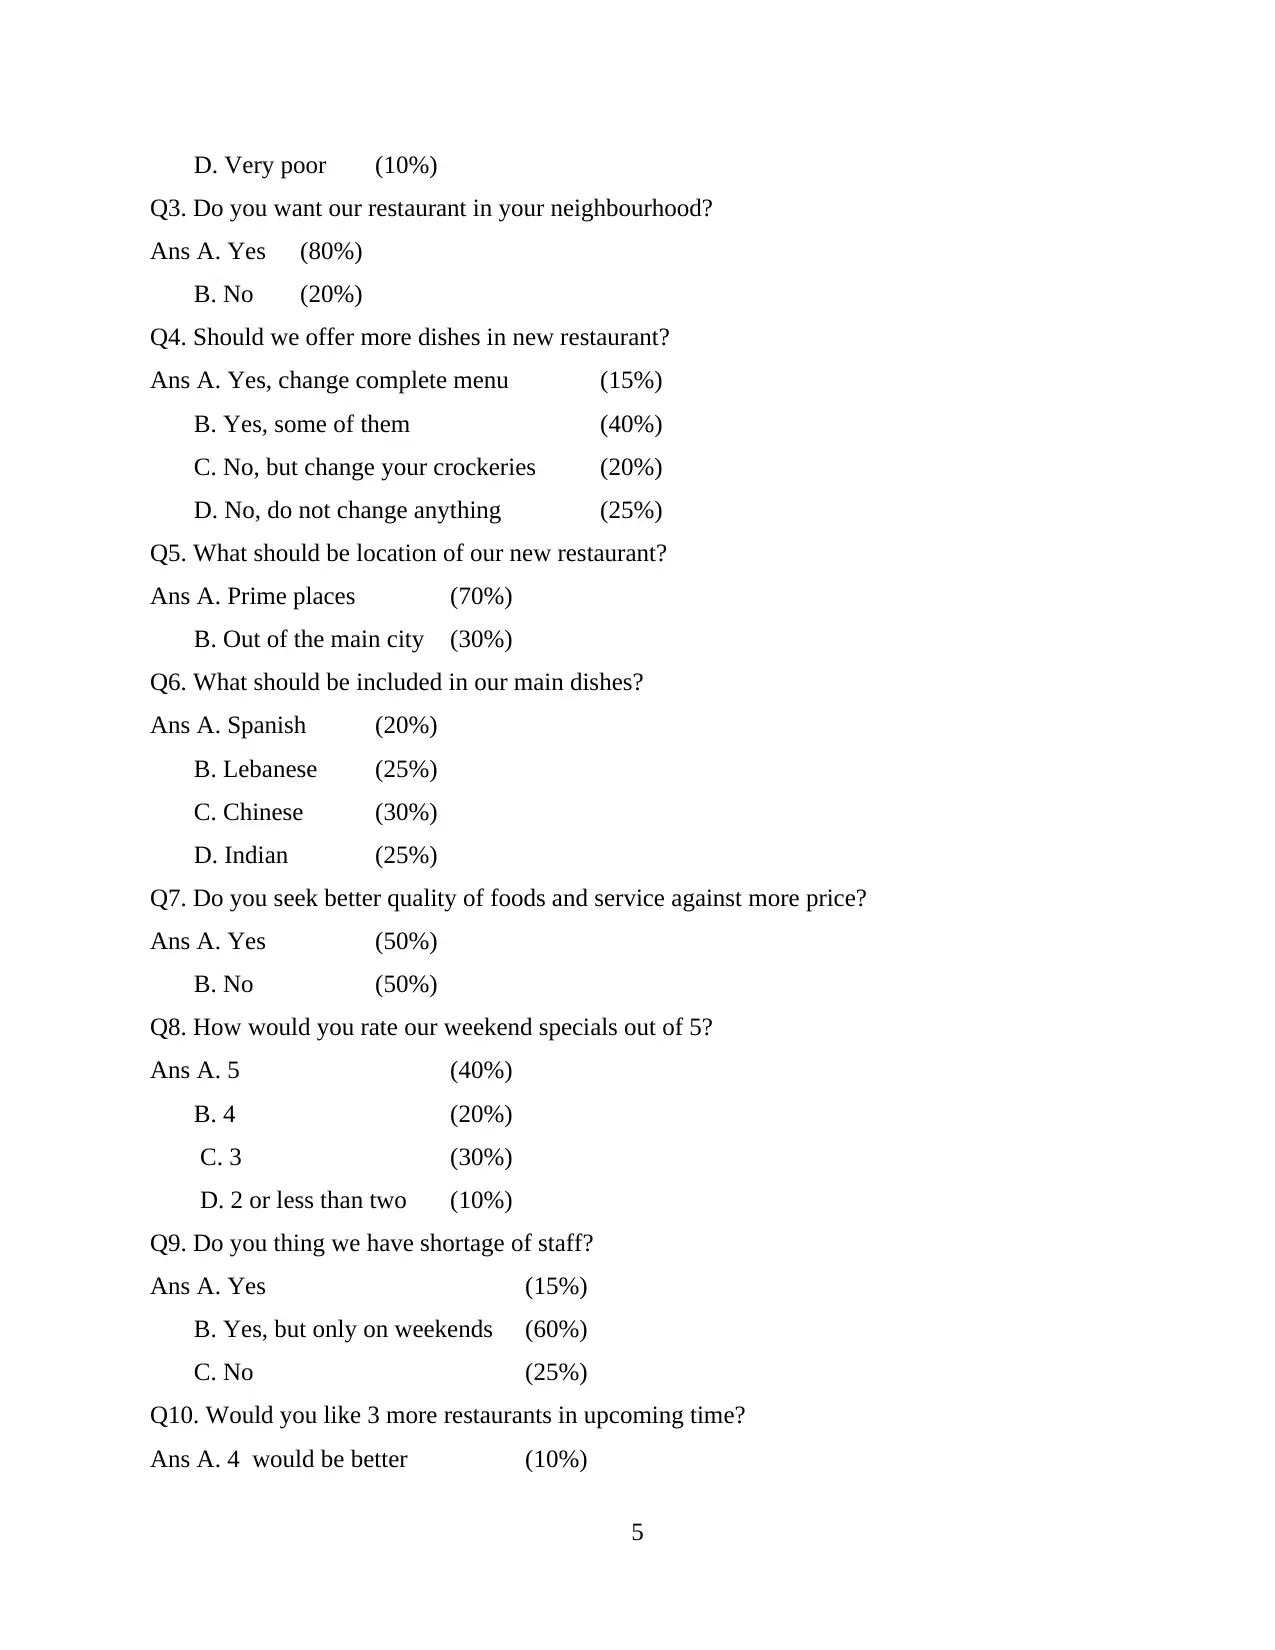
D. Very poor (10%)
Q3. Do you want our restaurant in your neighbourhood?
Ans A. Yes (80%)
B. No (20%)
Q4. Should we offer more dishes in new restaurant?
Ans A. Yes, change complete menu (15%)
B. Yes, some of them (40%)
C. No, but change your crockeries (20%)
D. No, do not change anything (25%)
Q5. What should be location of our new restaurant?
Ans A. Prime places (70%)
B. Out of the main city (30%)
Q6. What should be included in our main dishes?
Ans A. Spanish (20%)
B. Lebanese (25%)
C. Chinese (30%)
D. Indian (25%)
Q7. Do you seek better quality of foods and service against more price?
Ans A. Yes (50%)
B. No (50%)
Q8. How would you rate our weekend specials out of 5?
Ans A. 5 (40%)
B. 4 (20%)
C. 3 (30%)
D. 2 or less than two (10%)
Q9. Do you thing we have shortage of staff?
Ans A. Yes (15%)
B. Yes, but only on weekends (60%)
C. No (25%)
Q10. Would you like 3 more restaurants in upcoming time?
Ans A. 4 would be better (10%)
5
Paraphrase This Document
Need a fresh take? Get an instant paraphrase of this document with our AI Paraphraser
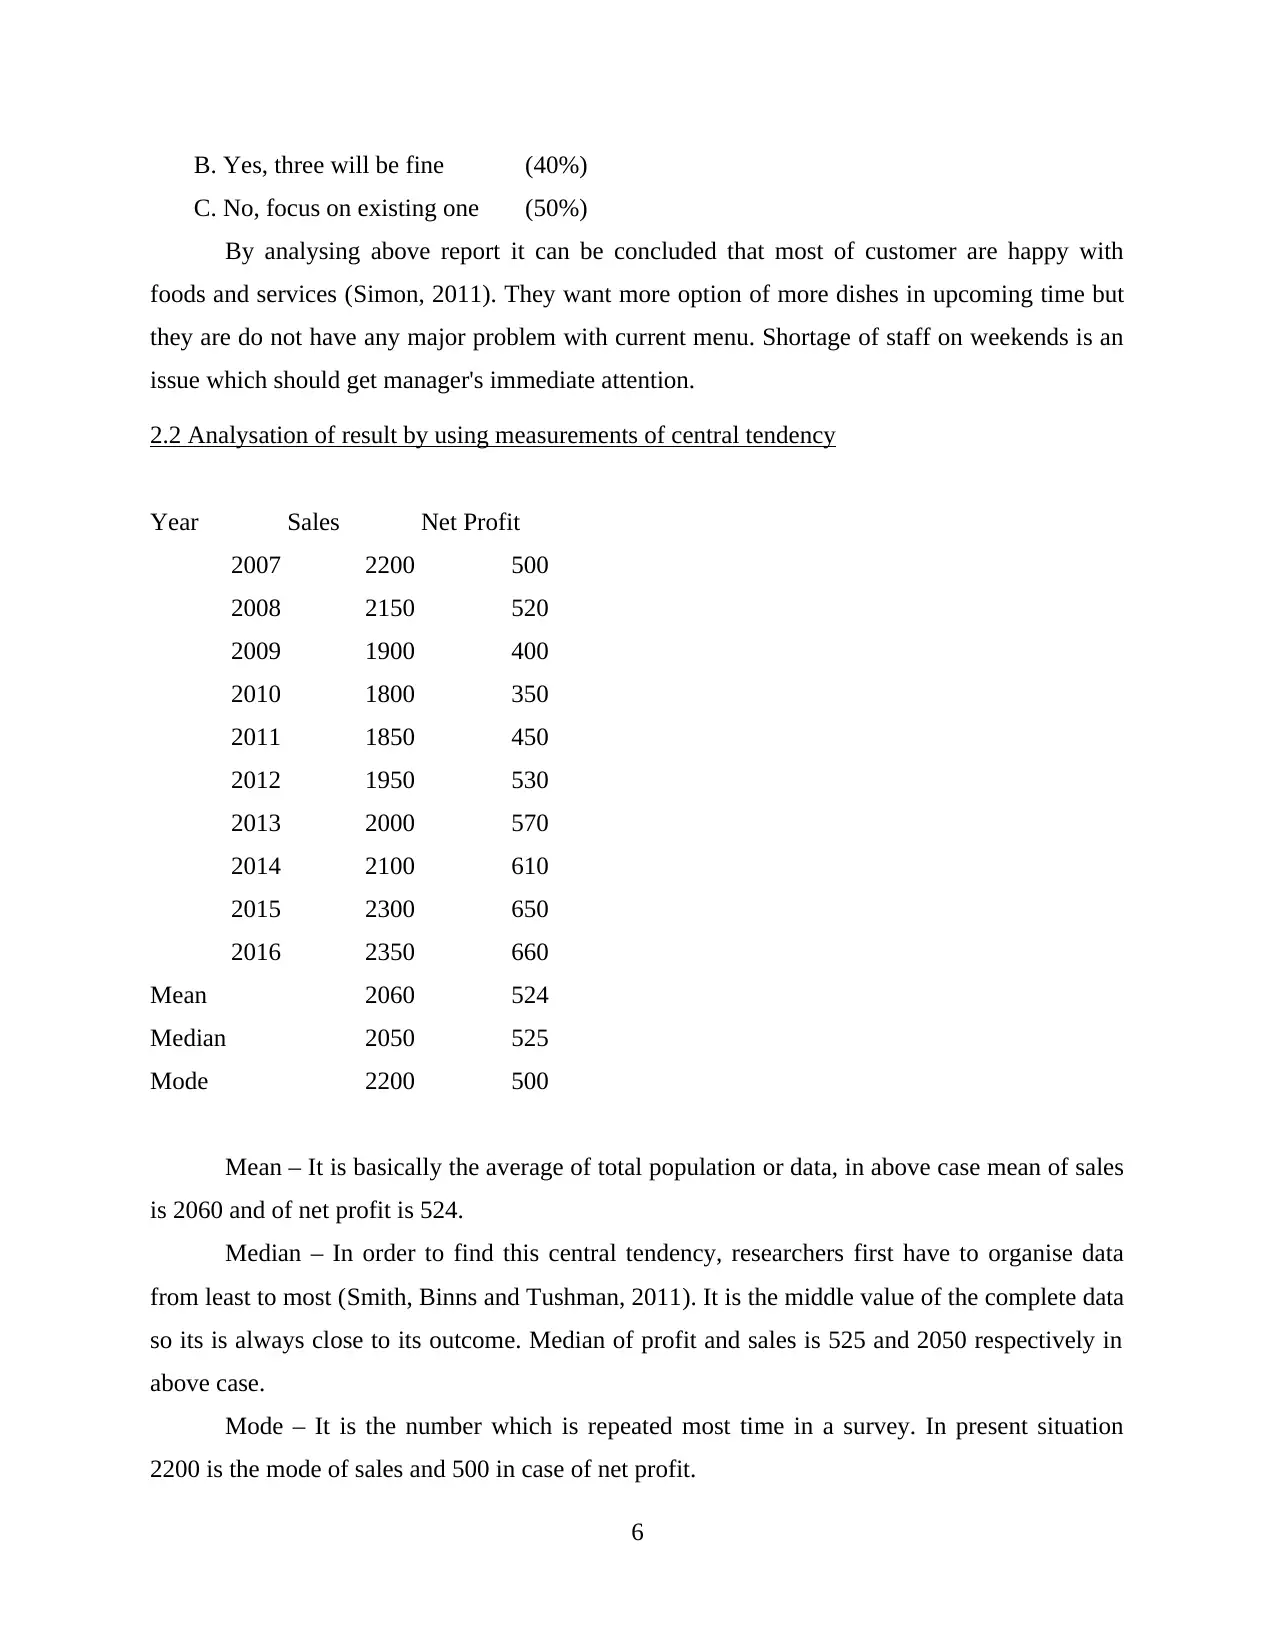
B. Yes, three will be fine (40%)
C. No, focus on existing one (50%)
By analysing above report it can be concluded that most of customer are happy with
foods and services (Simon, 2011). They want more option of more dishes in upcoming time but
they are do not have any major problem with current menu. Shortage of staff on weekends is an
issue which should get manager's immediate attention.
2.2 Analysation of result by using measurements of central tendency
Year Sales Net Profit
2007 2200 500
2008 2150 520
2009 1900 400
2010 1800 350
2011 1850 450
2012 1950 530
2013 2000 570
2014 2100 610
2015 2300 650
2016 2350 660
Mean 2060 524
Median 2050 525
Mode 2200 500
Mean – It is basically the average of total population or data, in above case mean of sales
is 2060 and of net profit is 524.
Median – In order to find this central tendency, researchers first have to organise data
from least to most (Smith, Binns and Tushman, 2011). It is the middle value of the complete data
so its is always close to its outcome. Median of profit and sales is 525 and 2050 respectively in
above case.
Mode – It is the number which is repeated most time in a survey. In present situation
2200 is the mode of sales and 500 in case of net profit.
6

2.3 Analysation of results by using measures of dispersion
Particulars Sales Net profit
standard deviation 189.73 103.09
minimum range 1800 350
maximum range 2350 660
Interquartile 337.5 182.5
Correlation
coefficient 0.83 0.83
Every effective strategy need some process which they can use in formation of sound
plans. They can provide great assistance in achieving target which is necessary to reaching long
term goals.
Measures of deviation – They are significant for analysing the data which revel deviation
between the standards which management had set and the actual result. It is crucial for process of
decision making. In above scenario, 189.73 is the standard deviation of sale and 103.09 is for net
profit (Sosna, Trevinyo-Rodríguez and Velamuri, 2011). It depicts risk which is associated with
the plans and the uncertain which may arise in forthcoming time.
2.4 Utilisation of quartile, percentile and Correlation in process of decision making
Quartiles – Under this measure, whole population is divided by four in order to get four
equal part known as quartile. Small values are consider in first part which is popular by the name
of lower quartile. It is calculated by taking bottom data. In second quartile, median is ascertained
by dividing available range from middle. In third part, medial comes out in initial stage, it is also
know as upper quartile which reveal data that is present in highest value. It is very difficult for a
researcher to analyse whole content in one short, this method break data in parts which reduce
the complexity of the process. It is important in case of benchmarking because they analyse
variations properly. If the result obtained lies in a range of 25% than it will consider at the time
of decision making otherwise it will be useless for researchers.
Percentile – It is calculated by dividing the figures from the highest figure. It is
completely different from percentage, highest figure is set in denominator and than, one by one,
all the numbers are divided from it (Tzeng and Huang, 2011). It reveals actual results and
remove irrelevant information which may create various kind of confusions in the mind of
7
⊘ This is a preview!⊘
Do you want full access?
Subscribe today to unlock all pages.
Trusted by 1+ million students worldwide
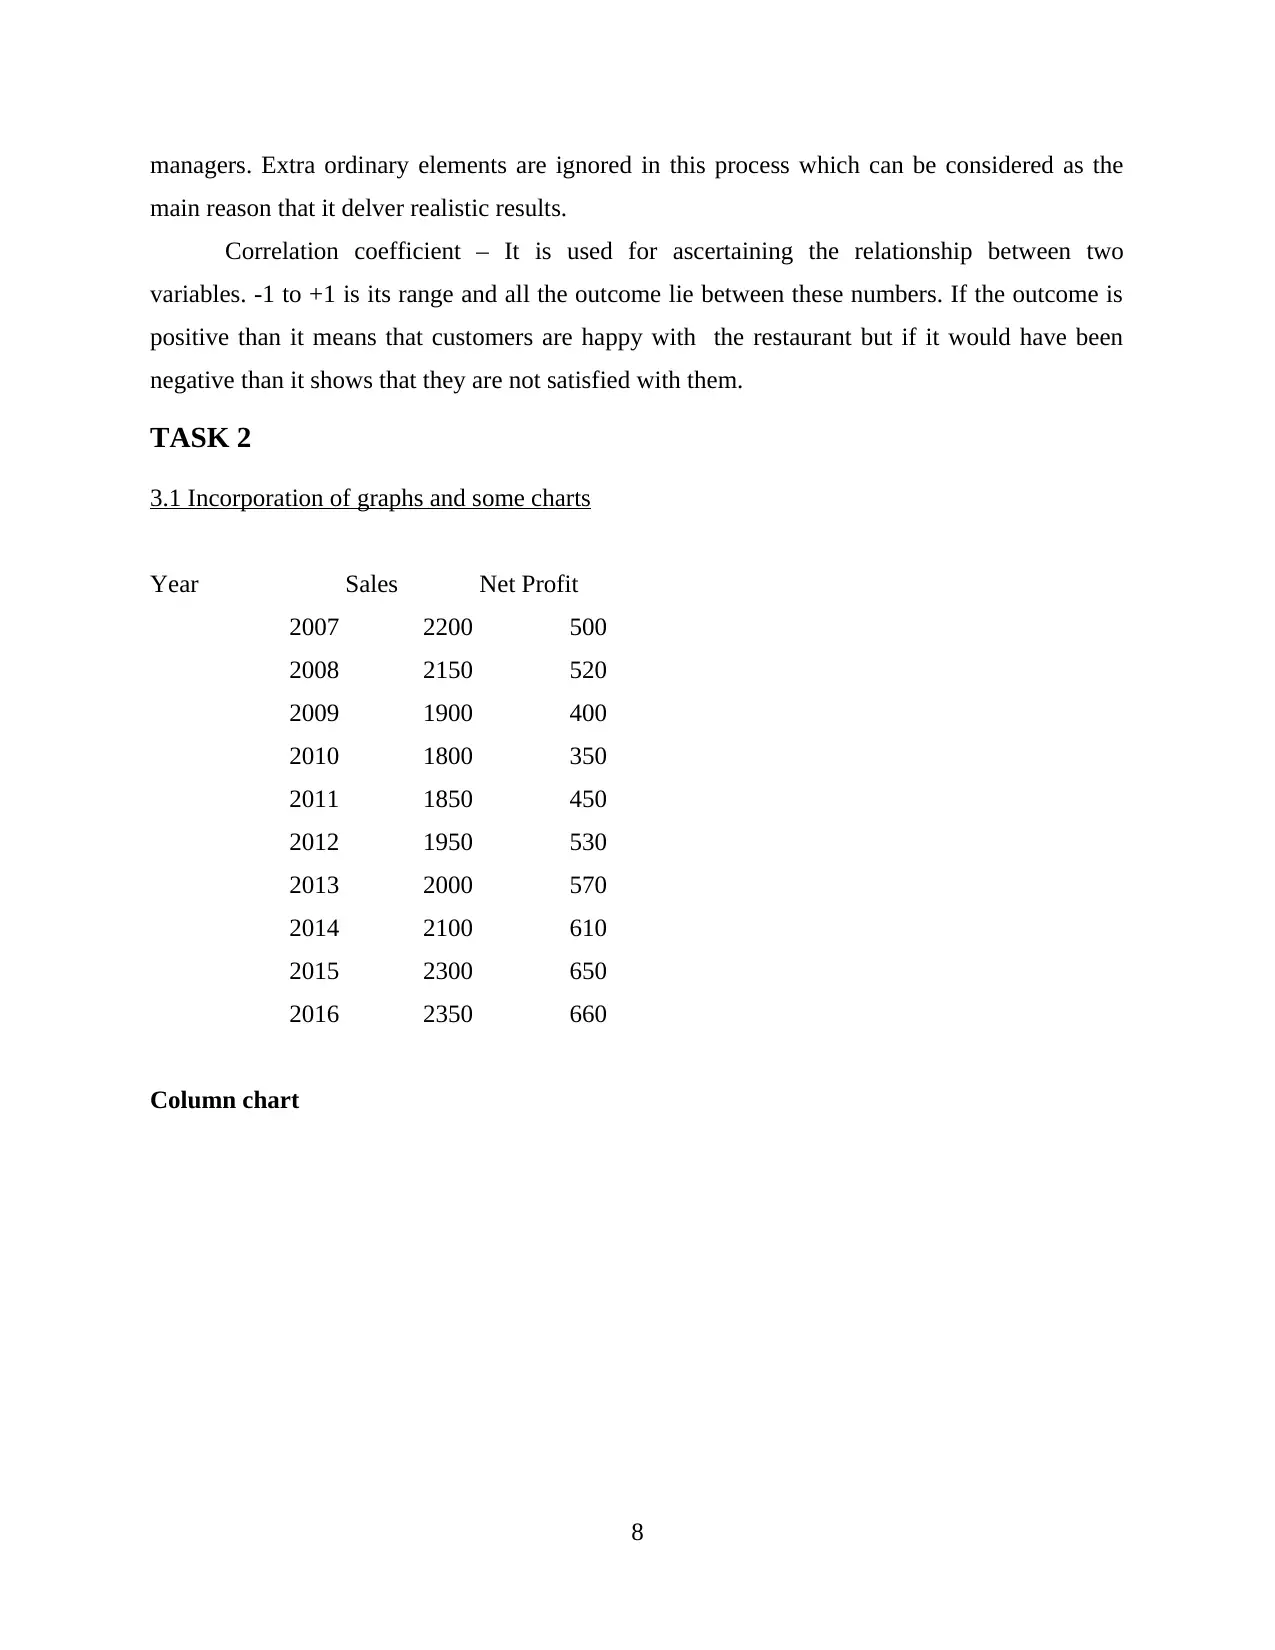
managers. Extra ordinary elements are ignored in this process which can be considered as the
main reason that it delver realistic results.
Correlation coefficient – It is used for ascertaining the relationship between two
variables. -1 to +1 is its range and all the outcome lie between these numbers. If the outcome is
positive than it means that customers are happy with the restaurant but if it would have been
negative than it shows that they are not satisfied with them.
TASK 2
3.1 Incorporation of graphs and some charts
Year Sales Net Profit
2007 2200 500
2008 2150 520
2009 1900 400
2010 1800 350
2011 1850 450
2012 1950 530
2013 2000 570
2014 2100 610
2015 2300 650
2016 2350 660
Column chart
8
Paraphrase This Document
Need a fresh take? Get an instant paraphrase of this document with our AI Paraphraser
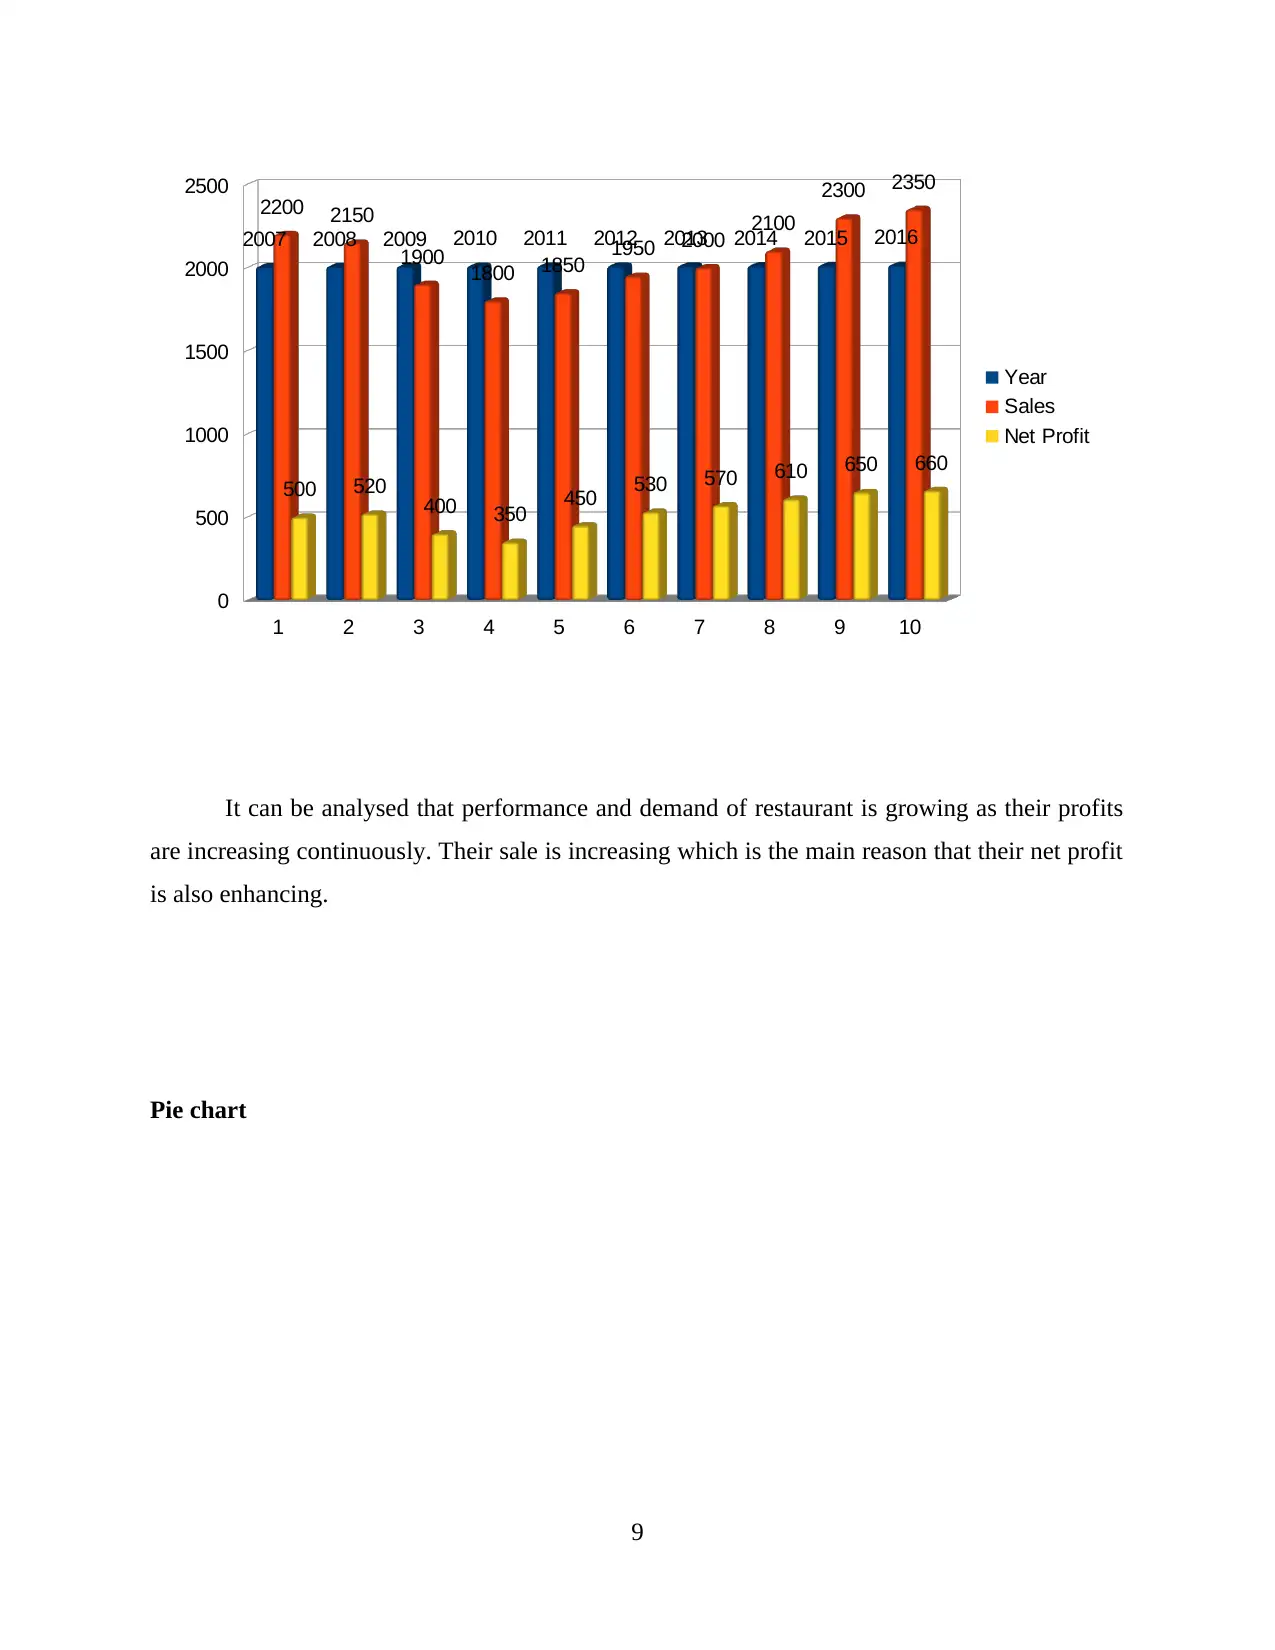
It can be analysed that performance and demand of restaurant is growing as their profits
are increasing continuously. Their sale is increasing which is the main reason that their net profit
is also enhancing.
Pie chart
9
1 2 3 4 5 6 7 8 9 10
0
500
1000
1500
2000
2500
2007 2008 2009 2010 2011 2012 2013 2014 2015 2016
2200 2150
1900 1800 1850 1950 2000 2100
2300 2350
500 520 400 350 450 530 570 610 650 660
Year
Sales
Net Profit
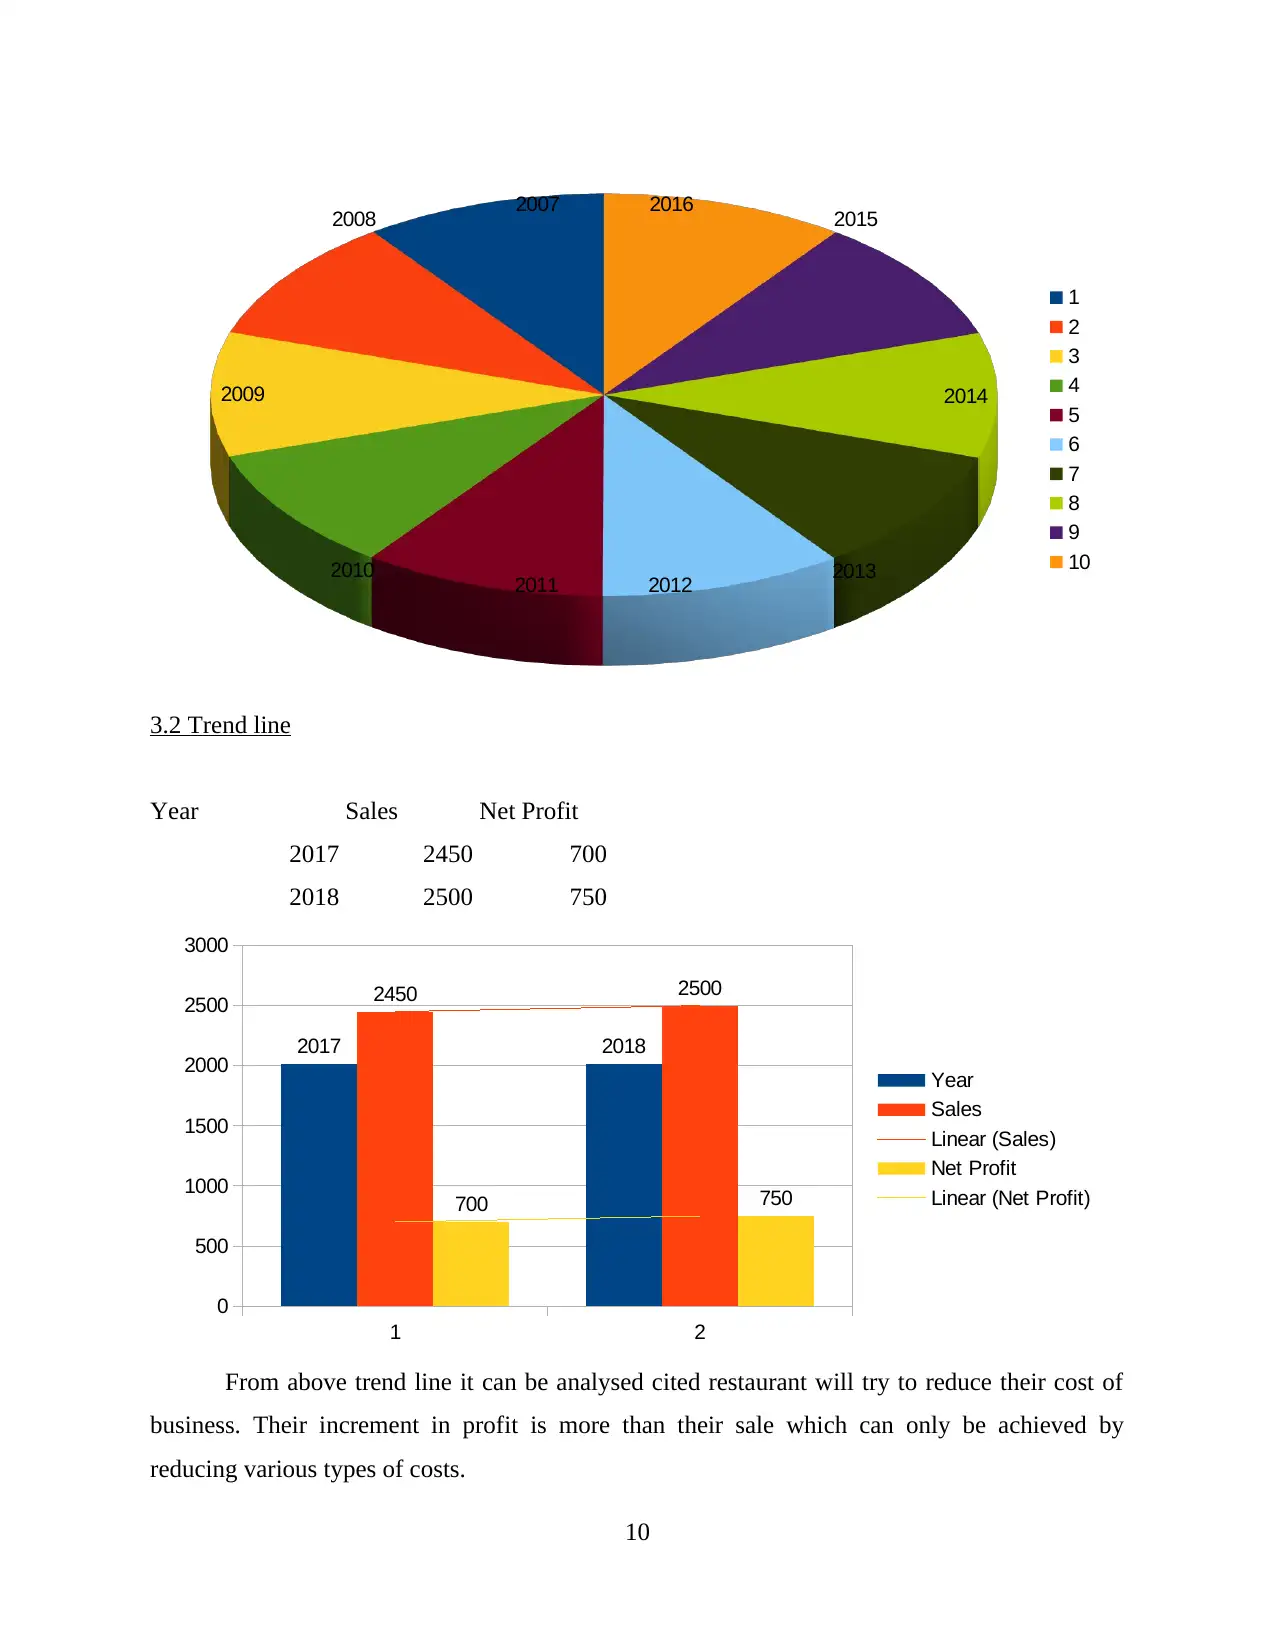
3.2 Trend line
Year Sales Net Profit
2017 2450 700
2018 2500 750
From above trend line it can be analysed cited restaurant will try to reduce their cost of
business. Their increment in profit is more than their sale which can only be achieved by
reducing various types of costs.
10
2007
2008
2009
2010 2011 2012 2013
2014
2015
2016
1
2
3
4
5
6
7
8
9
10
1 2
0
500
1000
1500
2000
2500
3000
2017 2018
2450 2500
700 750
Year
Sales
Linear (Sales)
Net Profit
Linear (Net Profit)
⊘ This is a preview!⊘
Do you want full access?
Subscribe today to unlock all pages.
Trusted by 1+ million students worldwide
1 out of 16
Related Documents


Your All-in-One AI-Powered Toolkit for Academic Success.
+13062052269
info@desklib.com
Available 24*7 on WhatsApp / Email
![[object Object]](/_next/static/media/star-bottom.7253800d.svg)
Unlock your academic potential
Copyright © 2020–2026 A2Z Services. All Rights Reserved. Developed and managed by ZUCOL.