Business Decision Making Report: Analyzing Food for Friends Data
VerifiedAdded on 2020/06/05
|63
|4296
|328
Report
AI Summary
This report provides a comprehensive analysis of business decision-making processes, using the case study of 'Food for Friends' restaurant. It begins by outlining a plan for collecting both primary and secondary data, including survey methodologies and the design of a questionnaire. The report then delves into data analysis techniques, calculating mean, median, mode, and dispersion to draw valid conclusions from the questionnaire responses. Further analysis includes the use of quartiles, percentiles, and correlation coefficients. The report also covers graphical presentations, trend line creation for future forecasting, and the development of a formal business report. Finally, it explores the advantages of information processing tools, critical path management, and financial tools in supporting effective decision-making. The goal is to provide insights for Food for Friends to make informed decisions regarding business expansion, particularly in the London market.

BUSINESS
DECISION MAKING
DECISION MAKING
Paraphrase This Document
Need a fresh take? Get an instant paraphrase of this document with our AI Paraphraser
Table of Contents
INTRODUCTION...........................................................................................................................3
TASK 1............................................................................................................................................4
AC 1.1 Primary and secondary data plan for Food for Friends..................................................4
AC 1.2 Uses of Survey methodologies and sampling frame for collecting primary and
secondary data.............................................................................................................................5
AC 1.3 Questionnaire for opening restaurant in London............................................................5
AC 2.1 Valuable data for decision-making on the basis of questionnaire responses.................7
AC 2.2 Determination of results for valid conclusion for Food for Friends through mean,
median and mode........................................................................................................................8
AC 2.3 Analysis of data through dispersion measurement.........................................................9
AC 2.4 Calculation of quartiles, percentiles and correlation coefficient for valid conclusions..9
TASK 2..........................................................................................................................................11
AC 3.1 Graphical presentation on the basis of questionnaire for valid conclusion..................11
AC 3.2 Creation of trend lines in future forecasting.................................................................13
AC 3.3 Business presentation...................................................................................................14
AC 3.4 Formation of formal business report to Management..................................................14
TASK 3..........................................................................................................................................14
AC 4.1 Advantages of information processing tools to benefit decision-making....................14
AC 4.2 Formation of Critical Path Management model...........................................................15
AC 4.3 Benefits of financial tools in relation to make decisions..............................................18
CONCLUSION .............................................................................................................................19
REFERENCES..............................................................................................................................20

INTRODUCTION
It is said that success in business comes to those people who takes big decisions which
are right. Its not easy to took proper decisions (Albright, Winston and Zappe, 2010). Developing
the skills of asking right questions is necessary to build effective questionnaire.
It is said that success in business comes to those people who takes big decisions which
are right. Its not easy to took proper decisions (Albright, Winston and Zappe, 2010). Developing
the skills of asking right questions is necessary to build effective questionnaire.
⊘ This is a preview!⊘
Do you want full access?
Subscribe today to unlock all pages.
Trusted by 1+ million students worldwide
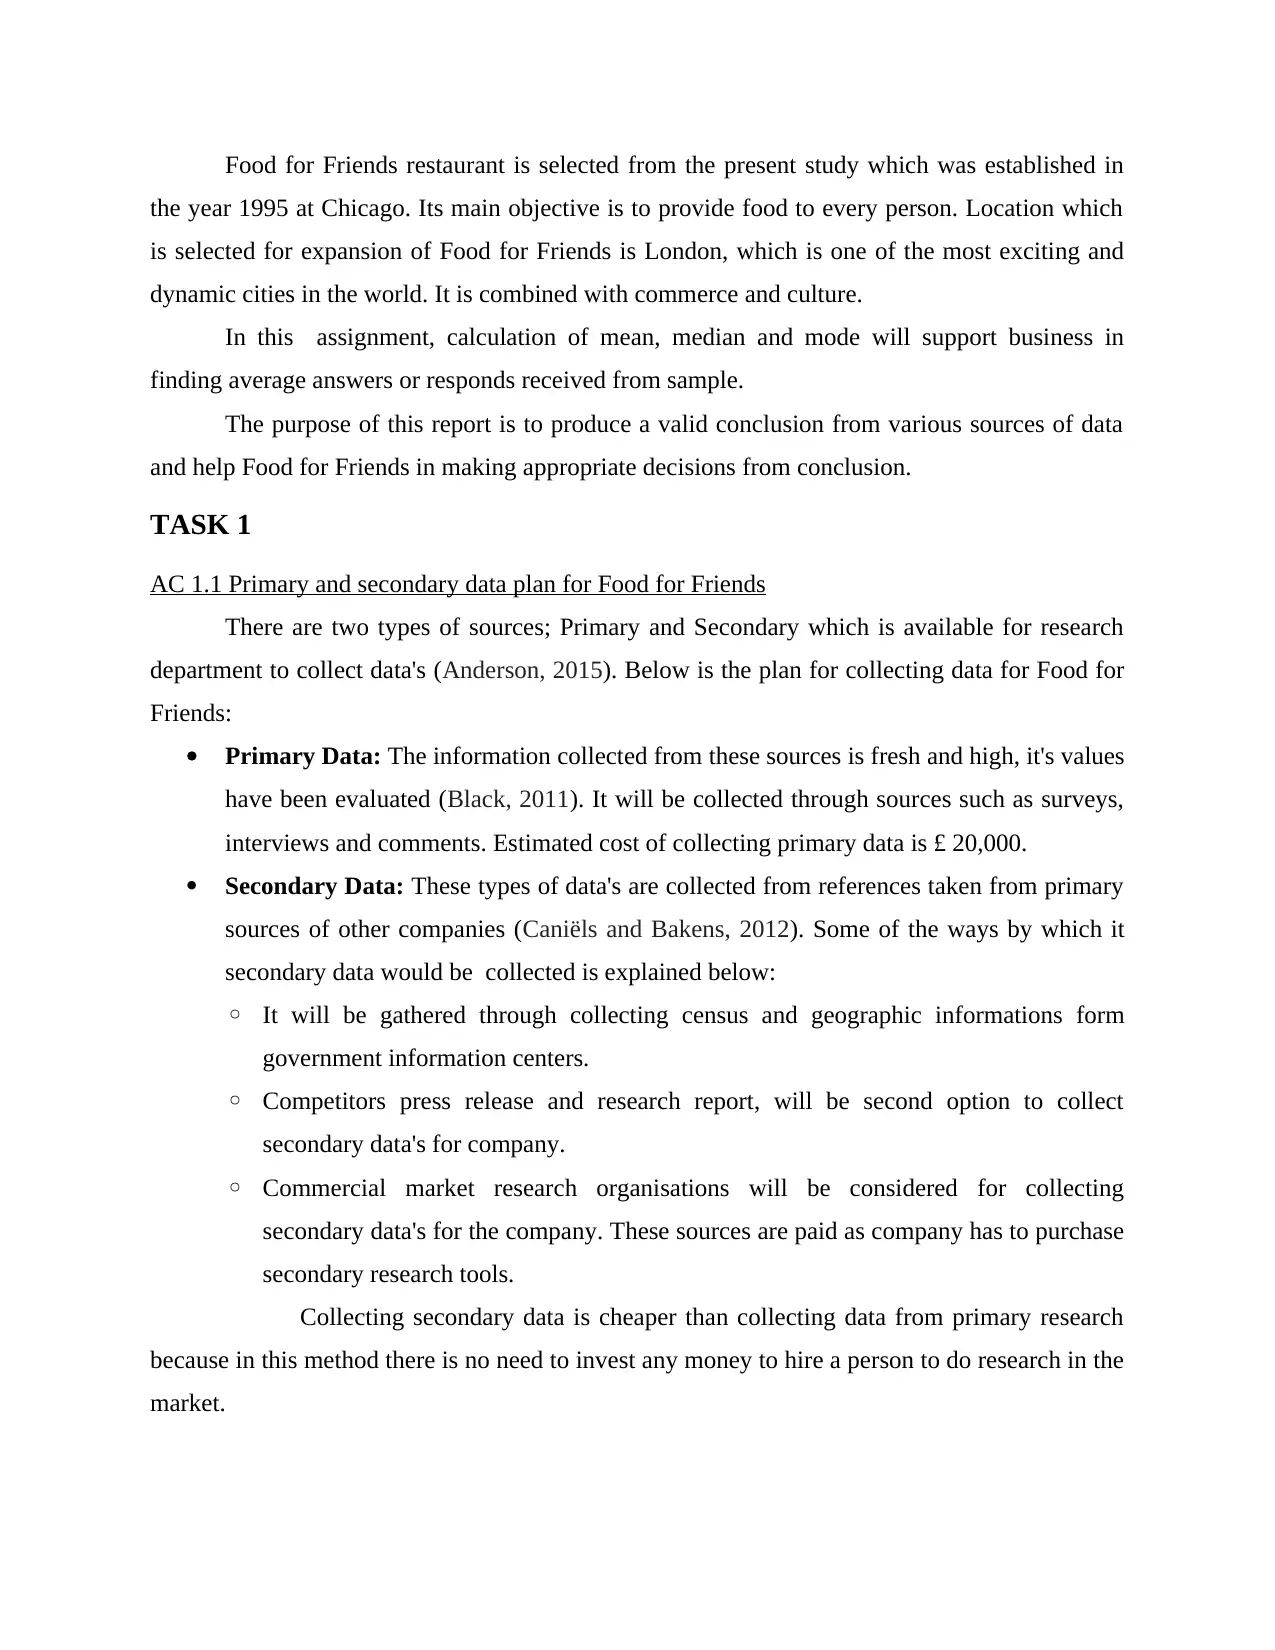
Food for Friends restaurant is selected from the present study which was established in
the year 1995 at Chicago. Its main objective is to provide food to every person. Location which
is selected for expansion of Food for Friends is London, which is one of the most exciting and
dynamic cities in the world. It is combined with commerce and culture.
In this assignment, calculation of mean, median and mode will support business in
finding average answers or responds received from sample.
The purpose of this report is to produce a valid conclusion from various sources of data
and help Food for Friends in making appropriate decisions from conclusion.
TASK 1
AC 1.1 Primary and secondary data plan for Food for Friends
There are two types of sources; Primary and Secondary which is available for research
department to collect data's (Anderson, 2015). Below is the plan for collecting data for Food for
Friends:
Primary Data: The information collected from these sources is fresh and high, it's values
have been evaluated (Black, 2011). It will be collected through sources such as surveys,
interviews and comments. Estimated cost of collecting primary data is £ 20,000.
Secondary Data: These types of data's are collected from references taken from primary
sources of other companies (Caniëls and Bakens, 2012). Some of the ways by which it
secondary data would be collected is explained below:
◦ It will be gathered through collecting census and geographic informations form
government information centers.
◦ Competitors press release and research report, will be second option to collect
secondary data's for company.
◦ Commercial market research organisations will be considered for collecting
secondary data's for the company. These sources are paid as company has to purchase
secondary research tools.
Collecting secondary data is cheaper than collecting data from primary research
because in this method there is no need to invest any money to hire a person to do research in the
market.
Paraphrase This Document
Need a fresh take? Get an instant paraphrase of this document with our AI Paraphraser
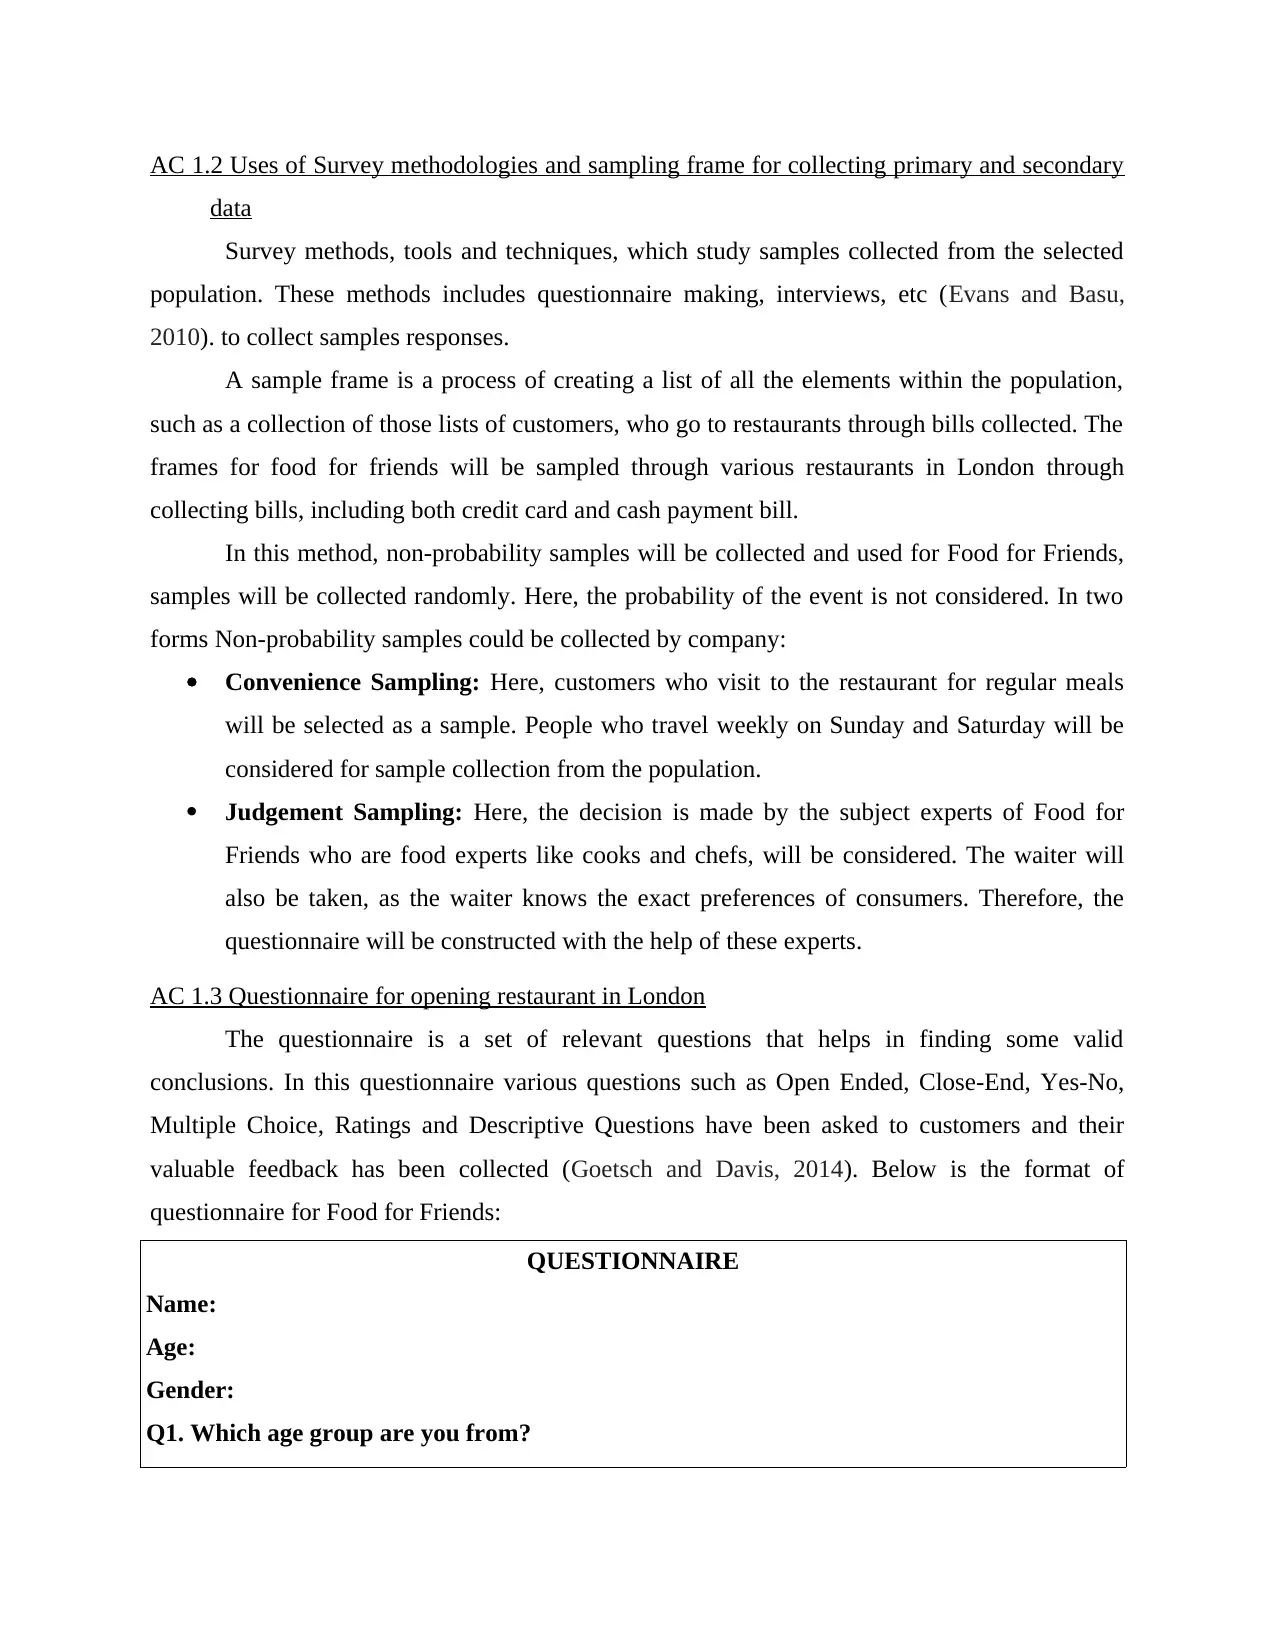
AC 1.2 Uses of Survey methodologies and sampling frame for collecting primary and secondary
data
Survey methods, tools and techniques, which study samples collected from the selected
population. These methods includes questionnaire making, interviews, etc (Evans and Basu,
2010). to collect samples responses.
A sample frame is a process of creating a list of all the elements within the population,
such as a collection of those lists of customers, who go to restaurants through bills collected. The
frames for food for friends will be sampled through various restaurants in London through
collecting bills, including both credit card and cash payment bill.
In this method, non-probability samples will be collected and used for Food for Friends,
samples will be collected randomly. Here, the probability of the event is not considered. In two
forms Non-probability samples could be collected by company:
Convenience Sampling: Here, customers who visit to the restaurant for regular meals
will be selected as a sample. People who travel weekly on Sunday and Saturday will be
considered for sample collection from the population.
Judgement Sampling: Here, the decision is made by the subject experts of Food for
Friends who are food experts like cooks and chefs, will be considered. The waiter will
also be taken, as the waiter knows the exact preferences of consumers. Therefore, the
questionnaire will be constructed with the help of these experts.
AC 1.3 Questionnaire for opening restaurant in London
The questionnaire is a set of relevant questions that helps in finding some valid
conclusions. In this questionnaire various questions such as Open Ended, Close-End, Yes-No,
Multiple Choice, Ratings and Descriptive Questions have been asked to customers and their
valuable feedback has been collected (Goetsch and Davis, 2014). Below is the format of
questionnaire for Food for Friends:
QUESTIONNAIRE
Name:
Age:
Gender:
Q1. Which age group are you from?
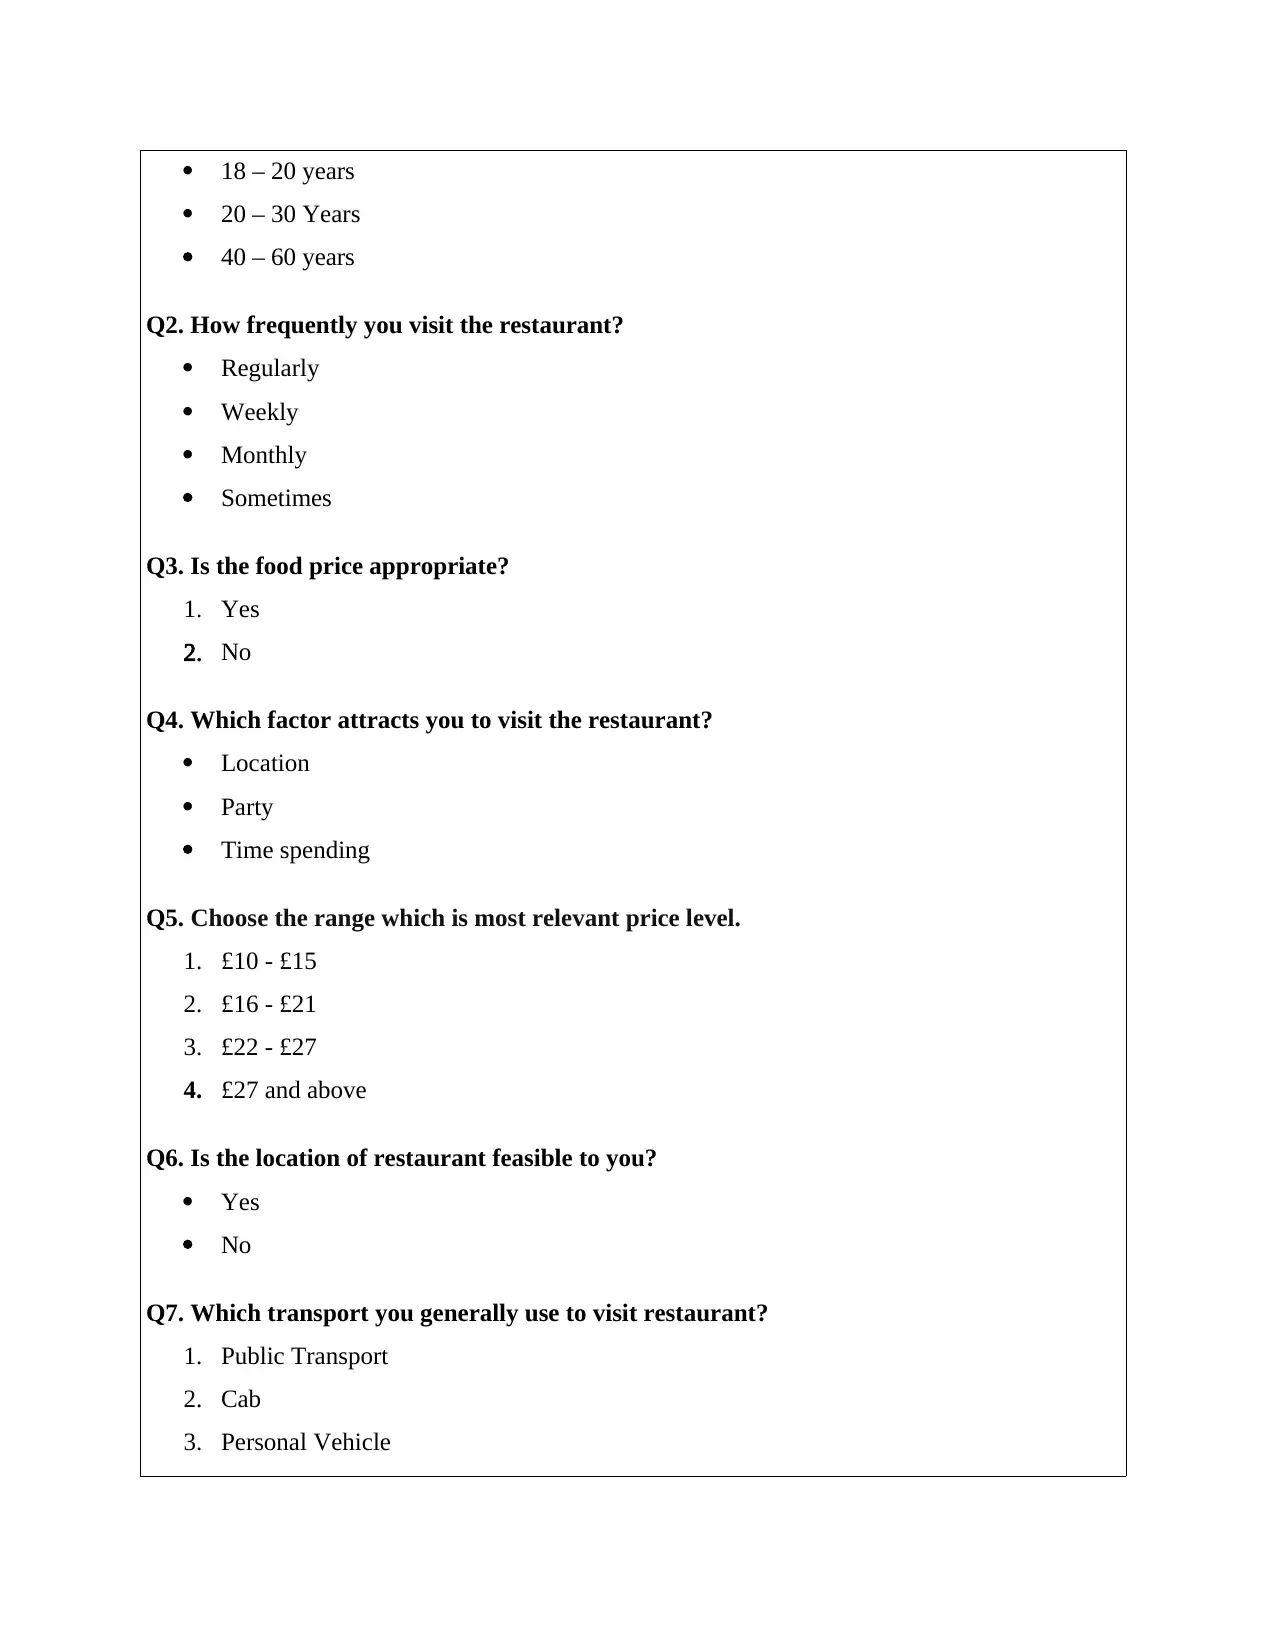
18 – 20 years
20 – 30 Years
40 – 60 years
Q2. How frequently you visit the restaurant?
Regularly
Weekly
Monthly
Sometimes
Q3. Is the food price appropriate?
1. Yes
2. No
Q4. Which factor attracts you to visit the restaurant?
Location
Party
Time spending
Q5. Choose the range which is most relevant price level.
1. £10 - £15
2. £16 - £21
3. £22 - £27
4. £27 and above
Q6. Is the location of restaurant feasible to you?
Yes
No
Q7. Which transport you generally use to visit restaurant?
1. Public Transport
2. Cab
3. Personal Vehicle
⊘ This is a preview!⊘
Do you want full access?
Subscribe today to unlock all pages.
Trusted by 1+ million students worldwide
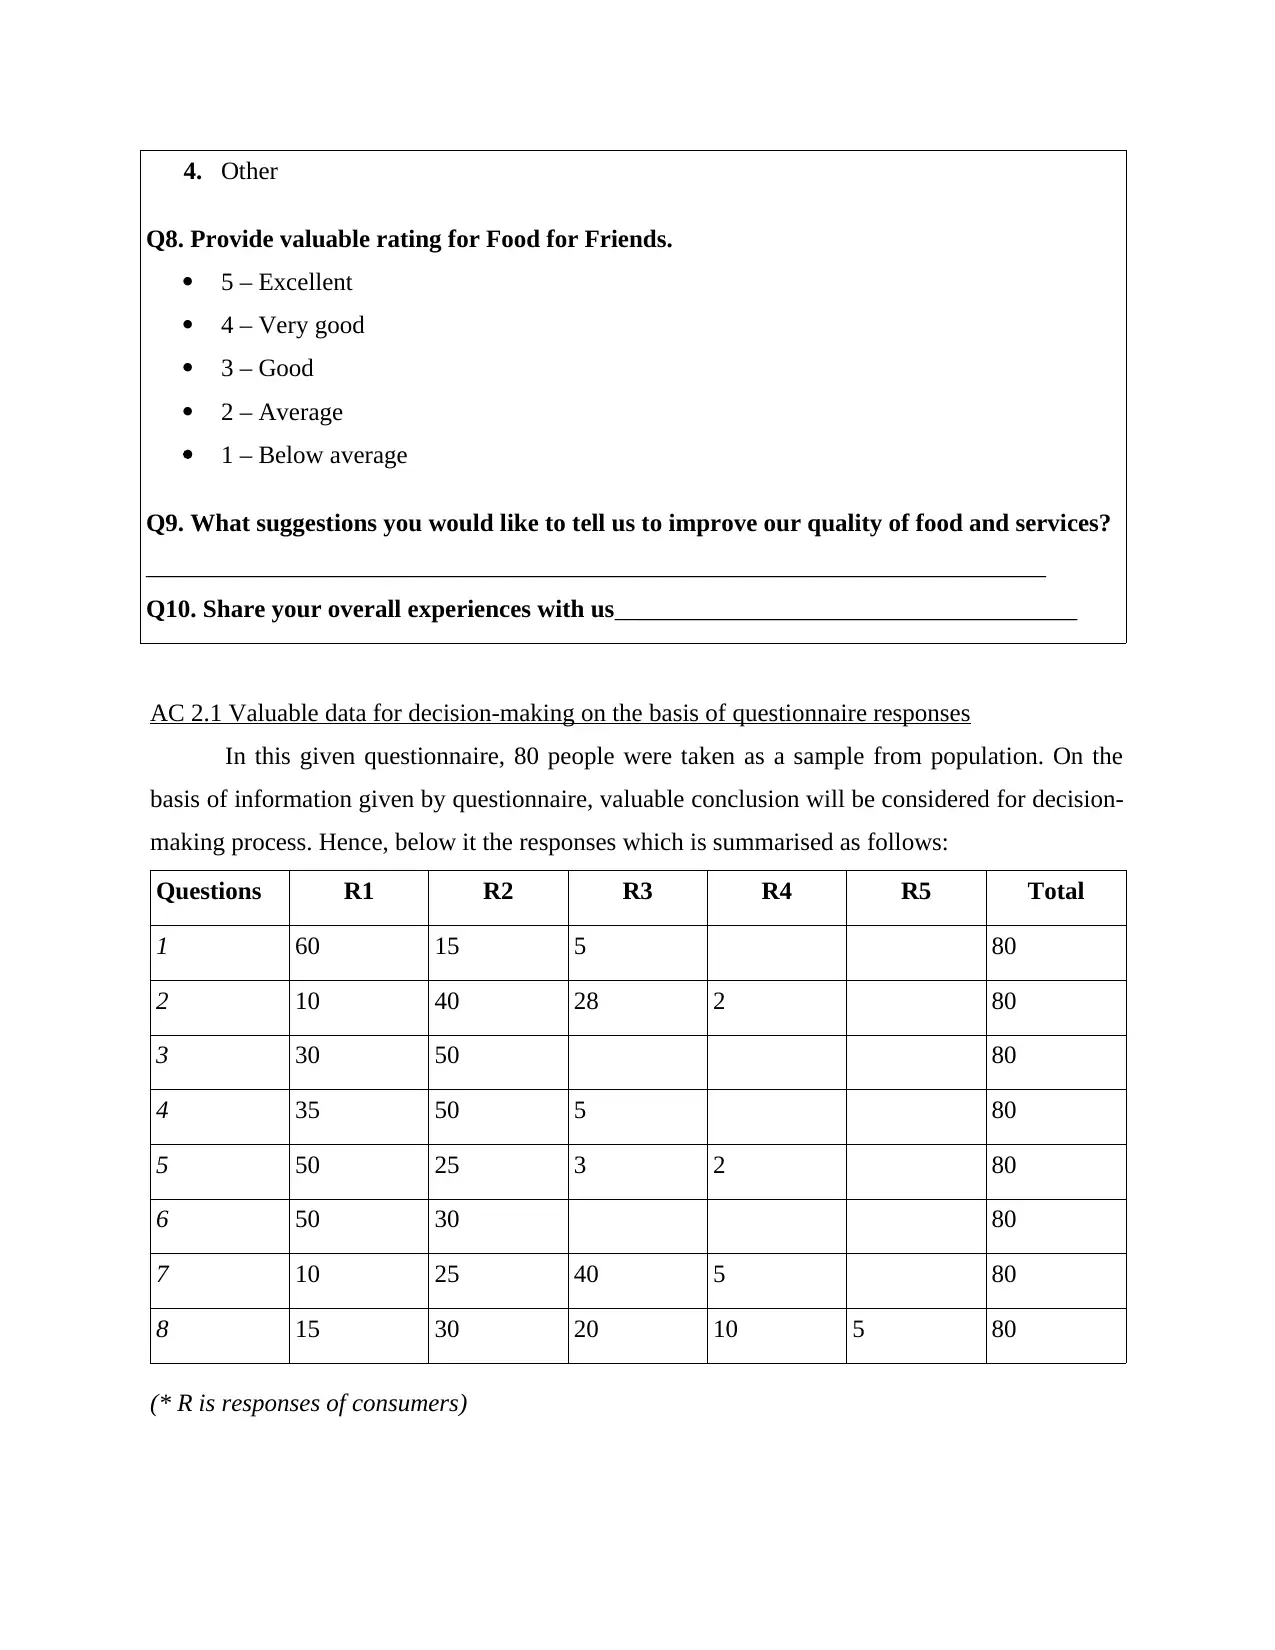
4. Other
Q8. Provide valuable rating for Food for Friends.
5 – Excellent
4 – Very good
3 – Good
2 – Average
1 – Below average
Q9. What suggestions you would like to tell us to improve our quality of food and services?
________________________________________________________________________
Q10. Share your overall experiences with us_____________________________________
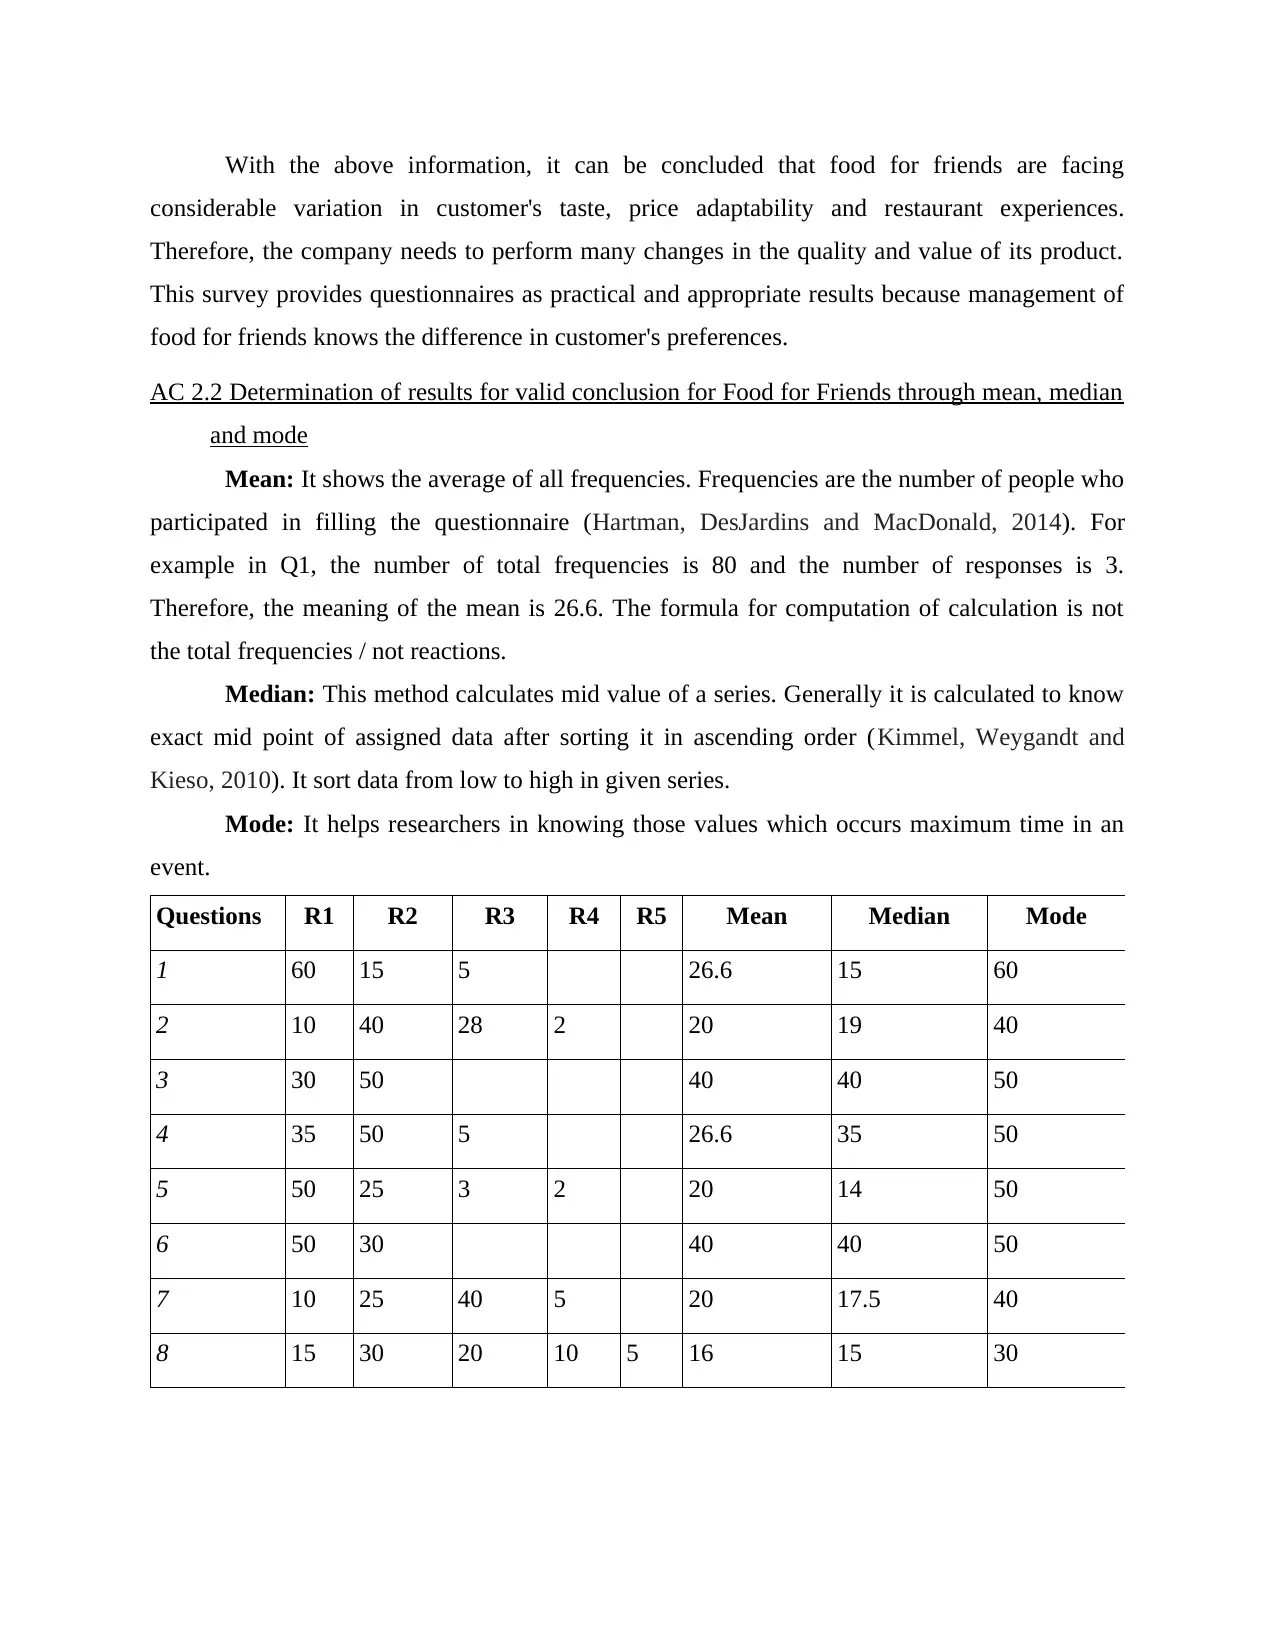
AC 2.1 Valuable data for decision-making on the basis of questionnaire responses
In this given questionnaire, 80 people were taken as a sample from population. On the
basis of information given by questionnaire, valuable conclusion will be considered for decision-
making process. Hence, below it the responses which is summarised as follows:
Questions R1 R2 R3 R4 R5 Total
1 60 15 5 80
2 10 40 28 2 80
3 30 50 80
4 35 50 5 80
5 50 25 3 2 80
6 50 30 80
7 10 25 40 5 80
8 15 30 20 10 5 80
(* R is responses of consumers)
Q8. Provide valuable rating for Food for Friends.
5 – Excellent
4 – Very good
3 – Good
2 – Average
1 – Below average
Q9. What suggestions you would like to tell us to improve our quality of food and services?
________________________________________________________________________
Q10. Share your overall experiences with us_____________________________________
AC 2.1 Valuable data for decision-making on the basis of questionnaire responses
In this given questionnaire, 80 people were taken as a sample from population. On the
basis of information given by questionnaire, valuable conclusion will be considered for decision-
making process. Hence, below it the responses which is summarised as follows:
Questions R1 R2 R3 R4 R5 Total
1 60 15 5 80
2 10 40 28 2 80
3 30 50 80
4 35 50 5 80
5 50 25 3 2 80
6 50 30 80
7 10 25 40 5 80
8 15 30 20 10 5 80
(* R is responses of consumers)
Paraphrase This Document
Need a fresh take? Get an instant paraphrase of this document with our AI Paraphraser
With the above information, it can be concluded that food for friends are facing
considerable variation in customer's taste, price adaptability and restaurant experiences.
Therefore, the company needs to perform many changes in the quality and value of its product.
This survey provides questionnaires as practical and appropriate results because management of
food for friends knows the difference in customer's preferences.
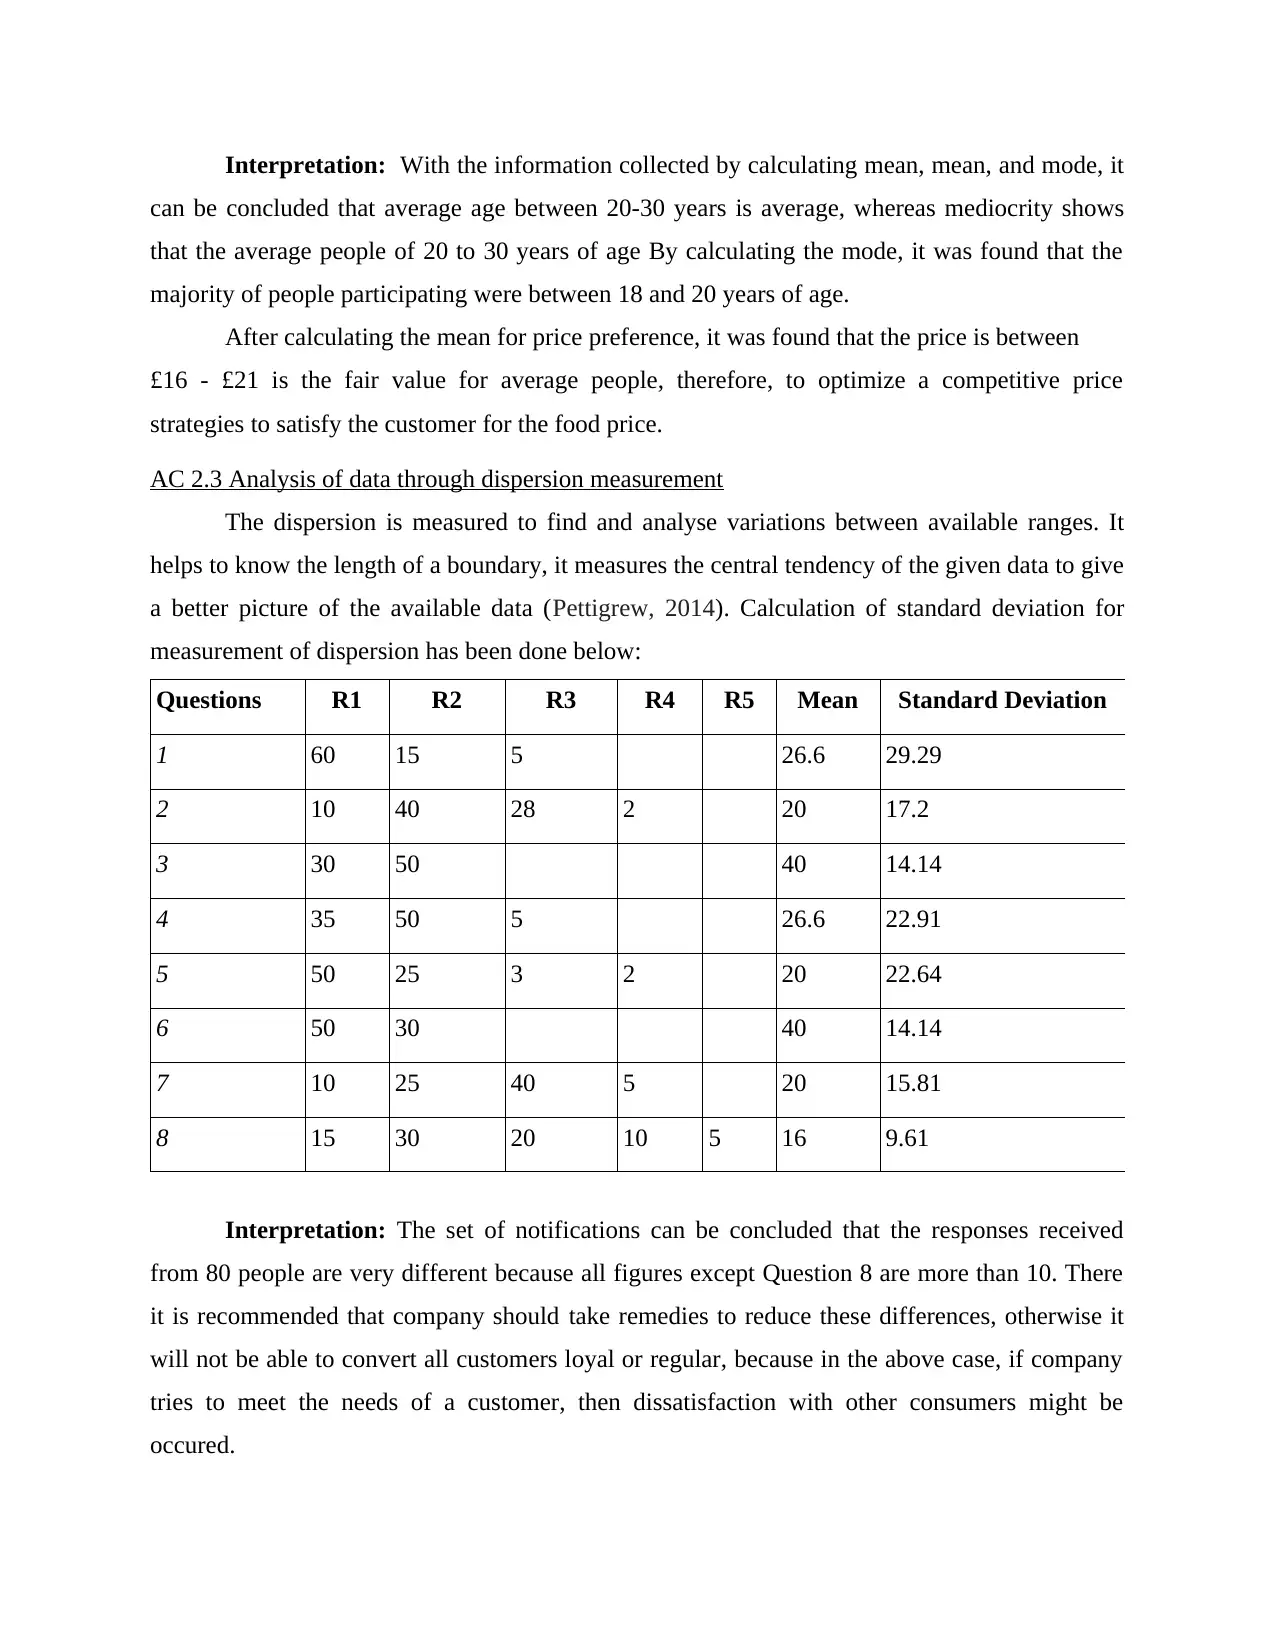
AC 2.2 Determination of results for valid conclusion for Food for Friends through mean, median
and mode
Mean: It shows the average of all frequencies. Frequencies are the number of people who
participated in filling the questionnaire (Hartman, DesJardins and MacDonald, 2014). For
example in Q1, the number of total frequencies is 80 and the number of responses is 3.
Therefore, the meaning of the mean is 26.6. The formula for computation of calculation is not
the total frequencies / not reactions.
Median: This method calculates mid value of a series. Generally it is calculated to know
exact mid point of assigned data after sorting it in ascending order (Kimmel, Weygandt and
Kieso, 2010). It sort data from low to high in given series.
Mode: It helps researchers in knowing those values which occurs maximum time in an
event.
Questions R1 R2 R3 R4 R5 Mean Median Mode
1 60 15 5 26.6 15 60
2 10 40 28 2 20 19 40
3 30 50 40 40 50
4 35 50 5 26.6 35 50
5 50 25 3 2 20 14 50
6 50 30 40 40 50
7 10 25 40 5 20 17.5 40
8 15 30 20 10 5 16 15 30
considerable variation in customer's taste, price adaptability and restaurant experiences.
Therefore, the company needs to perform many changes in the quality and value of its product.
This survey provides questionnaires as practical and appropriate results because management of
food for friends knows the difference in customer's preferences.
AC 2.2 Determination of results for valid conclusion for Food for Friends through mean, median
and mode
Mean: It shows the average of all frequencies. Frequencies are the number of people who
participated in filling the questionnaire (Hartman, DesJardins and MacDonald, 2014). For
example in Q1, the number of total frequencies is 80 and the number of responses is 3.
Therefore, the meaning of the mean is 26.6. The formula for computation of calculation is not
the total frequencies / not reactions.
Median: This method calculates mid value of a series. Generally it is calculated to know
exact mid point of assigned data after sorting it in ascending order (Kimmel, Weygandt and
Kieso, 2010). It sort data from low to high in given series.
Mode: It helps researchers in knowing those values which occurs maximum time in an
event.
Questions R1 R2 R3 R4 R5 Mean Median Mode
1 60 15 5 26.6 15 60
2 10 40 28 2 20 19 40
3 30 50 40 40 50
4 35 50 5 26.6 35 50
5 50 25 3 2 20 14 50
6 50 30 40 40 50
7 10 25 40 5 20 17.5 40
8 15 30 20 10 5 16 15 30
Interpretation: With the information collected by calculating mean, mean, and mode, it
can be concluded that average age between 20-30 years is average, whereas mediocrity shows
that the average people of 20 to 30 years of age By calculating the mode, it was found that the
majority of people participating were between 18 and 20 years of age.
After calculating the mean for price preference, it was found that the price is between
£16 - £21 is the fair value for average people, therefore, to optimize a competitive price
strategies to satisfy the customer for the food price.
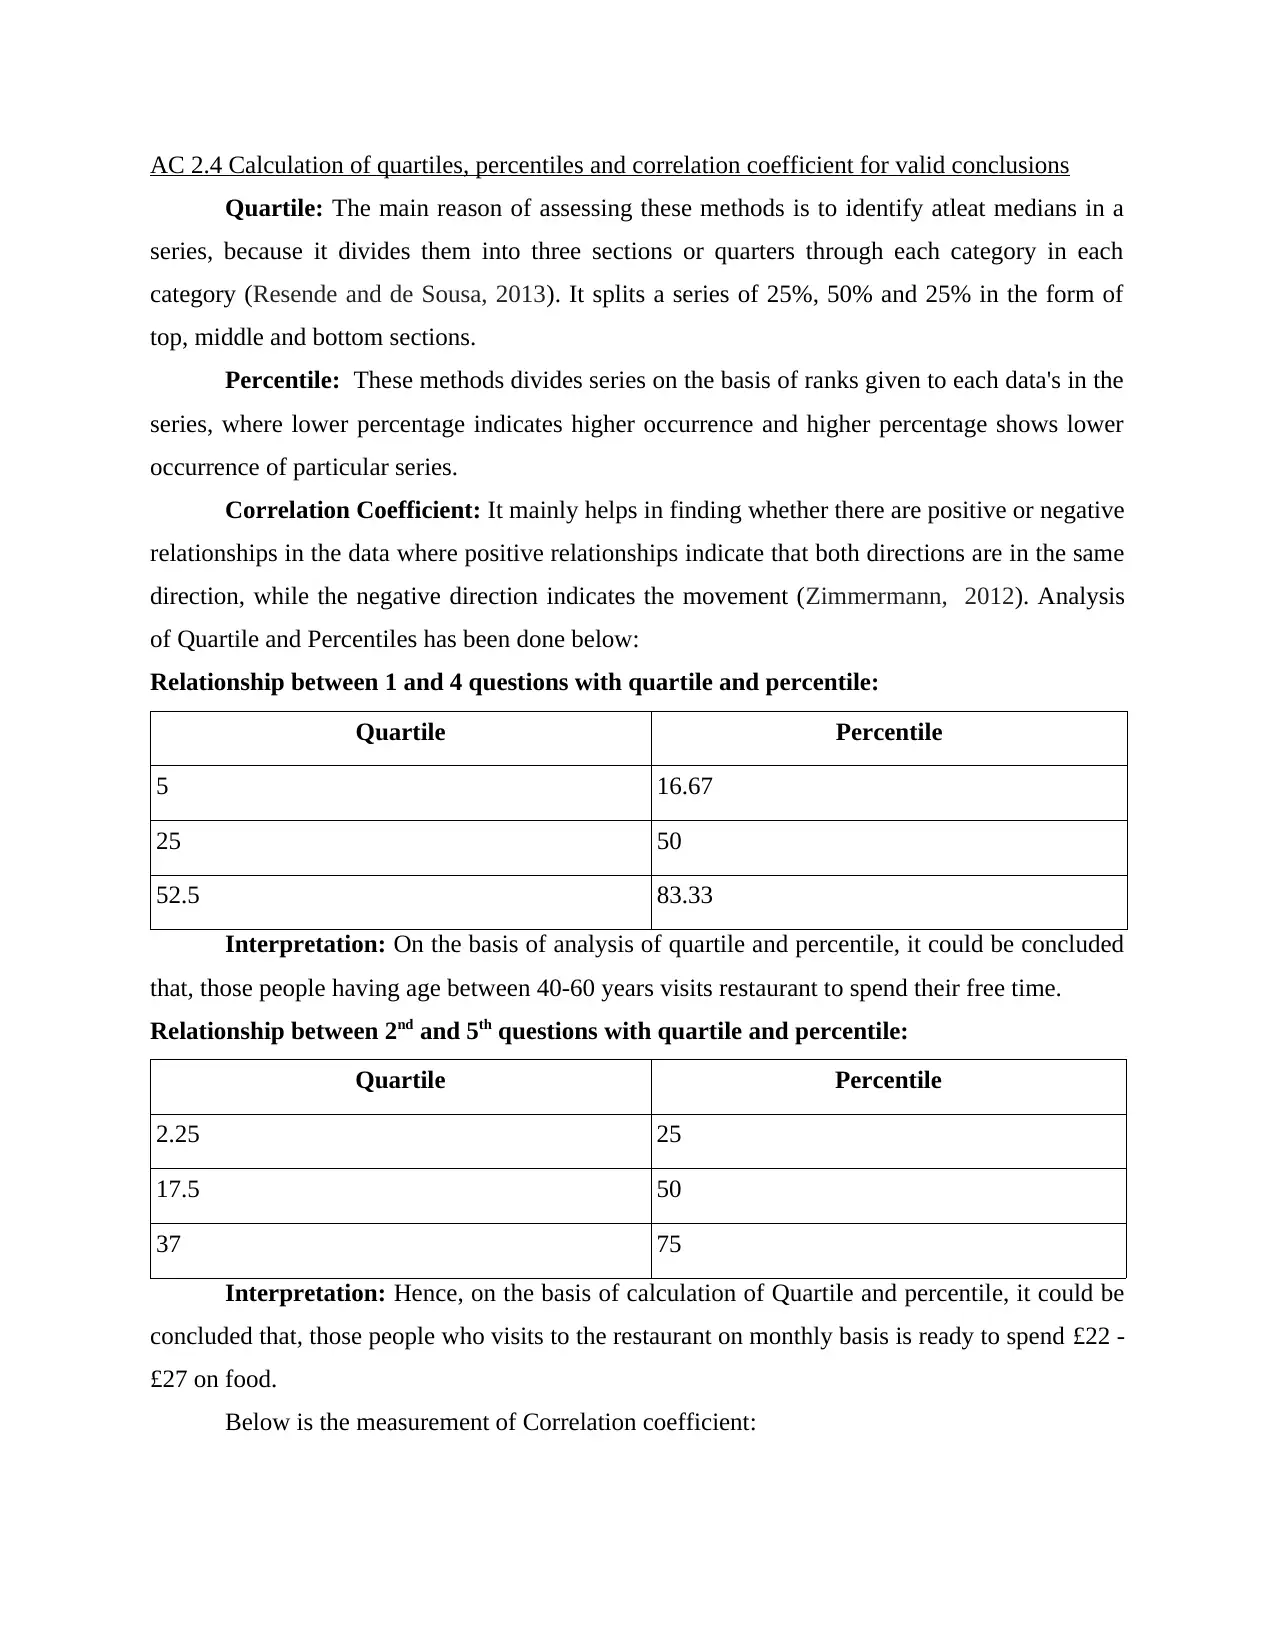
AC 2.3 Analysis of data through dispersion measurement
The dispersion is measured to find and analyse variations between available ranges. It
helps to know the length of a boundary, it measures the central tendency of the given data to give
a better picture of the available data (Pettigrew, 2014). Calculation of standard deviation for
measurement of dispersion has been done below:
Questions R1 R2 R3 R4 R5 Mean Standard Deviation
1 60 15 5 26.6 29.29
2 10 40 28 2 20 17.2
3 30 50 40 14.14
4 35 50 5 26.6 22.91
5 50 25 3 2 20 22.64
6 50 30 40 14.14
7 10 25 40 5 20 15.81
8 15 30 20 10 5 16 9.61
Interpretation: The set of notifications can be concluded that the responses received
from 80 people are very different because all figures except Question 8 are more than 10. There
it is recommended that company should take remedies to reduce these differences, otherwise it
will not be able to convert all customers loyal or regular, because in the above case, if company
tries to meet the needs of a customer, then dissatisfaction with other consumers might be
occured.
can be concluded that average age between 20-30 years is average, whereas mediocrity shows
that the average people of 20 to 30 years of age By calculating the mode, it was found that the
majority of people participating were between 18 and 20 years of age.
After calculating the mean for price preference, it was found that the price is between
£16 - £21 is the fair value for average people, therefore, to optimize a competitive price
strategies to satisfy the customer for the food price.
AC 2.3 Analysis of data through dispersion measurement
The dispersion is measured to find and analyse variations between available ranges. It
helps to know the length of a boundary, it measures the central tendency of the given data to give
a better picture of the available data (Pettigrew, 2014). Calculation of standard deviation for
measurement of dispersion has been done below:
Questions R1 R2 R3 R4 R5 Mean Standard Deviation
1 60 15 5 26.6 29.29
2 10 40 28 2 20 17.2
3 30 50 40 14.14
4 35 50 5 26.6 22.91
5 50 25 3 2 20 22.64
6 50 30 40 14.14
7 10 25 40 5 20 15.81
8 15 30 20 10 5 16 9.61
Interpretation: The set of notifications can be concluded that the responses received
from 80 people are very different because all figures except Question 8 are more than 10. There
it is recommended that company should take remedies to reduce these differences, otherwise it
will not be able to convert all customers loyal or regular, because in the above case, if company
tries to meet the needs of a customer, then dissatisfaction with other consumers might be
occured.
⊘ This is a preview!⊘
Do you want full access?
Subscribe today to unlock all pages.
Trusted by 1+ million students worldwide
AC 2.4 Calculation of quartiles, percentiles and correlation coefficient for valid conclusions
Quartile: The main reason of assessing these methods is to identify atleat medians in a
series, because it divides them into three sections or quarters through each category in each
category (Resende and de Sousa, 2013). It splits a series of 25%, 50% and 25% in the form of
top, middle and bottom sections.
Percentile: These methods divides series on the basis of ranks given to each data's in the
series, where lower percentage indicates higher occurrence and higher percentage shows lower
occurrence of particular series.
Correlation Coefficient: It mainly helps in finding whether there are positive or negative
relationships in the data where positive relationships indicate that both directions are in the same
direction, while the negative direction indicates the movement (Zimmermann, 2012). Analysis
of Quartile and Percentiles has been done below:
Relationship between 1 and 4 questions with quartile and percentile:
Quartile Percentile
5 16.67
25 50
52.5 83.33
Interpretation: On the basis of analysis of quartile and percentile, it could be concluded
that, those people having age between 40-60 years visits restaurant to spend their free time.
Relationship between 2nd and 5th questions with quartile and percentile:
Quartile Percentile
2.25 25
17.5 50
37 75
Interpretation: Hence, on the basis of calculation of Quartile and percentile, it could be
concluded that, those people who visits to the restaurant on monthly basis is ready to spend £22 -
£27 on food.
Below is the measurement of Correlation coefficient:
Paraphrase This Document
Need a fresh take? Get an instant paraphrase of this document with our AI Paraphraser
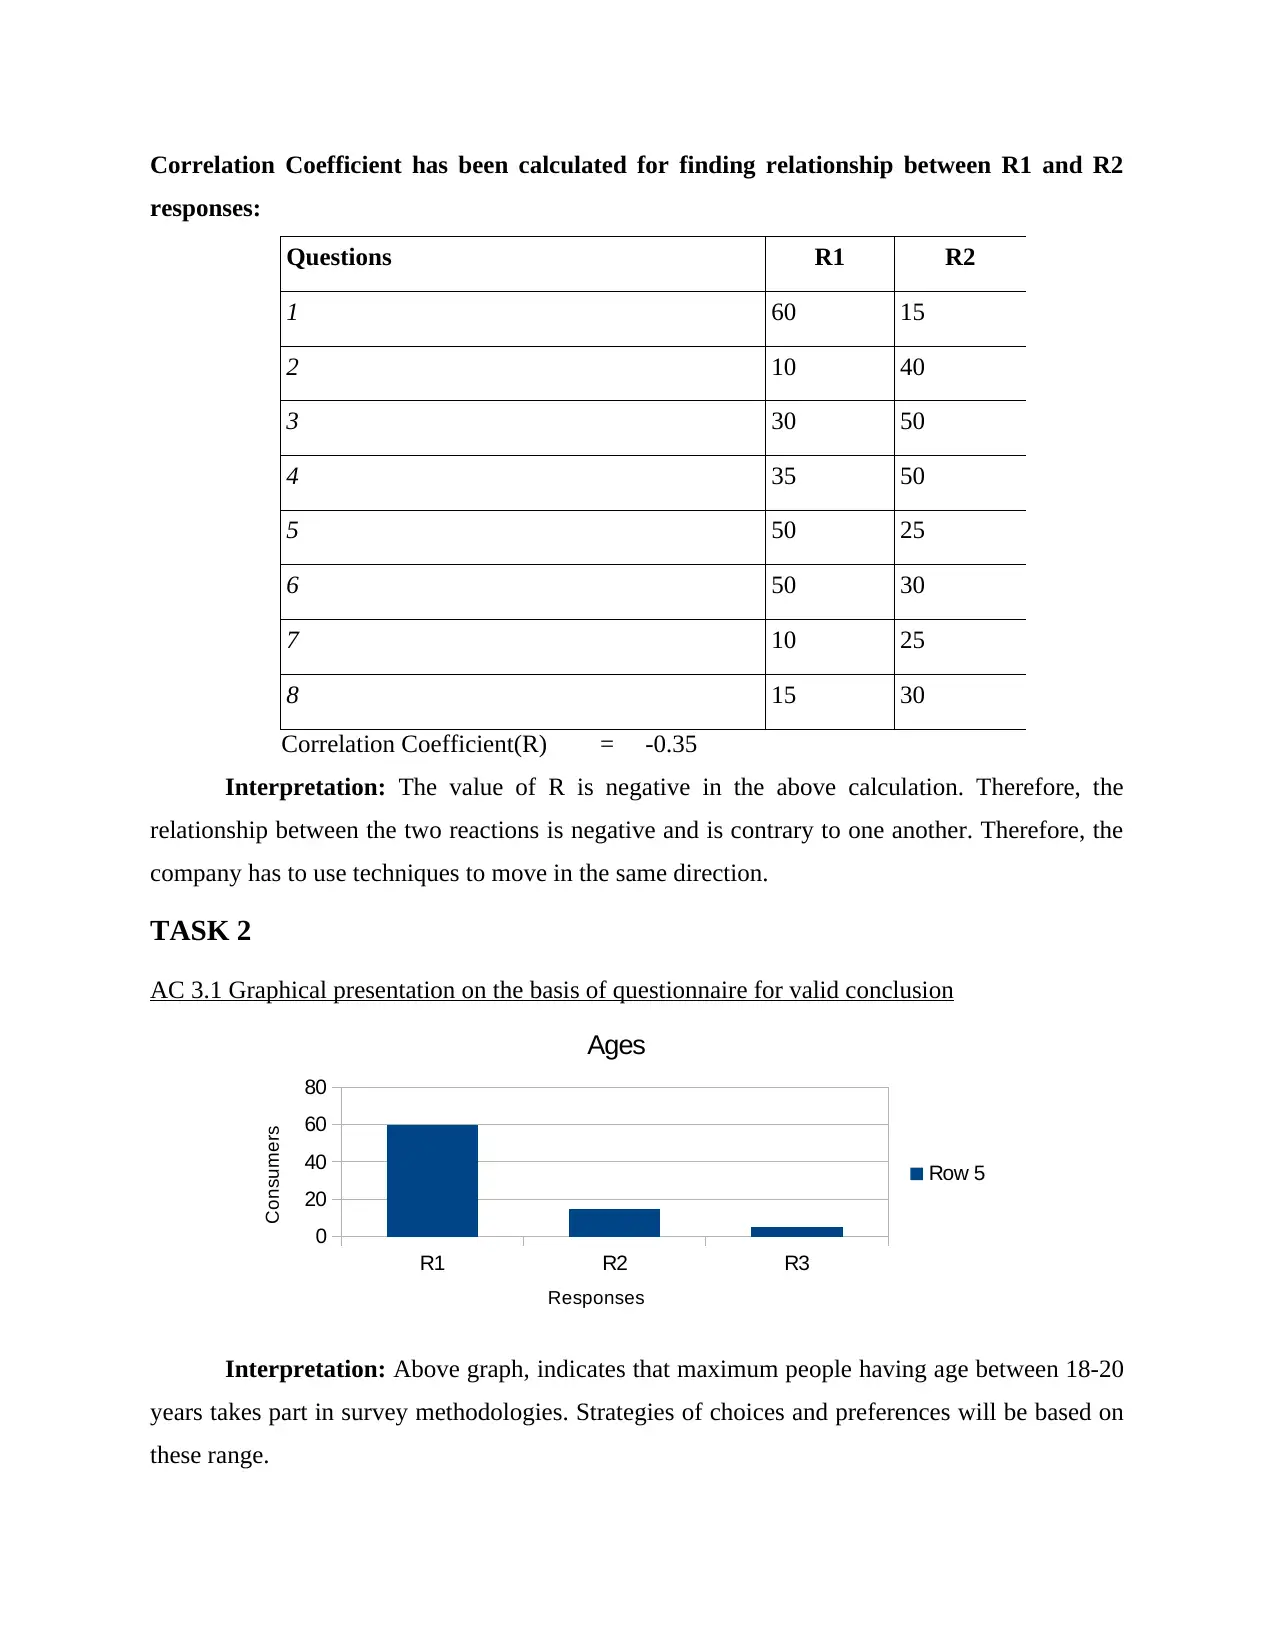
Correlation Coefficient has been calculated for finding relationship between R1 and R2
responses:
Questions R1 R2
1 60 15
2 10 40
3 30 50
4 35 50
5 50 25
6 50 30
7 10 25
8 15 30
Correlation Coefficient(R) = -0.35
Interpretation: The value of R is negative in the above calculation. Therefore, the
relationship between the two reactions is negative and is contrary to one another. Therefore, the
company has to use techniques to move in the same direction.
TASK 2
AC 3.1 Graphical presentation on the basis of questionnaire for valid conclusion
Interpretation: Above graph, indicates that maximum people having age between 18-20
years takes part in survey methodologies. Strategies of choices and preferences will be based on
these range.
R1 R2 R3
0
20
40
60
80
Ages
Row 5
Responses
Consumers
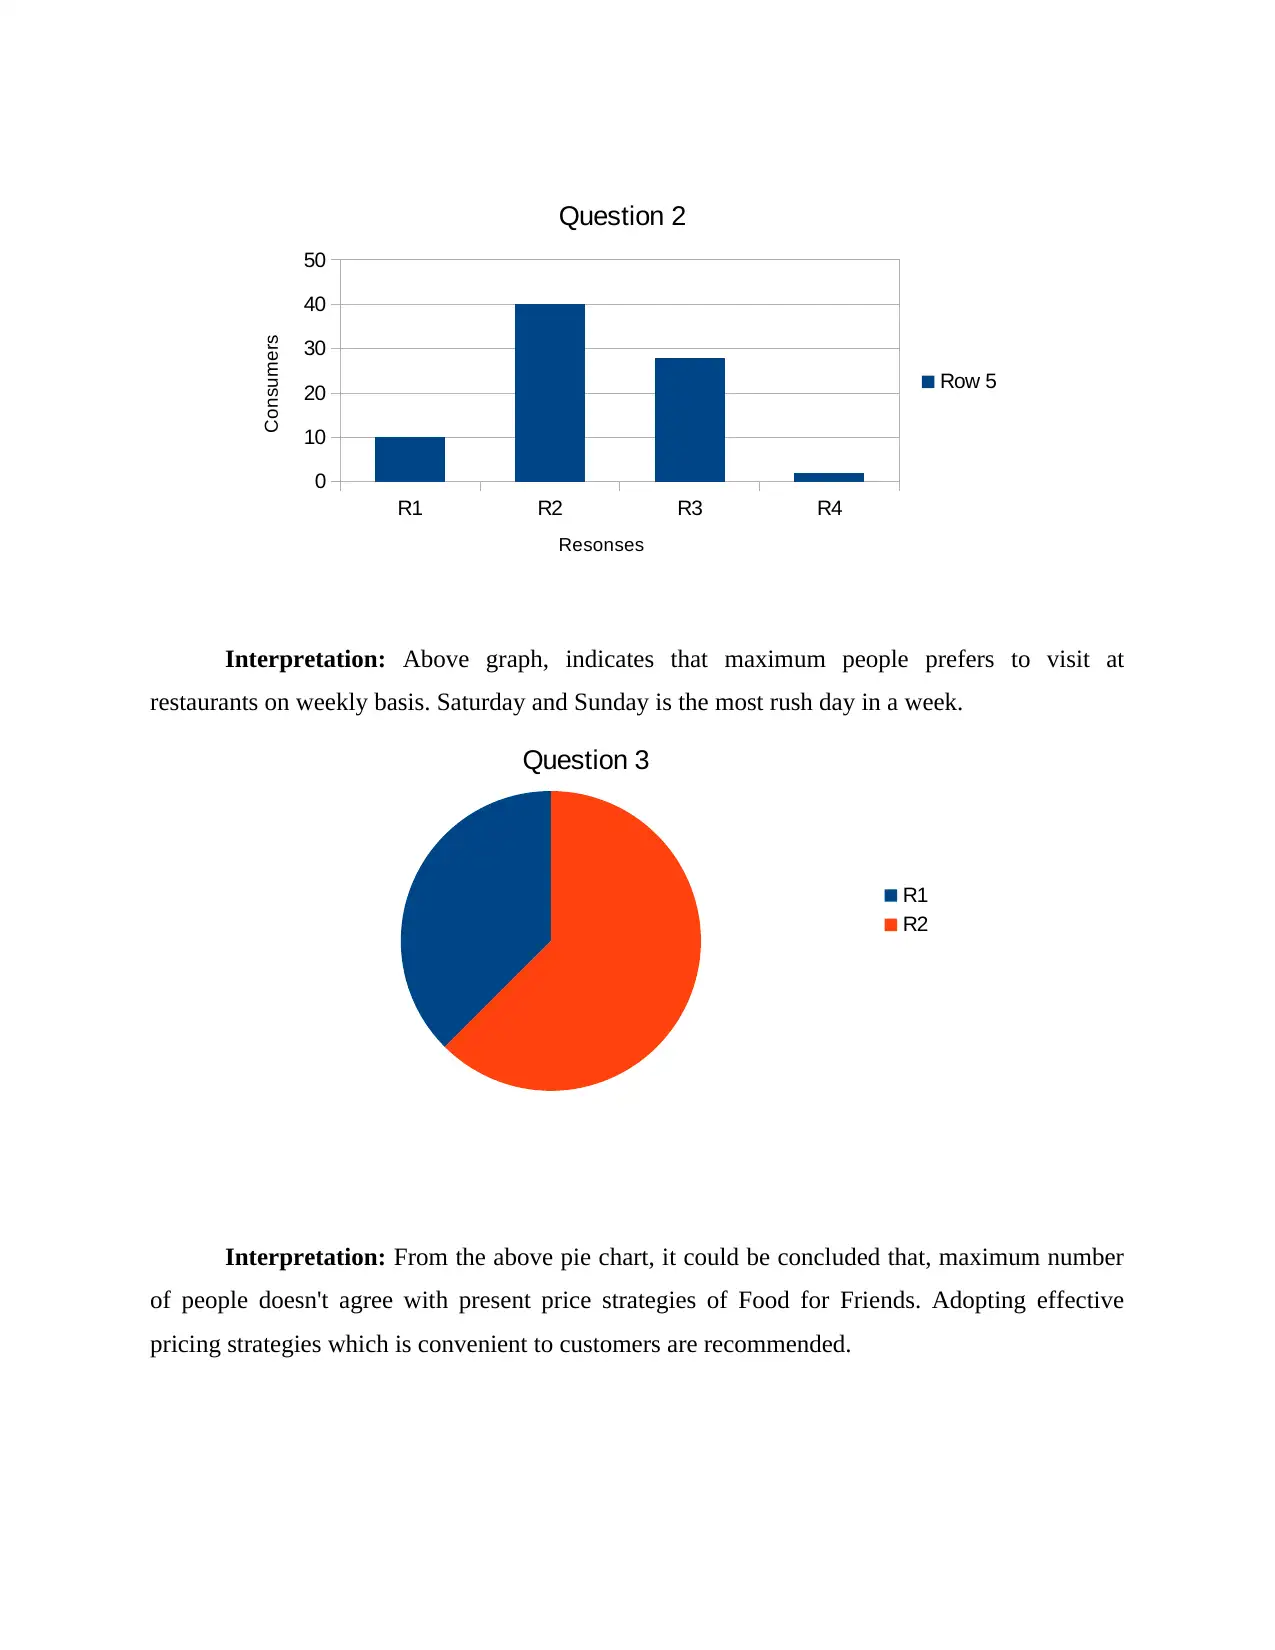
Interpretation: Above graph, indicates that maximum people prefers to visit at
restaurants on weekly basis. Saturday and Sunday is the most rush day in a week.
Interpretation: From the above pie chart, it could be concluded that, maximum number
of people doesn't agree with present price strategies of Food for Friends. Adopting effective
pricing strategies which is convenient to customers are recommended.
R1 R2 R3 R4
0
10
20
30
40
50
Question 2
Row 5
Resonses
Consumers
Question 3
R1
R2
⊘ This is a preview!⊘
Do you want full access?
Subscribe today to unlock all pages.
Trusted by 1+ million students worldwide
1 out of 63
Related Documents


Your All-in-One AI-Powered Toolkit for Academic Success.
+13062052269
info@desklib.com
Available 24*7 on WhatsApp / Email
![[object Object]](/_next/static/media/star-bottom.7253800d.svg)
Unlock your academic potential
Copyright © 2020–2026 A2Z Services. All Rights Reserved. Developed and managed by ZUCOL.