Business Decision Making Report: Data Analysis and Business Insights
VerifiedAdded on 2020/06/06
|20
|4099
|99
Report
AI Summary
This report provides a detailed analysis of business decision-making processes, focusing on a case study of Murano restaurant. The report begins by outlining data collection methods, including primary and secondary research, sampling techniques, and questionnaire design. It then delves into data analysis, utilizing mean, median, mode, and measures of dispersion to interpret collected data. The second part of the report focuses on data visualization through charts and graphs, creating trend lines for future forecasting, and preparing a formal business report. It also covers information processing tools, critical path management, and the benefits of financial tools in decision-making. The report aims to offer insights into effective decision-making strategies and techniques for business management. This report is available on Desklib, a platform offering a wide range of AI-based study tools for students.

BUSINESS
DECISION
MAKING
DECISION
MAKING
Paraphrase This Document
Need a fresh take? Get an instant paraphrase of this document with our AI Paraphraser
Table of Contents
INTRODUCTION ..........................................................................................................................1
TASK 1............................................................................................................................................1
Use of plan in collecting data through primary and secondary format.......................................1
1.2 Use of sampling method and survey methodology...............................................................2
1.3 Use of questionnaire in relation to data.................................................................................3
2.1 Creation of information on the basis of questionnaire..........................................................4
2.2 Use of mean, median and mode and its analysis...................................................................5
2.3 Data using measure of dispersion with including standard deviation...................................6
2.4 Benefits of quartile, percentile and correlation coefficient in business context....................6
TASK 2............................................................................................................................................7
3.1 Preparation of charts, graphs in making a valid conclusion..................................................7
3.2 Creation of trend lines in future forecasting.......................................................................11
3.3 Business presentation..........................................................................................................12
3.4 Formal business report to senior authority..........................................................................12
Task 3.............................................................................................................................................12
4.1 Information processing tools ..............................................................................................12
4.2 Formation of critical path management..............................................................................13
4.3 Benefits of financial tools in relation to make beneficial decision.....................................14
CONCLUSION .............................................................................................................................15
References .....................................................................................................................................17
INTRODUCTION
Decision making one of the most significant part in the company in order to make their
decision making. It is also a critical part which required to collect various information from the
different sources from the market and make decision more effective for the future success
(Zimmerman and Yahya-Zadeh, 2011). This element is useful for as new business venture to
understand the overall environment and tries to develop their products and service more popular
in the market. This part is related with the Murano which is a small business and operate in the
city of London. The present report is talking about the various aspects of management decision
making by using different tools and techniques such as questionnaire. Along with this gathered
data will be analysed and evaluated by suing various graphs, charts, tables to make their decision
more effective (Brown and et. al., 2010).
TASK 1
Use of plan in collecting data through primary and secondary format
Primary data: By using this research method all information is collect regarding the topic.
It is collected personally by any individual which may be quantitative and qualitative form. The
data which is collected by person is unique for his research project as no one else access it
(Gigerenzer and Gaissmaier, 2011). It takes more time, cost and efforts as all data collected
personally to make report. There are various methods of collecting primary data such as:
• Questionnaires
• Interviews
• Observations
• Case study
Therefore, it is most important for researcher to select appropriate method which help him in
acquiring more and more information related to the topic.
Secondary data: Through this method the existing information or data can be collected by
available source (Provost and Fawcett, 2013). It is gathered by someone else and data was
collected for different purpose. It involves less cost, less time and less efforts as it is being
reused. There are some sources of secondary data which are as follows:
• Previous research
• web information
• Government report
1
⊘ This is a preview!⊘
Do you want full access?
Subscribe today to unlock all pages.
Trusted by 1+ million students worldwide
• Books
• Journals
• Census
• Libraries
By using all these sources researcher can collect applicable information on the topic. It is most
faster process for collecting information or data only requires right source from where data can
be collected (Lunenburg, 2011).
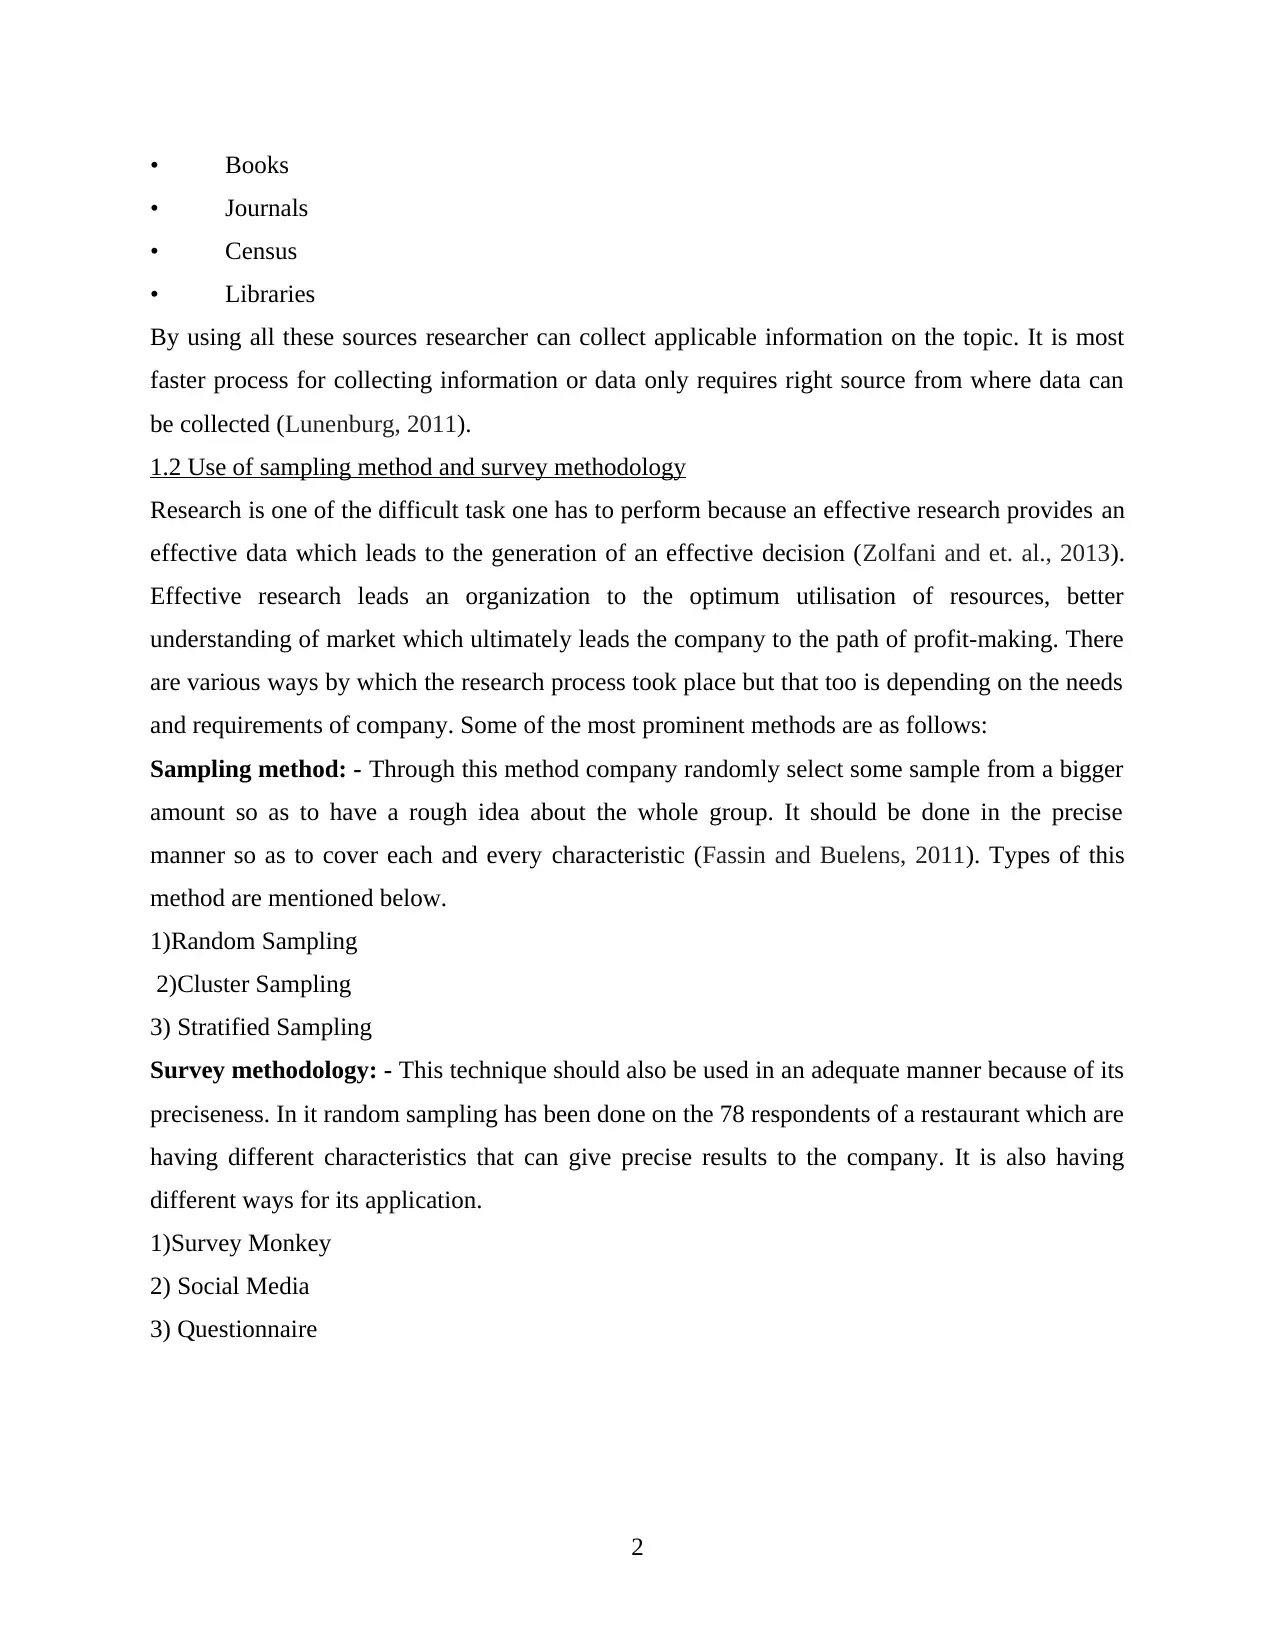
1.2 Use of sampling method and survey methodology
Research is one of the difficult task one has to perform because an effective research provides an
effective data which leads to the generation of an effective decision (Zolfani and et. al., 2013).
Effective research leads an organization to the optimum utilisation of resources, better
understanding of market which ultimately leads the company to the path of profit-making. There
are various ways by which the research process took place but that too is depending on the needs
and requirements of company. Some of the most prominent methods are as follows:
Sampling method: - Through this method company randomly select some sample from a bigger
amount so as to have a rough idea about the whole group. It should be done in the precise
manner so as to cover each and every characteristic (Fassin and Buelens, 2011). Types of this
method are mentioned below.
1)Random Sampling
2)Cluster Sampling
3) Stratified Sampling
Survey methodology: - This technique should also be used in an adequate manner because of its
preciseness. In it random sampling has been done on the 78 respondents of a restaurant which are
having different characteristics that can give precise results to the company. It is also having
different ways for its application.
1)Survey Monkey
2) Social Media
3) Questionnaire
2
• Journals
• Census
• Libraries
By using all these sources researcher can collect applicable information on the topic. It is most
faster process for collecting information or data only requires right source from where data can
be collected (Lunenburg, 2011).
1.2 Use of sampling method and survey methodology
Research is one of the difficult task one has to perform because an effective research provides an
effective data which leads to the generation of an effective decision (Zolfani and et. al., 2013).
Effective research leads an organization to the optimum utilisation of resources, better
understanding of market which ultimately leads the company to the path of profit-making. There
are various ways by which the research process took place but that too is depending on the needs
and requirements of company. Some of the most prominent methods are as follows:
Sampling method: - Through this method company randomly select some sample from a bigger
amount so as to have a rough idea about the whole group. It should be done in the precise
manner so as to cover each and every characteristic (Fassin and Buelens, 2011). Types of this
method are mentioned below.
1)Random Sampling
2)Cluster Sampling
3) Stratified Sampling
Survey methodology: - This technique should also be used in an adequate manner because of its
preciseness. In it random sampling has been done on the 78 respondents of a restaurant which are
having different characteristics that can give precise results to the company. It is also having
different ways for its application.
1)Survey Monkey
2) Social Media
3) Questionnaire
2
Paraphrase This Document
Need a fresh take? Get an instant paraphrase of this document with our AI Paraphraser
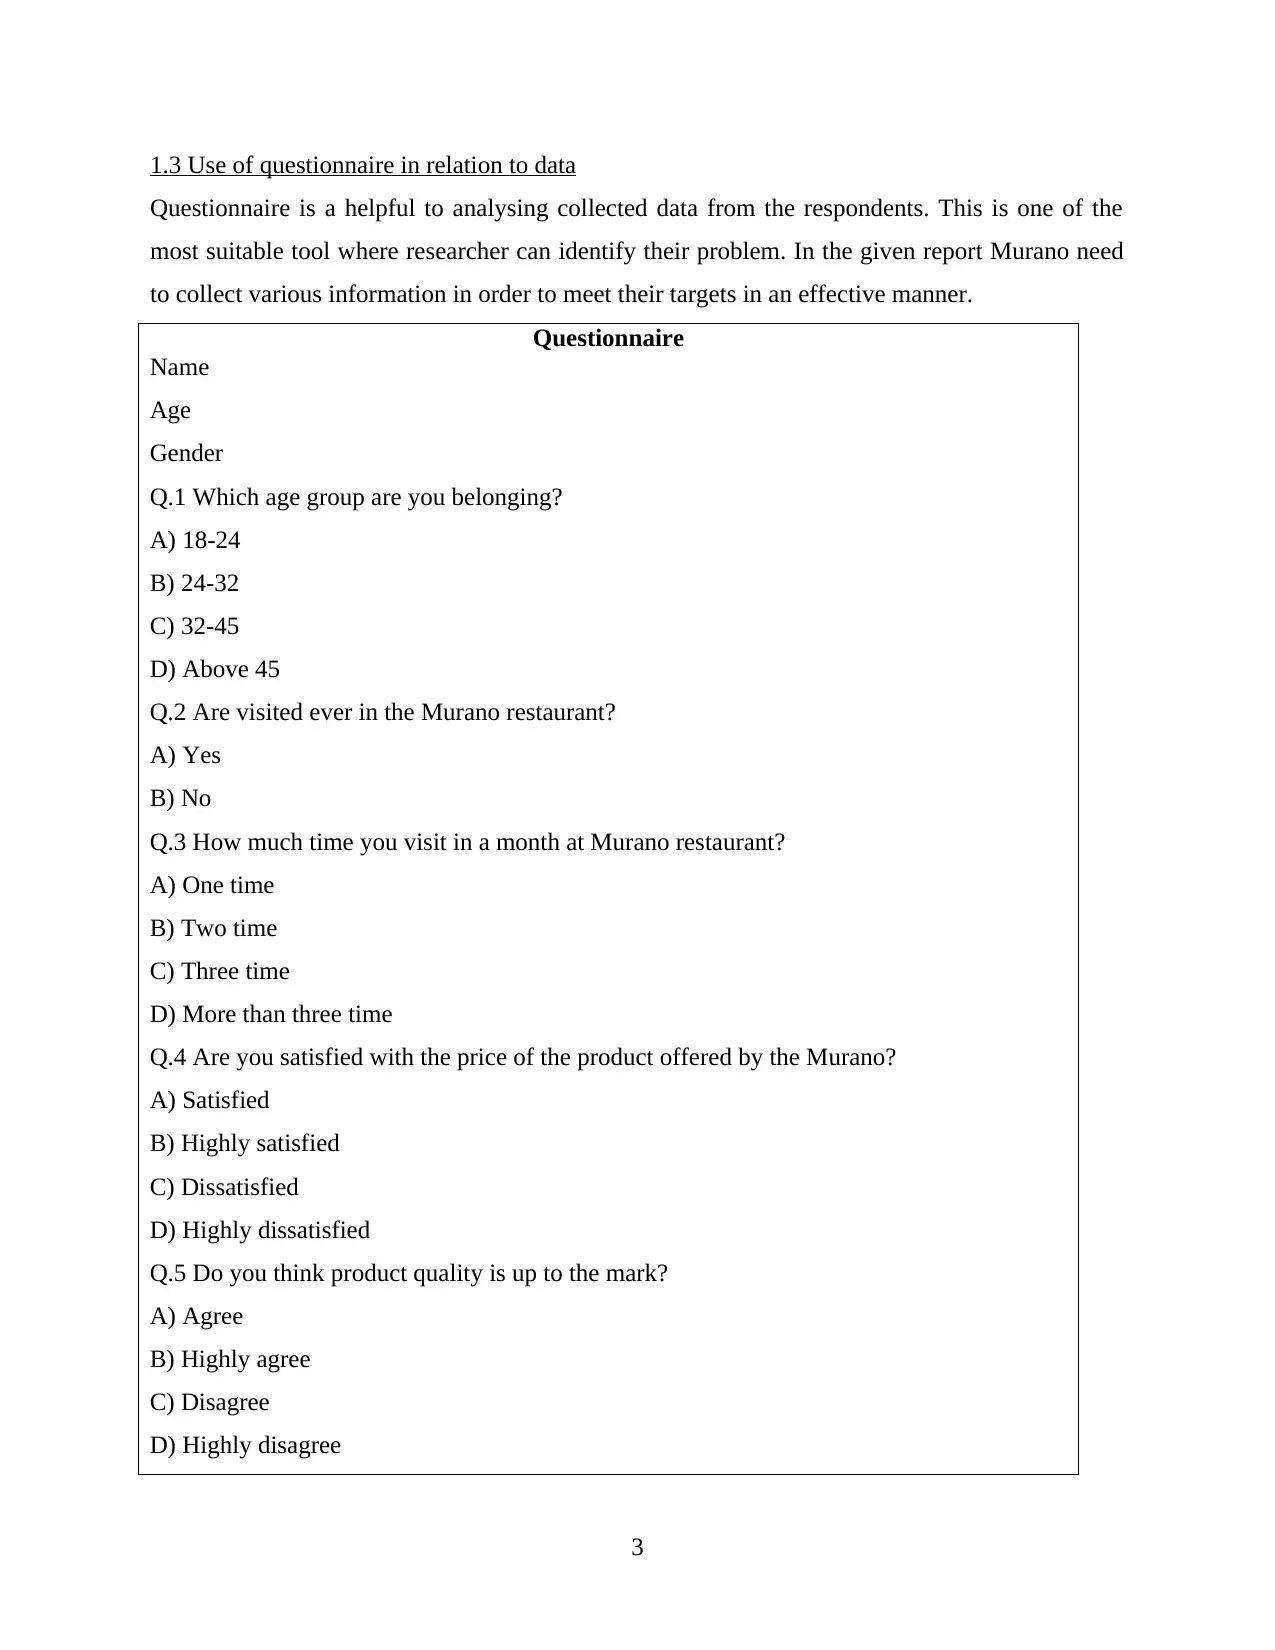
1.3 Use of questionnaire in relation to data
Questionnaire is a helpful to analysing collected data from the respondents. This is one of the
most suitable tool where researcher can identify their problem. In the given report Murano need
to collect various information in order to meet their targets in an effective manner.
Questionnaire
Name
Age
Gender
Q.1 Which age group are you belonging?
A) 18-24
B) 24-32
C) 32-45
D) Above 45
Q.2 Are visited ever in the Murano restaurant?
A) Yes
B) No
Q.3 How much time you visit in a month at Murano restaurant?
A) One time
B) Two time
C) Three time
D) More than three time
Q.4 Are you satisfied with the price of the product offered by the Murano?
A) Satisfied
B) Highly satisfied
C) Dissatisfied
D) Highly dissatisfied
Q.5 Do you think product quality is up to the mark?
A) Agree
B) Highly agree
C) Disagree
D) Highly disagree
3
Q.6 What is the most attractive element at Murano coffee?
A) Price
B) Product
C) Place
D) Promotion
Q.7 Do you thing Murano store location are attractive?
A) Yes
B) No
Q.8 Which mode of transport you prefer for visit?
A) Public transport
B) Private transport
C) Any other
Q.9 Please rate our services as par the given scale?
A) *****
B) ****
C) ***
D) **
E) *
2.1 Creation of information on the basis of questionnaire
Creating information as par the questionnaire, researcher is required to carry out their collected
information and meet and represent these data and analyse in an appropriate manner.
4
⊘ This is a preview!⊘
Do you want full access?
Subscribe today to unlock all pages.
Trusted by 1+ million students worldwide
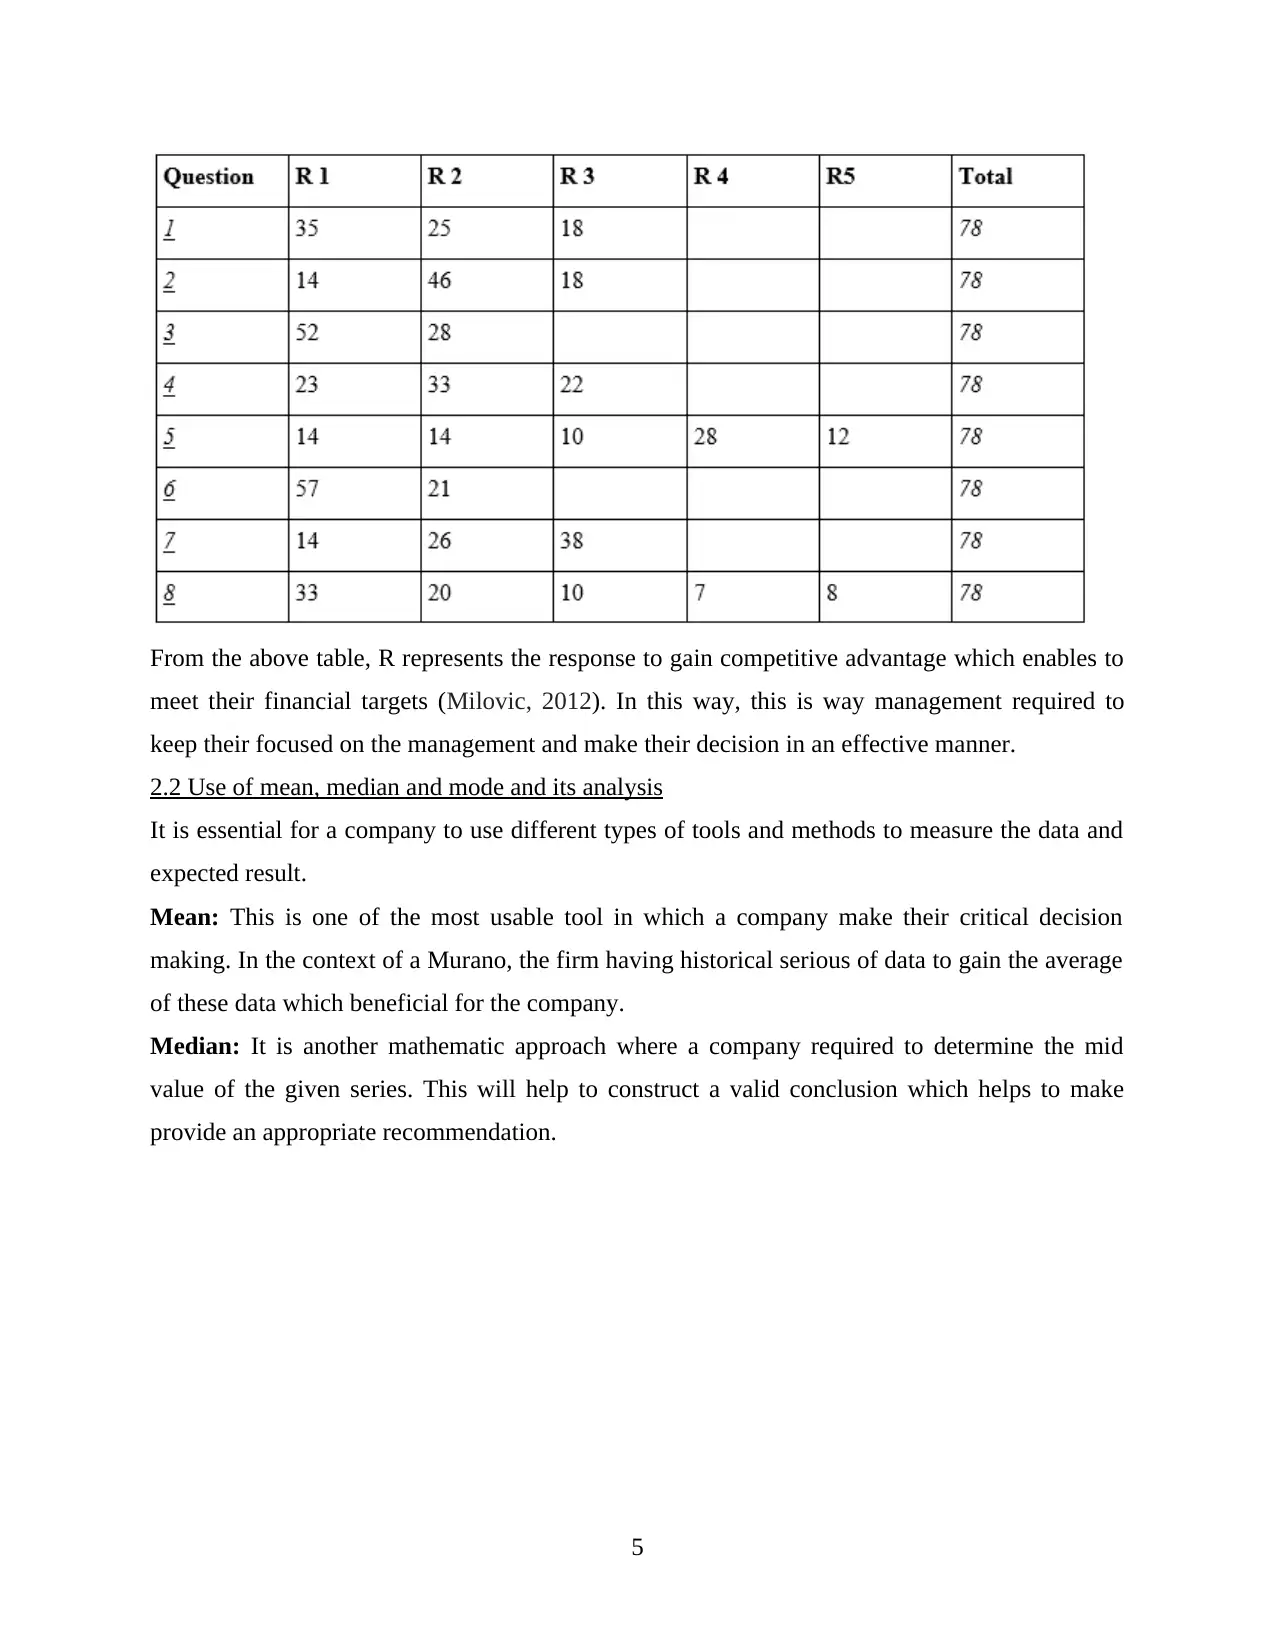
From the above table, R represents the response to gain competitive advantage which enables to
meet their financial targets (Milovic, 2012). In this way, this is way management required to
keep their focused on the management and make their decision in an effective manner.
2.2 Use of mean, median and mode and its analysis
It is essential for a company to use different types of tools and methods to measure the data and
expected result.
Mean: This is one of the most usable tool in which a company make their critical decision
making. In the context of a Murano, the firm having historical serious of data to gain the average
of these data which beneficial for the company.
Median: It is another mathematic approach where a company required to determine the mid
value of the given series. This will help to construct a valid conclusion which helps to make
provide an appropriate recommendation.
5
Paraphrase This Document
Need a fresh take? Get an instant paraphrase of this document with our AI Paraphraser
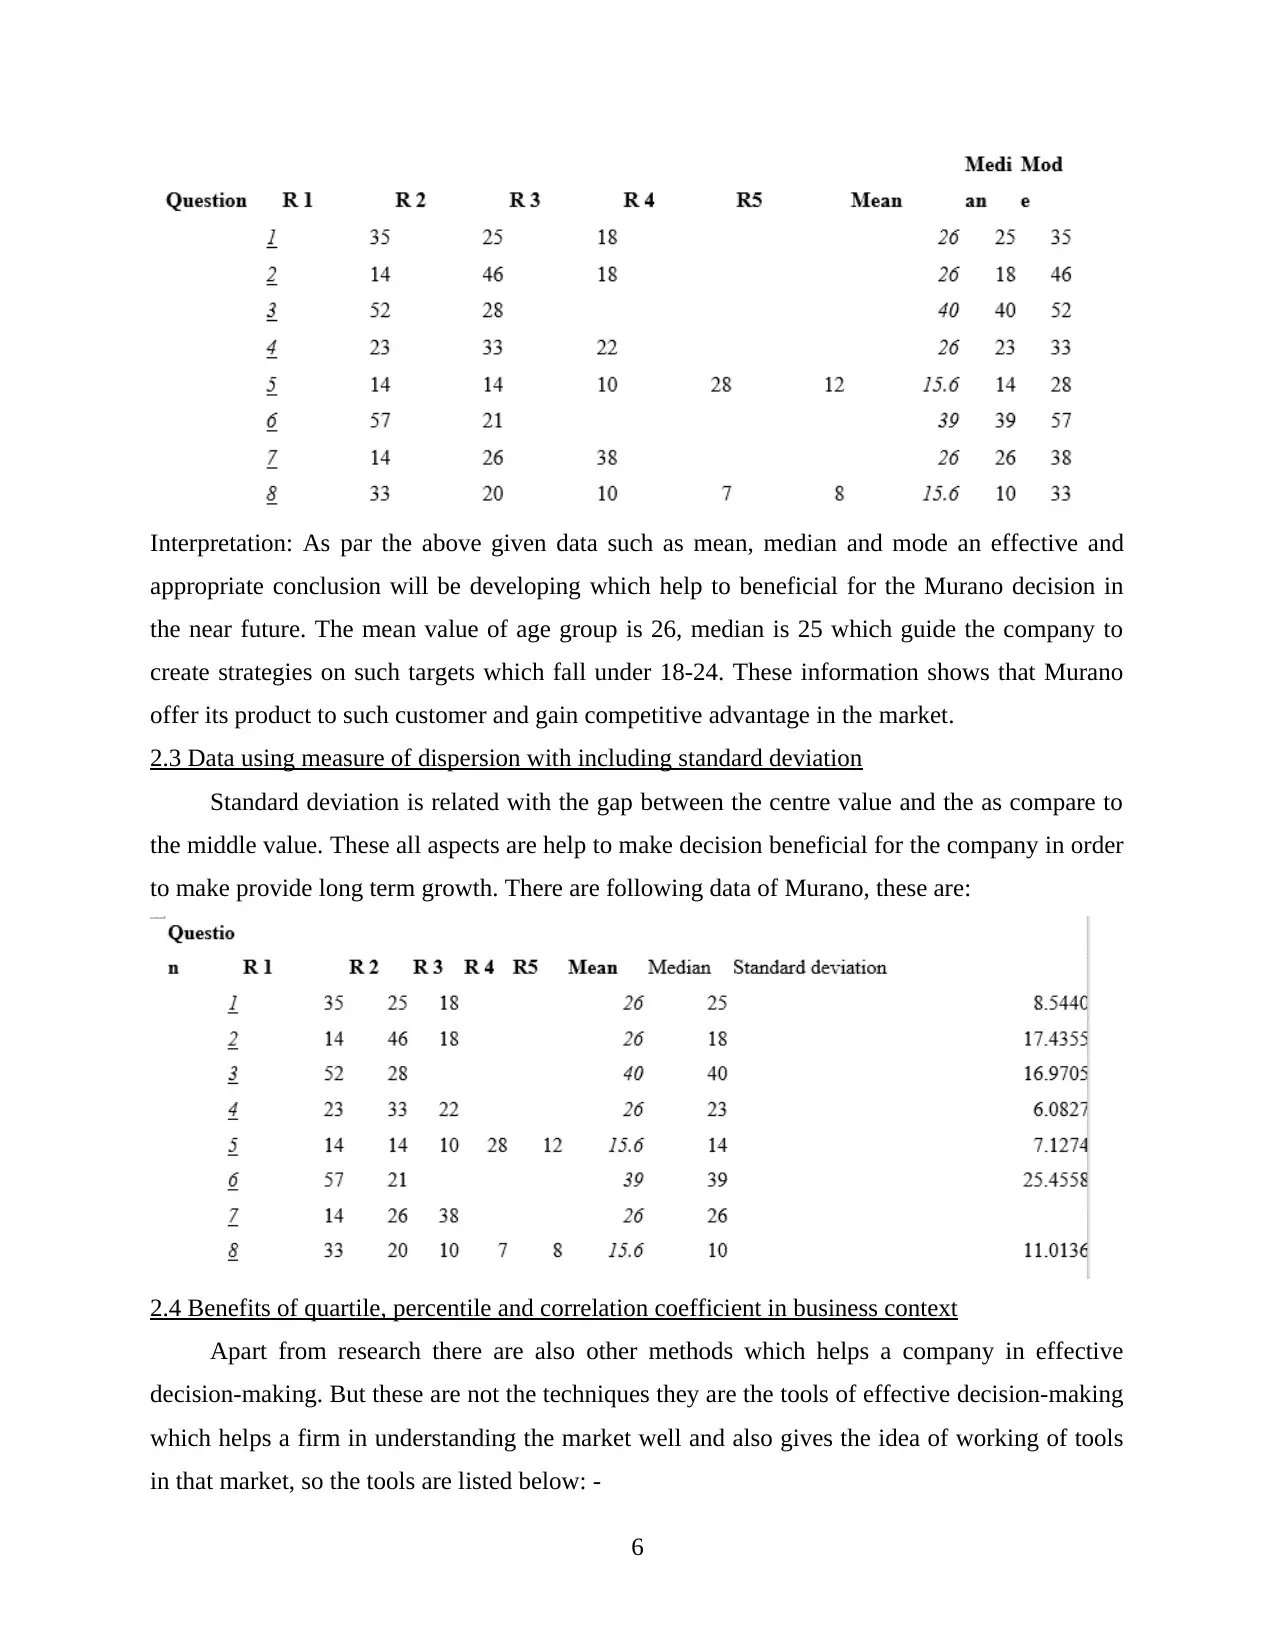
Interpretation: As par the above given data such as mean, median and mode an effective and
appropriate conclusion will be developing which help to beneficial for the Murano decision in
the near future. The mean value of age group is 26, median is 25 which guide the company to
create strategies on such targets which fall under 18-24. These information shows that Murano
offer its product to such customer and gain competitive advantage in the market.
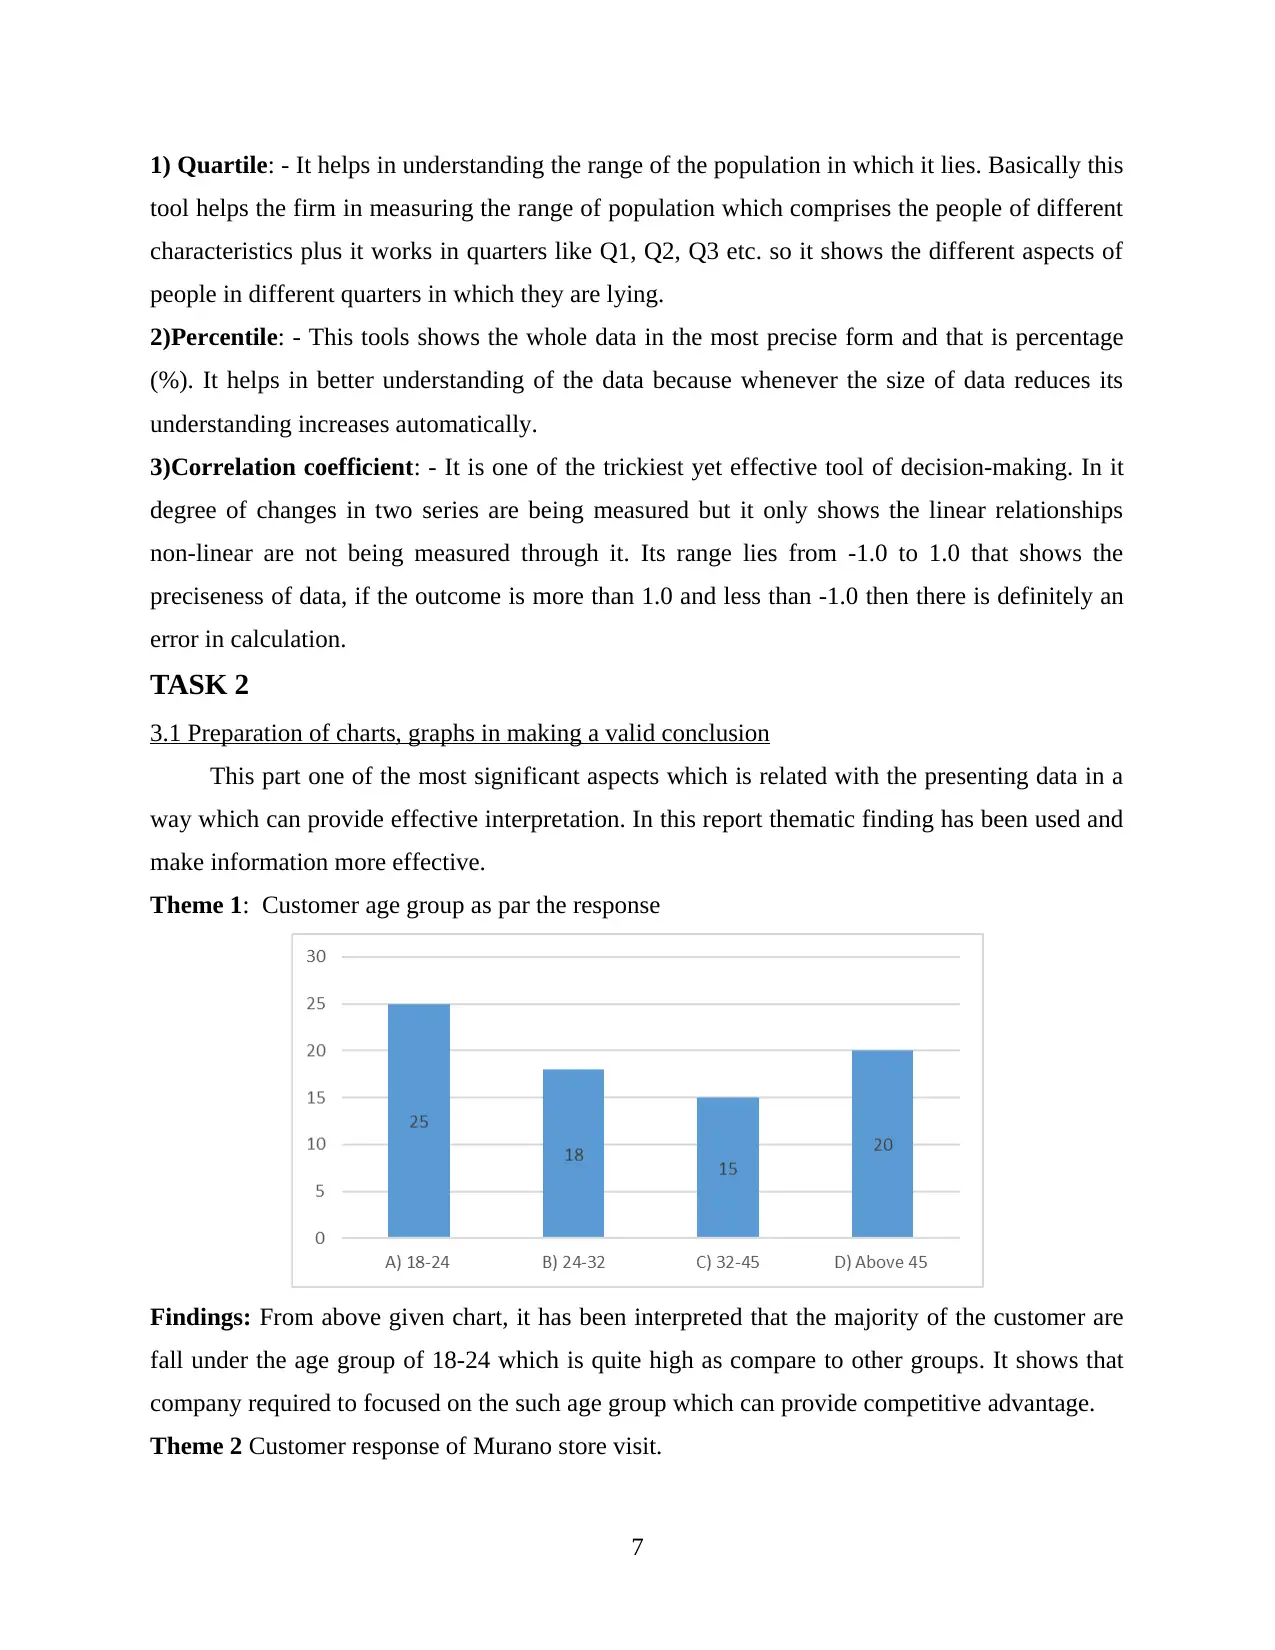
2.3 Data using measure of dispersion with including standard deviation
Standard deviation is related with the gap between the centre value and the as compare to
the middle value. These all aspects are help to make decision beneficial for the company in order
to make provide long term growth. There are following data of Murano, these are:
2.4 Benefits of quartile, percentile and correlation coefficient in business context
Apart from research there are also other methods which helps a company in effective
decision-making. But these are not the techniques they are the tools of effective decision-making
which helps a firm in understanding the market well and also gives the idea of working of tools
in that market, so the tools are listed below: -
6
appropriate conclusion will be developing which help to beneficial for the Murano decision in
the near future. The mean value of age group is 26, median is 25 which guide the company to
create strategies on such targets which fall under 18-24. These information shows that Murano
offer its product to such customer and gain competitive advantage in the market.
2.3 Data using measure of dispersion with including standard deviation
Standard deviation is related with the gap between the centre value and the as compare to
the middle value. These all aspects are help to make decision beneficial for the company in order
to make provide long term growth. There are following data of Murano, these are:
2.4 Benefits of quartile, percentile and correlation coefficient in business context
Apart from research there are also other methods which helps a company in effective
decision-making. But these are not the techniques they are the tools of effective decision-making
which helps a firm in understanding the market well and also gives the idea of working of tools
in that market, so the tools are listed below: -
6
1) Quartile: - It helps in understanding the range of the population in which it lies. Basically this
tool helps the firm in measuring the range of population which comprises the people of different
characteristics plus it works in quarters like Q1, Q2, Q3 etc. so it shows the different aspects of
people in different quarters in which they are lying.
2)Percentile: - This tools shows the whole data in the most precise form and that is percentage
(%). It helps in better understanding of the data because whenever the size of data reduces its
understanding increases automatically.
3)Correlation coefficient: - It is one of the trickiest yet effective tool of decision-making. In it
degree of changes in two series are being measured but it only shows the linear relationships
non-linear are not being measured through it. Its range lies from -1.0 to 1.0 that shows the
preciseness of data, if the outcome is more than 1.0 and less than -1.0 then there is definitely an
error in calculation.
TASK 2
3.1 Preparation of charts, graphs in making a valid conclusion
This part one of the most significant aspects which is related with the presenting data in a
way which can provide effective interpretation. In this report thematic finding has been used and
make information more effective.
Theme 1: Customer age group as par the response
Findings: From above given chart, it has been interpreted that the majority of the customer are
fall under the age group of 18-24 which is quite high as compare to other groups. It shows that
company required to focused on the such age group which can provide competitive advantage.
Theme 2 Customer response of Murano store visit.
7
⊘ This is a preview!⊘
Do you want full access?
Subscribe today to unlock all pages.
Trusted by 1+ million students worldwide
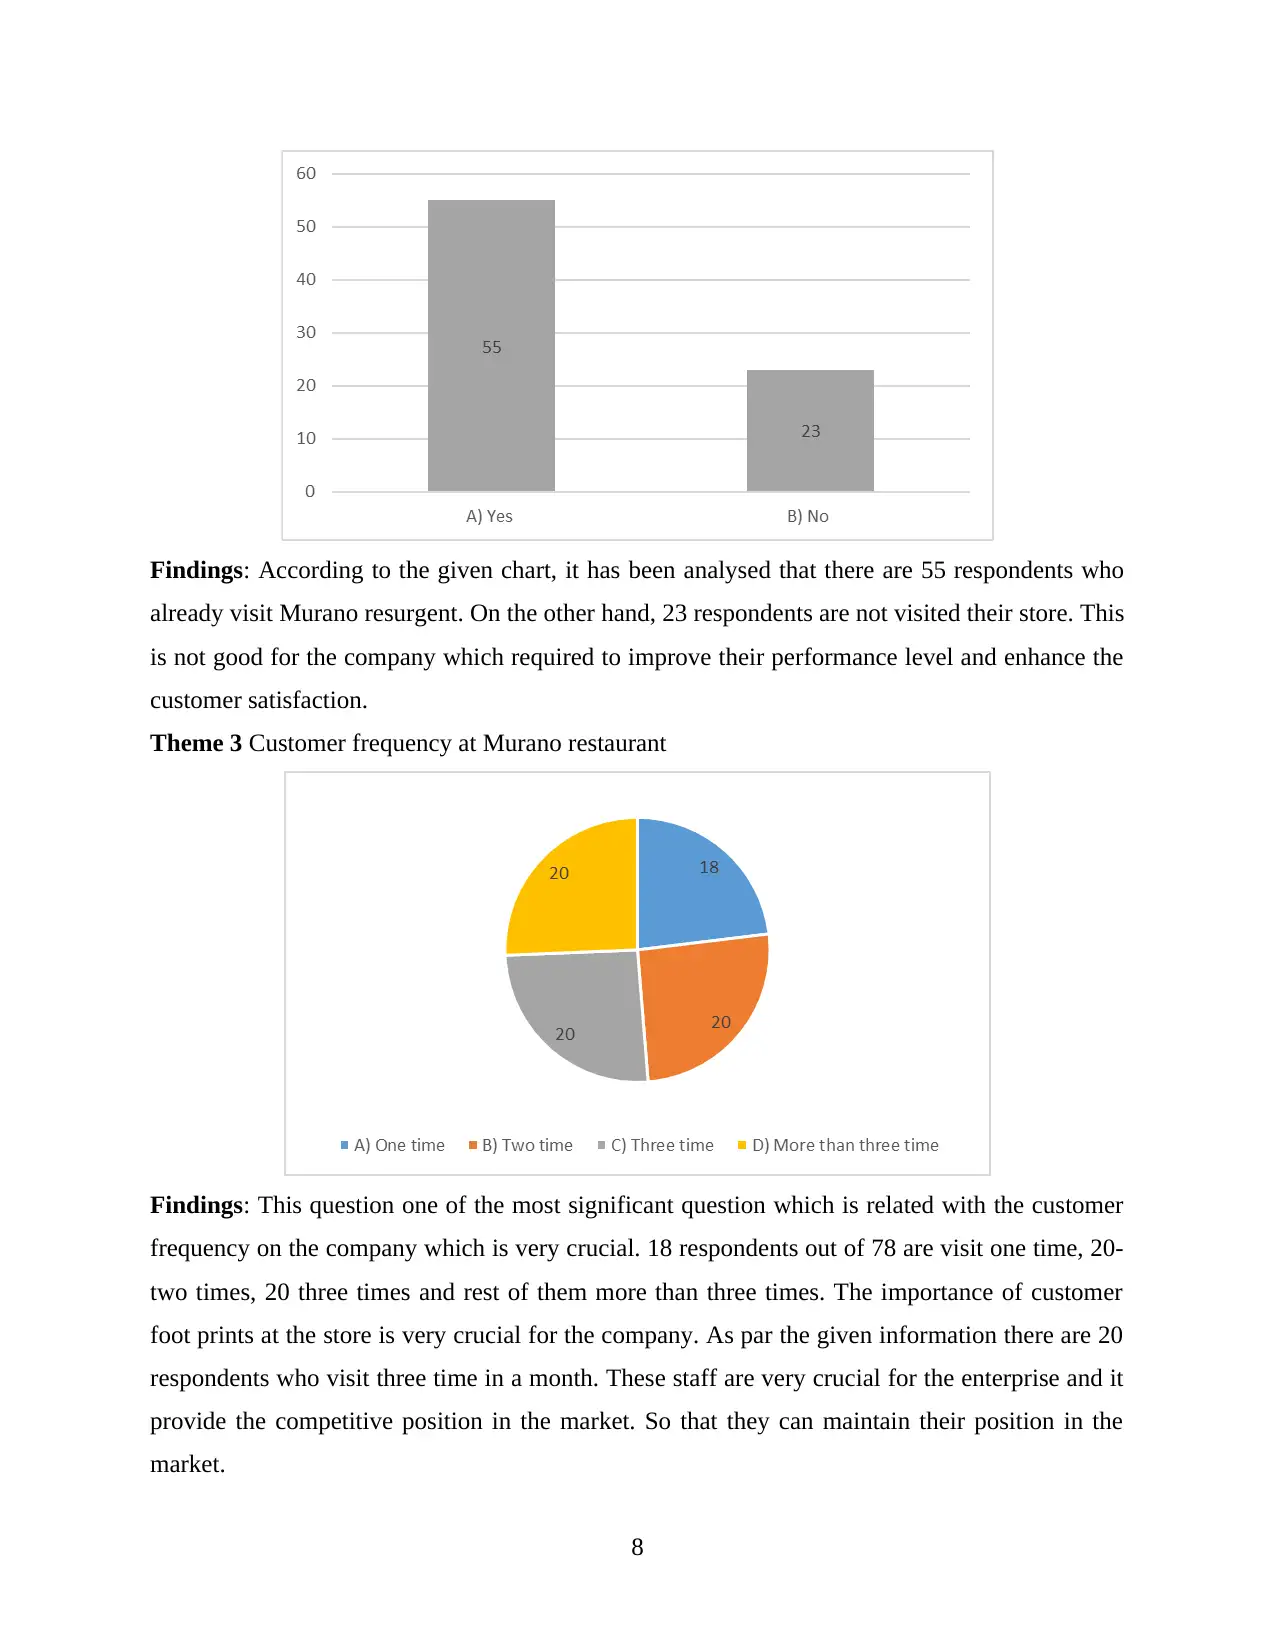
Findings: According to the given chart, it has been analysed that there are 55 respondents who
already visit Murano resurgent. On the other hand, 23 respondents are not visited their store. This
is not good for the company which required to improve their performance level and enhance the
customer satisfaction.
Theme 3 Customer frequency at Murano restaurant
Findings: This question one of the most significant question which is related with the customer
frequency on the company which is very crucial. 18 respondents out of 78 are visit one time, 20-
two times, 20 three times and rest of them more than three times. The importance of customer
foot prints at the store is very crucial for the company. As par the given information there are 20
respondents who visit three time in a month. These staff are very crucial for the enterprise and it
provide the competitive position in the market. So that they can maintain their position in the
market.
8
Paraphrase This Document
Need a fresh take? Get an instant paraphrase of this document with our AI Paraphraser
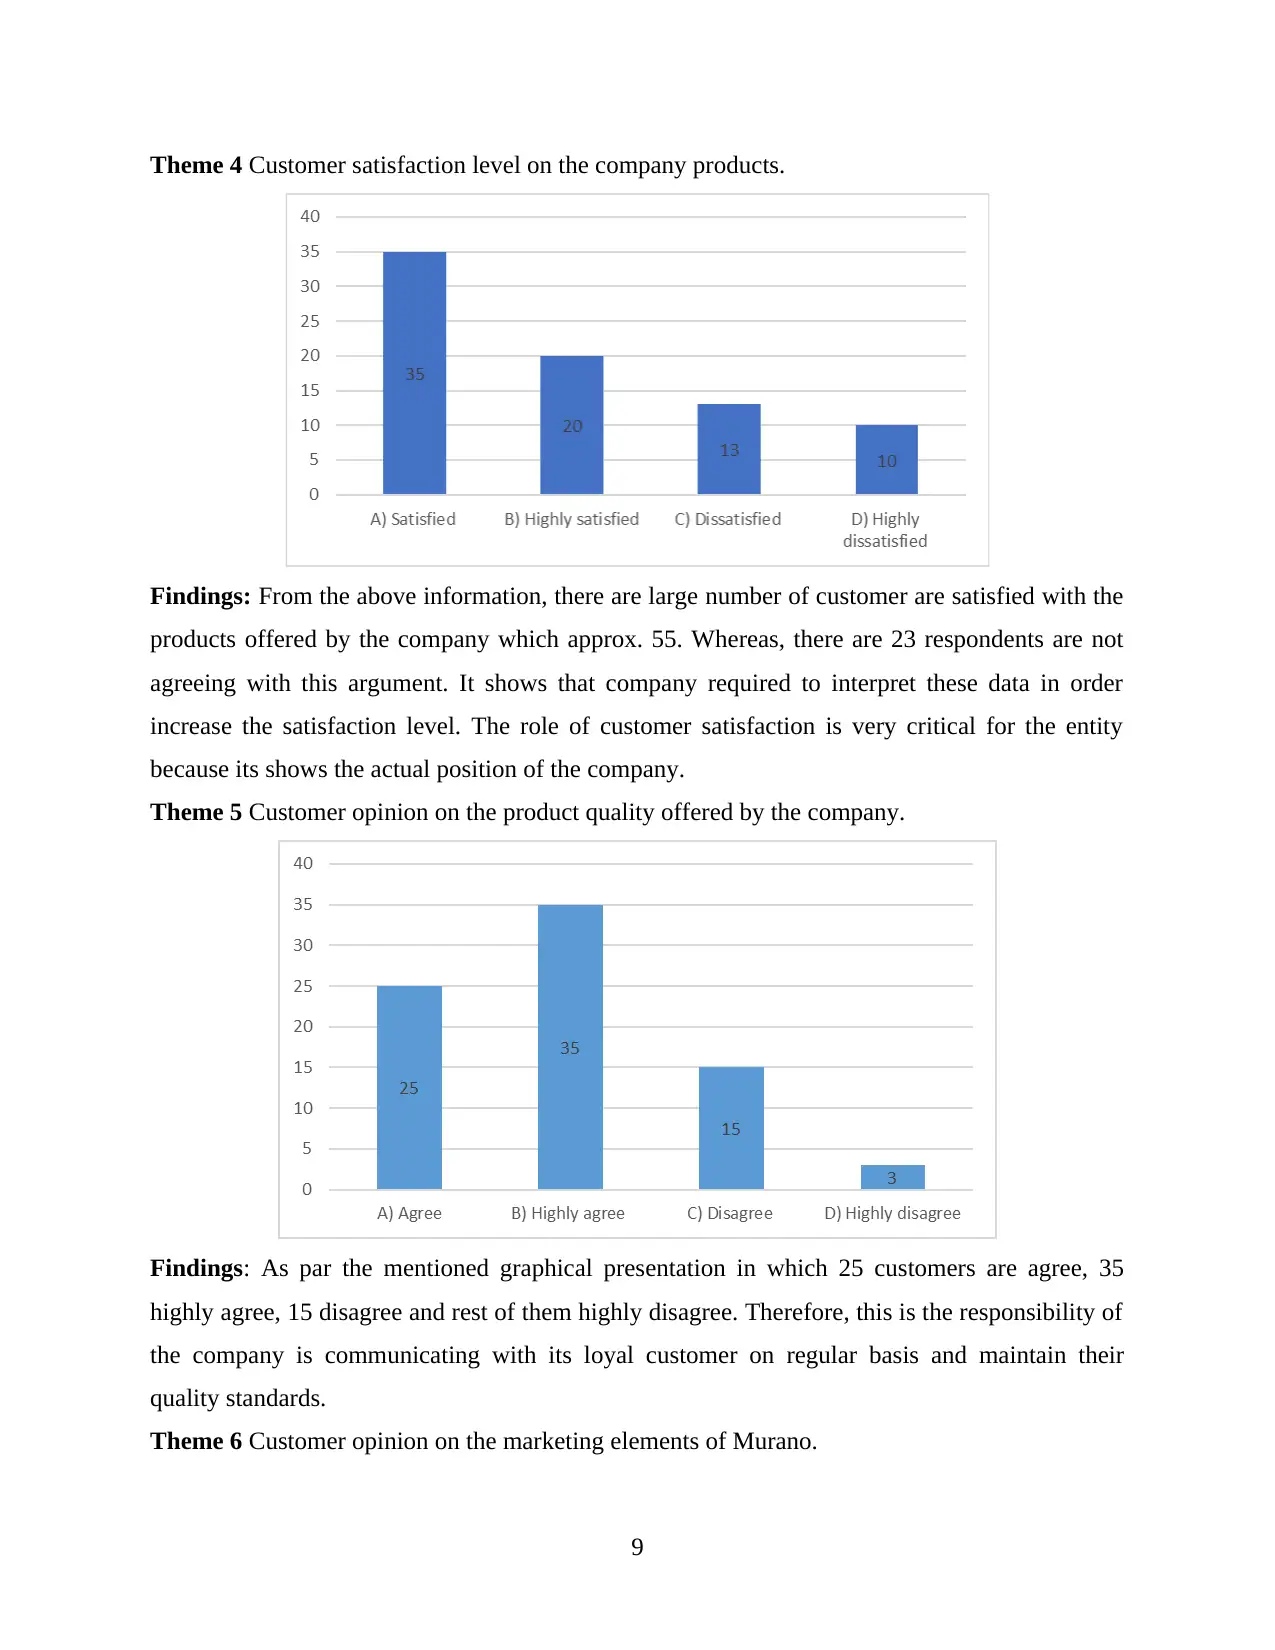
Theme 4 Customer satisfaction level on the company products.
Findings: From the above information, there are large number of customer are satisfied with the
products offered by the company which approx. 55. Whereas, there are 23 respondents are not
agreeing with this argument. It shows that company required to interpret these data in order
increase the satisfaction level. The role of customer satisfaction is very critical for the entity
because its shows the actual position of the company.
Theme 5 Customer opinion on the product quality offered by the company.
Findings: As par the mentioned graphical presentation in which 25 customers are agree, 35
highly agree, 15 disagree and rest of them highly disagree. Therefore, this is the responsibility of
the company is communicating with its loyal customer on regular basis and maintain their
quality standards.
Theme 6 Customer opinion on the marketing elements of Murano.
9
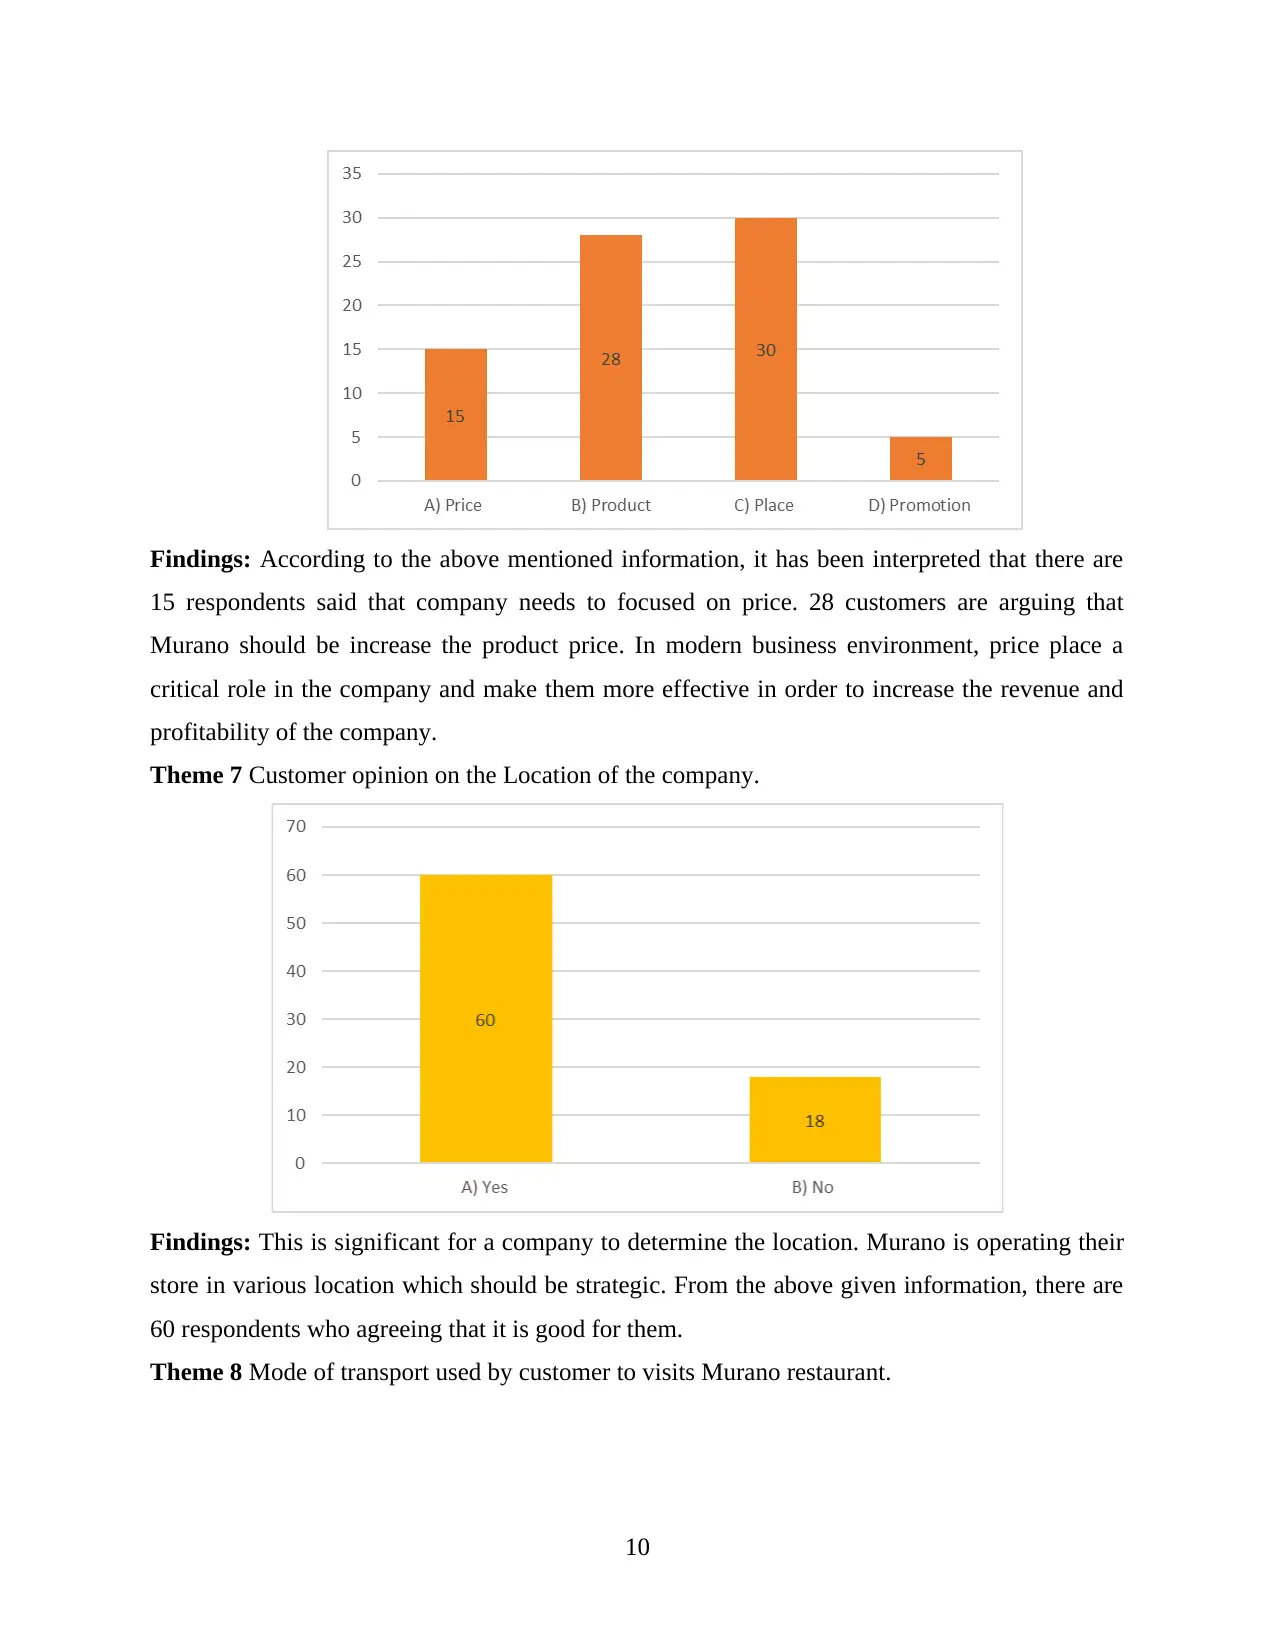
Findings: According to the above mentioned information, it has been interpreted that there are
15 respondents said that company needs to focused on price. 28 customers are arguing that
Murano should be increase the product price. In modern business environment, price place a
critical role in the company and make them more effective in order to increase the revenue and
profitability of the company.
Theme 7 Customer opinion on the Location of the company.
Findings: This is significant for a company to determine the location. Murano is operating their
store in various location which should be strategic. From the above given information, there are
60 respondents who agreeing that it is good for them.
Theme 8 Mode of transport used by customer to visits Murano restaurant.
10
⊘ This is a preview!⊘
Do you want full access?
Subscribe today to unlock all pages.
Trusted by 1+ million students worldwide
1 out of 20
Related Documents


Your All-in-One AI-Powered Toolkit for Academic Success.
+13062052269
info@desklib.com
Available 24*7 on WhatsApp / Email
![[object Object]](/_next/static/media/star-bottom.7253800d.svg)
Unlock your academic potential
Copyright © 2020–2026 A2Z Services. All Rights Reserved. Developed and managed by ZUCOL.