Business Decision Making Report for Food For Friends: London Expansion
VerifiedAdded on 2020/09/17
|18
|4665
|24
Report
AI Summary
This report examines business decision-making processes for a hypothetical restaurant chain, Food For Friends, planning to expand in London. It begins with creating a plan for collecting primary and secondary data, including survey methodology, sampling frames, and questionnaire design. The report then analyzes the collected data using measures of central tendency, standard deviation, and correlation coefficients to draw valid conclusions. It proceeds to create graphs, charts, and trend lines, culminating in a business presentation and formal report for senior management. The final section focuses on utilizing information processing tools, developing a project plan with a critical path, and employing financial tools for making informed decisions. The report aims to provide a structured approach to decision-making based on data analysis and strategic planning, offering a framework for expansion and business development.

Business Decision Making
Paraphrase This Document
Need a fresh take? Get an instant paraphrase of this document with our AI Paraphraser
Table of Contents
INTRODUCTION...........................................................................................................................1
TASK 1............................................................................................................................................1
1.1 Creation of plan for collecting primary and secondary data.................................................1
1.2 Survey methodology and sampling frame use......................................................................2
1.3 Designing of questionnaire for gathering of information.....................................................2
2.1 Creation of information on the basis of questionnaire..........................................................4
2.2 Use of measure of central tendency for effective decision...................................................4
2.3 Use of standard deviation and variances for effective decision making...............................5
2.4 Evaluation of correlation coefficient for appropriate understanding....................................7
TASK 2............................................................................................................................................7
3.1 Formulation of graphs and charts for better working............................................................7
3.2 Use of trend line for effective and appropriate work............................................................9
3.3 Formulation of business presentation to senior management.............................................11
3.4 Produce a formal business report........................................................................................11
TASK 3..........................................................................................................................................12
4.1 Use of appropriate information processing tool..................................................................12
4.2 Prepare a project plan for activity with critical path...........................................................12
4.3 Use of financial tools for decision making.........................................................................13
CONCLUSION..............................................................................................................................14
REFERENCES..............................................................................................................................15

INTRODUCTION
Business success comes to only such people whom take better and effective judgement
for future aspect and concern. Every big and right judgement contribute with aspect of suitable
right decision. Although, taking right and appropriate decision is not a easy thing because it will
support a business to grow and get developed in a suitable frame (Barlett, 2016). This project is
based on business decision making in which Food For Friends wants to open another chain of
restaurant in London, United Kingdom. This project includes about collection of data with both
primary and secondary source along with data need to get understand and evaluate in an
appropriate frame for better working. Moreover, once all standard get adequately done, then
business need to use appropriate and suitable method to present data effectively. At last,
management need to use and adapt software generated information properly so that better and
effective decision making get enhance.
TASK 1
1.1 Creation of plan for collecting primary and secondary data
Planning comes with every big idea and every bid idea need suitable plan through which
objectives and aims of business get accomplish in an appropriate and effective frame. There are
mainly various kind of data collection tool get evaluated for a business through which
management become able to organise a study properly (Drucker, 2017). Thus, when data get
gather appropriate plan need to get drawn out in a suitable and appropriate frame. The two major
data collection tools which need to implement by Food for Friends stated as follow:
Primary data: These are such kind of data which is raw in nature and never get exist in
consideration before. It is important to evaluate and use primary data for further study so
that better and effective working get promoted. Food for Friends need to use this method
in their working so that better results could be gain. Questionnaire is one of a best
approach for this to gather various responses.
Secondary data: This is already exist and gather information which get analyse by using
corrective measure. Food For Friends can use their financial records in such aspect
properly and effectively so that better working get promoted.
1
⊘ This is a preview!⊘
Do you want full access?
Subscribe today to unlock all pages.
Trusted by 1+ million students worldwide
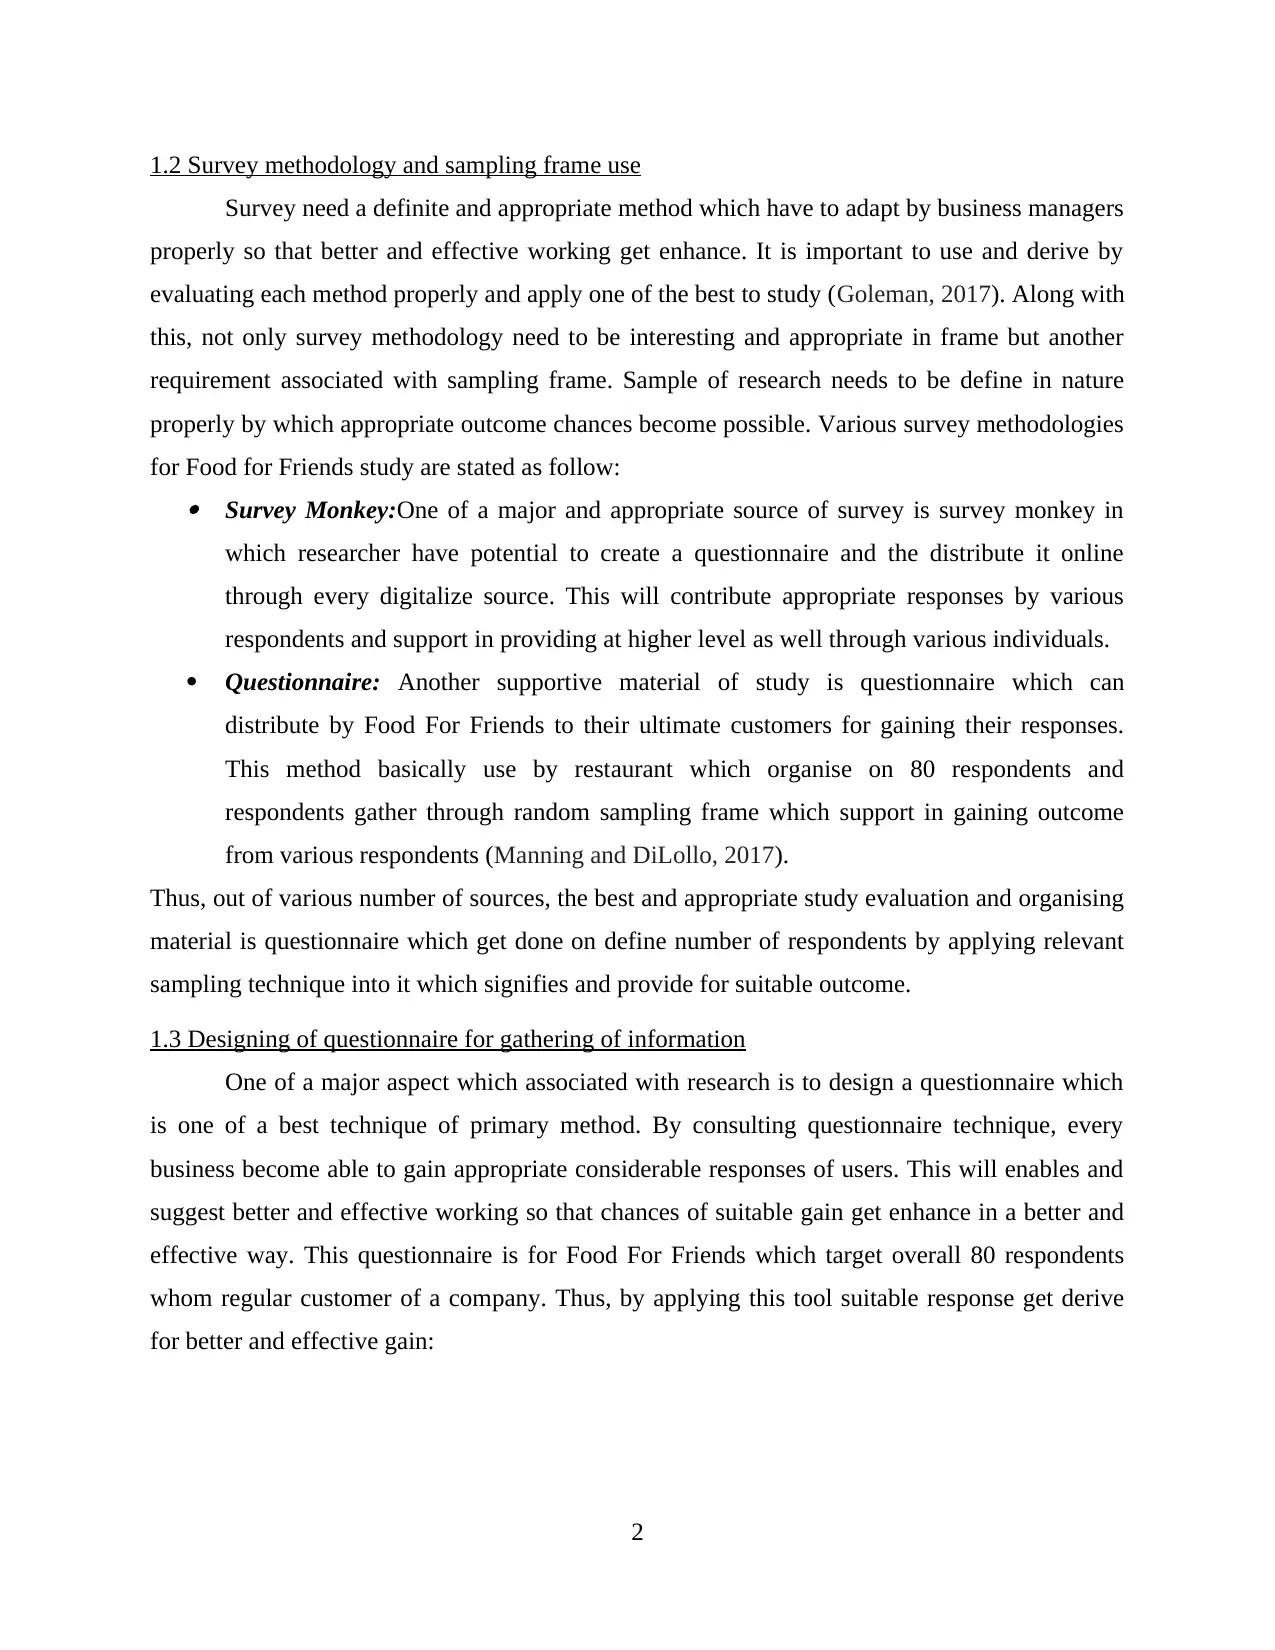
1.2 Survey methodology and sampling frame use
Survey need a definite and appropriate method which have to adapt by business managers
properly so that better and effective working get enhance. It is important to use and derive by
evaluating each method properly and apply one of the best to study (Goleman, 2017). Along with
this, not only survey methodology need to be interesting and appropriate in frame but another
requirement associated with sampling frame. Sample of research needs to be define in nature
properly by which appropriate outcome chances become possible. Various survey methodologies
for Food for Friends study are stated as follow: Survey Monkey:One of a major and appropriate source of survey is survey monkey in
which researcher have potential to create a questionnaire and the distribute it online
through every digitalize source. This will contribute appropriate responses by various
respondents and support in providing at higher level as well through various individuals.
Questionnaire: Another supportive material of study is questionnaire which can
distribute by Food For Friends to their ultimate customers for gaining their responses.
This method basically use by restaurant which organise on 80 respondents and
respondents gather through random sampling frame which support in gaining outcome
from various respondents (Manning and DiLollo, 2017).
Thus, out of various number of sources, the best and appropriate study evaluation and organising
material is questionnaire which get done on define number of respondents by applying relevant
sampling technique into it which signifies and provide for suitable outcome.
1.3 Designing of questionnaire for gathering of information
One of a major aspect which associated with research is to design a questionnaire which
is one of a best technique of primary method. By consulting questionnaire technique, every
business become able to gain appropriate considerable responses of users. This will enables and
suggest better and effective working so that chances of suitable gain get enhance in a better and
effective way. This questionnaire is for Food For Friends which target overall 80 respondents
whom regular customer of a company. Thus, by applying this tool suitable response get derive
for better and effective gain:
2
Paraphrase This Document
Need a fresh take? Get an instant paraphrase of this document with our AI Paraphraser
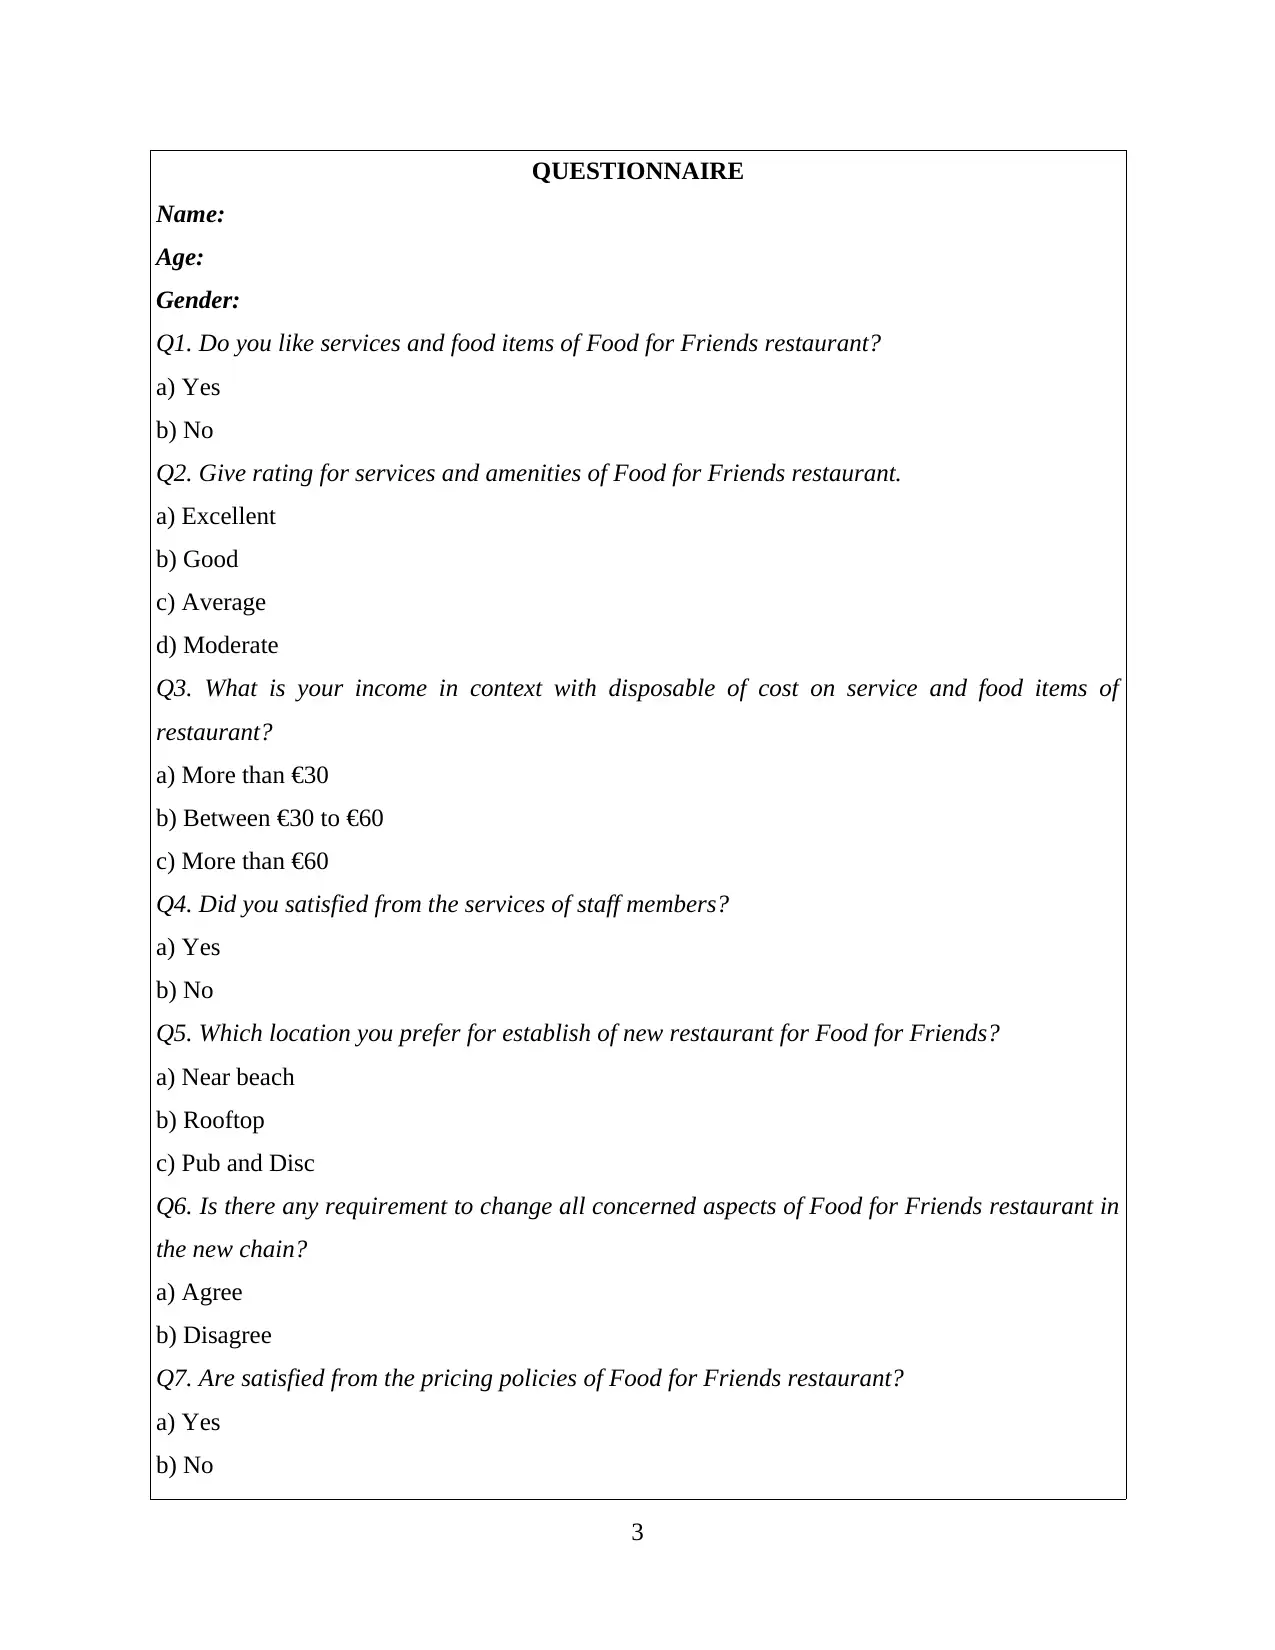
QUESTIONNAIRE
Name:
Age:
Gender:
Q1. Do you like services and food items of Food for Friends restaurant?
a) Yes
b) No
Q2. Give rating for services and amenities of Food for Friends restaurant.
a) Excellent
b) Good
c) Average
d) Moderate
Q3. What is your income in context with disposable of cost on service and food items of
restaurant?
a) More than €30
b) Between €30 to €60
c) More than €60
Q4. Did you satisfied from the services of staff members?
a) Yes
b) No
Q5. Which location you prefer for establish of new restaurant for Food for Friends?
a) Near beach
b) Rooftop
c) Pub and Disc
Q6. Is there any requirement to change all concerned aspects of Food for Friends restaurant in
the new chain?
a) Agree
b) Disagree
Q7. Are satisfied from the pricing policies of Food for Friends restaurant?
a) Yes
b) No
3
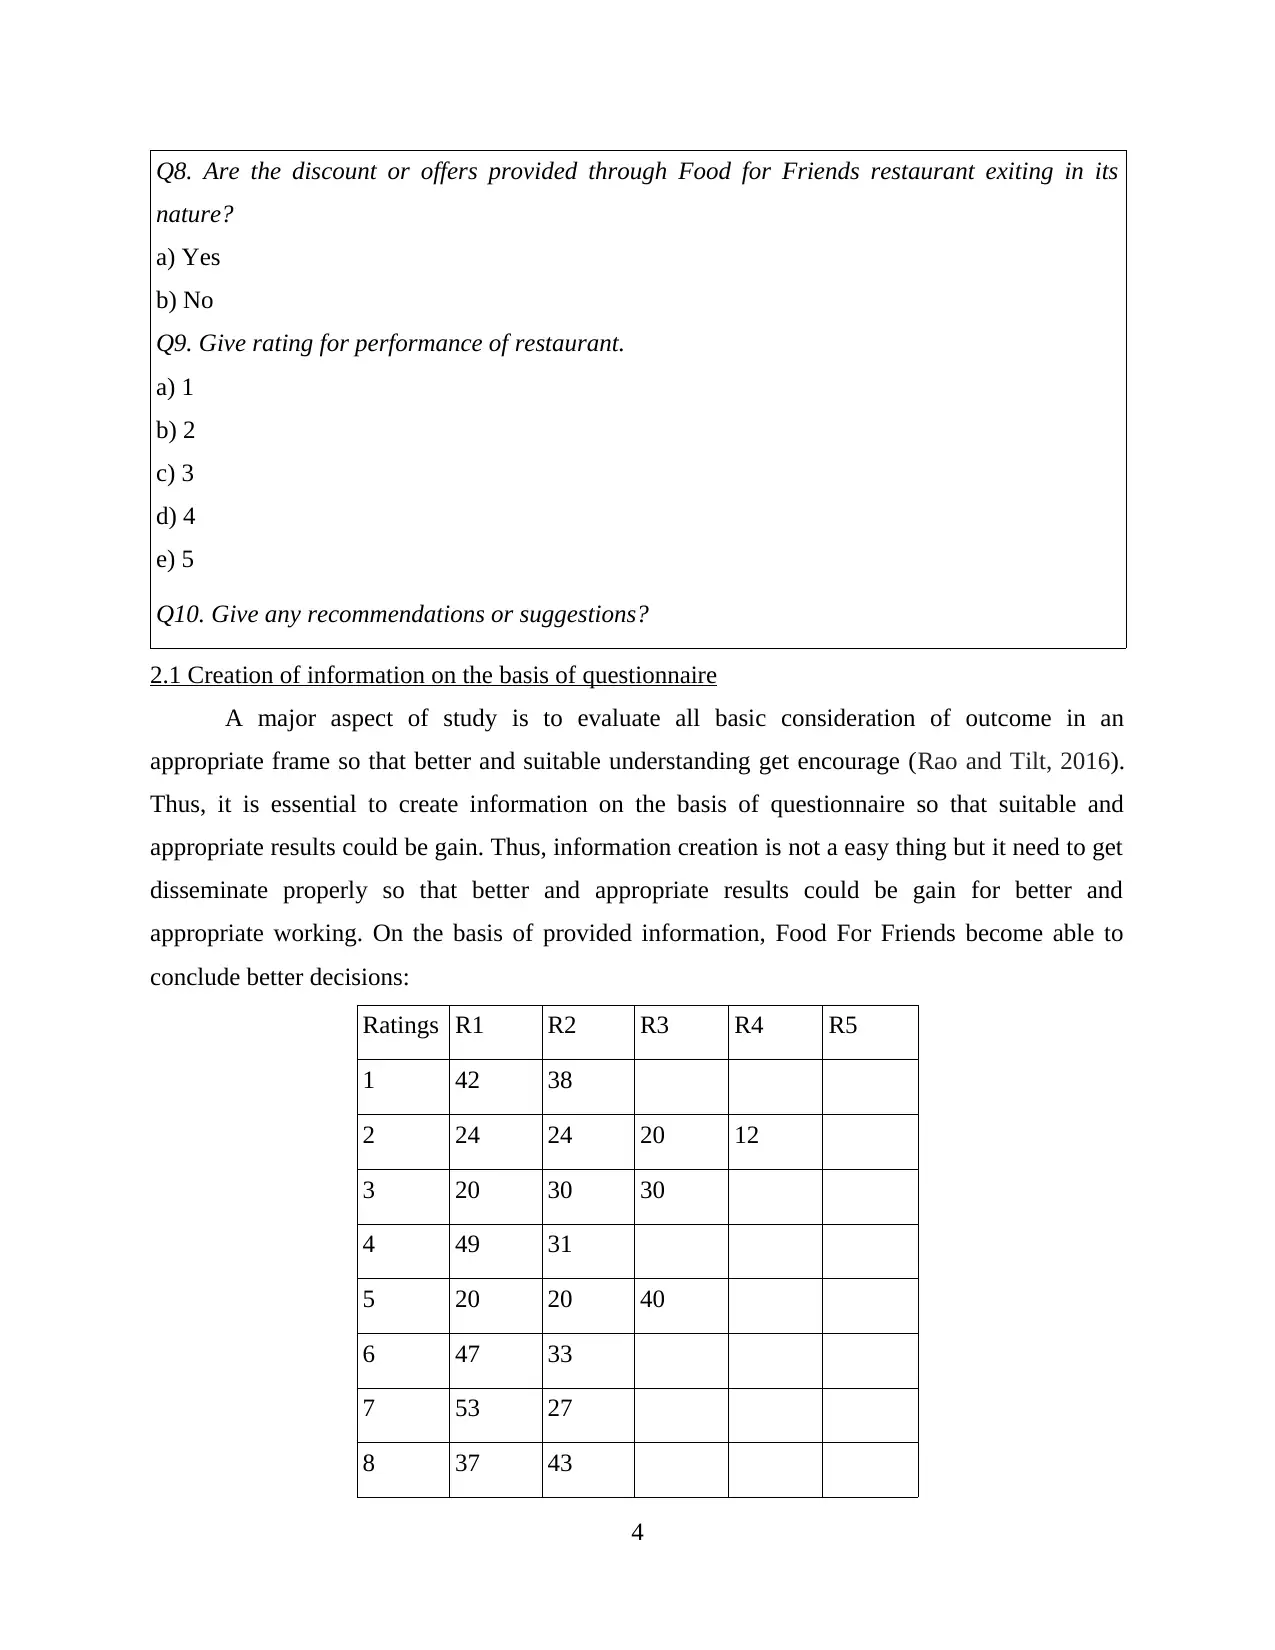
Q8. Are the discount or offers provided through Food for Friends restaurant exiting in its
nature?
a) Yes
b) No
Q9. Give rating for performance of restaurant.
a) 1
b) 2
c) 3
d) 4
e) 5
Q10. Give any recommendations or suggestions?
2.1 Creation of information on the basis of questionnaire
A major aspect of study is to evaluate all basic consideration of outcome in an
appropriate frame so that better and suitable understanding get encourage (Rao and Tilt, 2016).
Thus, it is essential to create information on the basis of questionnaire so that suitable and
appropriate results could be gain. Thus, information creation is not a easy thing but it need to get
disseminate properly so that better and appropriate results could be gain for better and
appropriate working. On the basis of provided information, Food For Friends become able to
conclude better decisions:
Ratings R1 R2 R3 R4 R5
1 42 38
2 24 24 20 12
3 20 30 30
4 49 31
5 20 20 40
6 47 33
7 53 27
8 37 43
4
⊘ This is a preview!⊘
Do you want full access?
Subscribe today to unlock all pages.
Trusted by 1+ million students worldwide
9 10 12 12 22 24
2.2 Use of measure of central tendency for effective decision
Measure of central tendency provide average of values of given frequency so that better
and appropriate understanding get enhance. Such information which ascertain through central
tendency does not provide appropriate but signifies estimation (Rothman, 2017). Henceforth,
management need to use all three sections which are mean, median and mode properly so that
better and appropriate outcome could be gain.
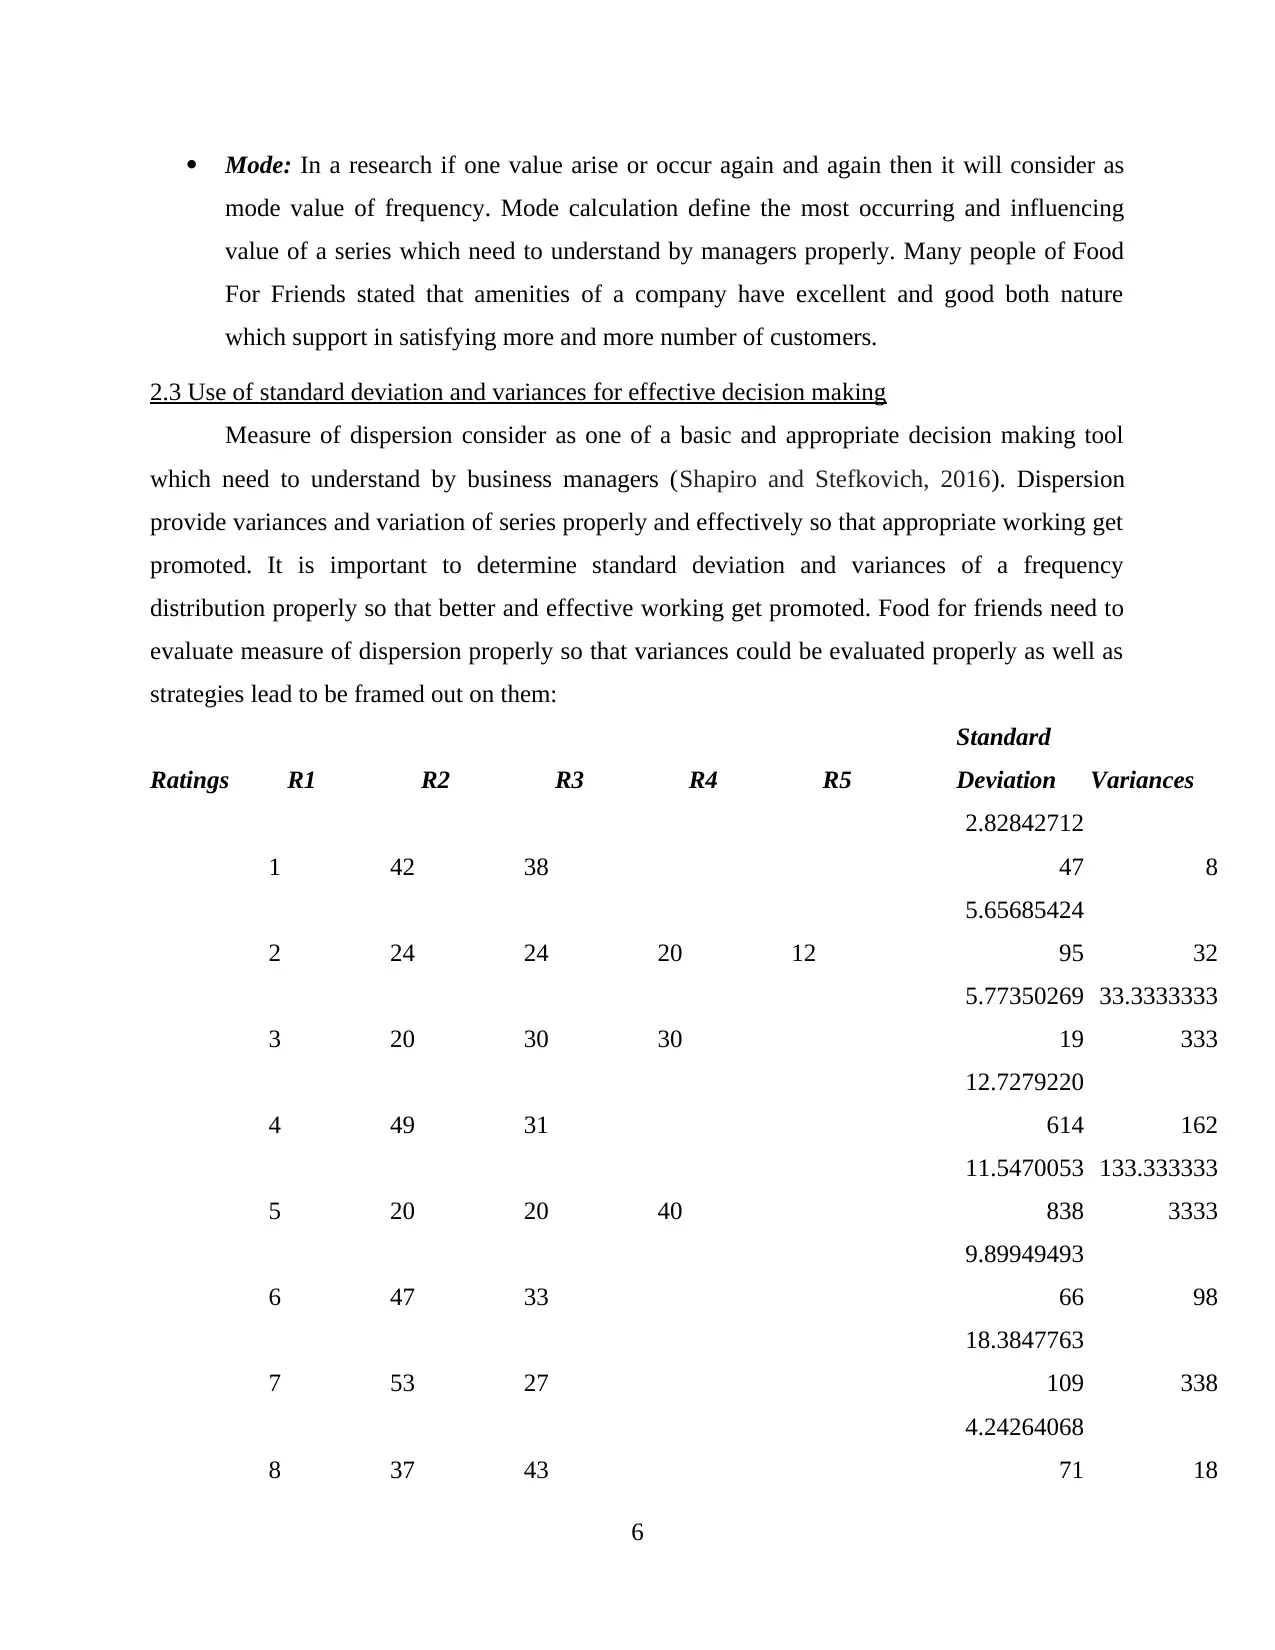
R1 R2 R3 R4 R5 Mean Median Mode
42 38 40 40 #VALUE!
24 24 20 12 20 22 24
20 30 30
26.6666666
667 30 30
49 31 40 40 #VALUE!
20 20 40
26.6666666
667 20 20
47 33 40 40 #VALUE!
53 27 40 40 #VALUE!
37 43 40 40 #VALUE!
10 12 12 22 24 16 12 12 Mean: It is an average of series which need to understand by business managers
properly. An average stated that such frequency arise most of the time and have more
significance into a frequency distribution table. 40 is consider as mean value of a series as
its occur most of the time in a table. Goods and services quality, staff behaviour etc. all of
these have high quality standard. Median: Median is a mid value of the represented data frequency series which have a
more impact on actual working. Business decision making need appropriate consideration
of median which specifies about middle value (Sekaran and Bougie, 2016). Every
frequency have distinct mid value which signifies positive and negative responses
properly. Like amenities have a middle value of 22 which signifies effective and
appropriate out-frame.
5
2.2 Use of measure of central tendency for effective decision
Measure of central tendency provide average of values of given frequency so that better
and appropriate understanding get enhance. Such information which ascertain through central
tendency does not provide appropriate but signifies estimation (Rothman, 2017). Henceforth,
management need to use all three sections which are mean, median and mode properly so that
better and appropriate outcome could be gain.
R1 R2 R3 R4 R5 Mean Median Mode
42 38 40 40 #VALUE!
24 24 20 12 20 22 24
20 30 30
26.6666666
667 30 30
49 31 40 40 #VALUE!
20 20 40
26.6666666
667 20 20
47 33 40 40 #VALUE!
53 27 40 40 #VALUE!
37 43 40 40 #VALUE!
10 12 12 22 24 16 12 12 Mean: It is an average of series which need to understand by business managers
properly. An average stated that such frequency arise most of the time and have more
significance into a frequency distribution table. 40 is consider as mean value of a series as
its occur most of the time in a table. Goods and services quality, staff behaviour etc. all of
these have high quality standard. Median: Median is a mid value of the represented data frequency series which have a
more impact on actual working. Business decision making need appropriate consideration
of median which specifies about middle value (Sekaran and Bougie, 2016). Every
frequency have distinct mid value which signifies positive and negative responses
properly. Like amenities have a middle value of 22 which signifies effective and
appropriate out-frame.
5
Paraphrase This Document
Need a fresh take? Get an instant paraphrase of this document with our AI Paraphraser
Mode: In a research if one value arise or occur again and again then it will consider as
mode value of frequency. Mode calculation define the most occurring and influencing
value of a series which need to understand by managers properly. Many people of Food
For Friends stated that amenities of a company have excellent and good both nature
which support in satisfying more and more number of customers.
2.3 Use of standard deviation and variances for effective decision making
Measure of dispersion consider as one of a basic and appropriate decision making tool
which need to understand by business managers (Shapiro and Stefkovich, 2016). Dispersion
provide variances and variation of series properly and effectively so that appropriate working get
promoted. It is important to determine standard deviation and variances of a frequency
distribution properly so that better and effective working get promoted. Food for friends need to
evaluate measure of dispersion properly so that variances could be evaluated properly as well as
strategies lead to be framed out on them:
Ratings R1 R2 R3 R4 R5
Standard
Deviation Variances
1 42 38
2.82842712
47 8
2 24 24 20 12
5.65685424
95 32
3 20 30 30
5.77350269
19
33.3333333
333
4 49 31
12.7279220
614 162
5 20 20 40
11.5470053
838
133.333333
3333
6 47 33
9.89949493
66 98
7 53 27
18.3847763
109 338
8 37 43
4.24264068
71 18
6
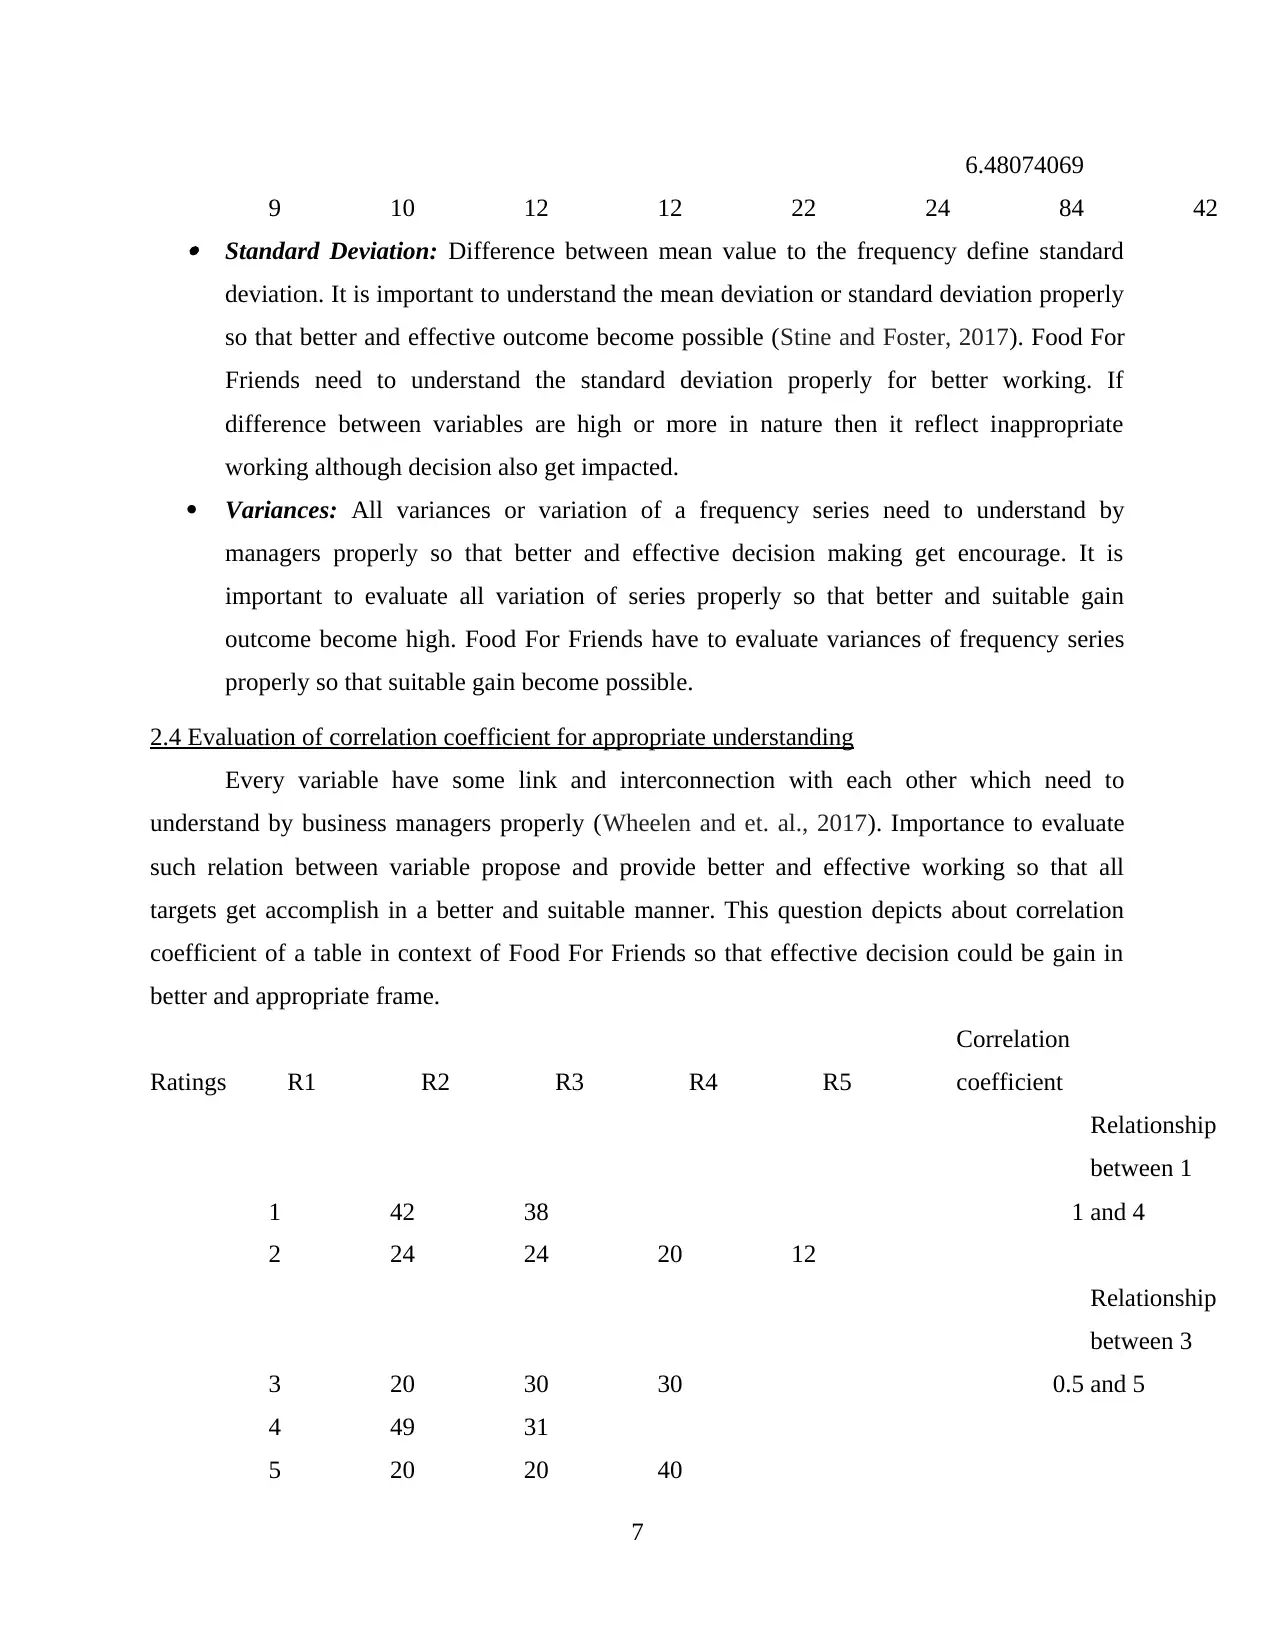
9 10 12 12 22 24
6.48074069
84 42 Standard Deviation: Difference between mean value to the frequency define standard
deviation. It is important to understand the mean deviation or standard deviation properly
so that better and effective outcome become possible (Stine and Foster, 2017). Food For
Friends need to understand the standard deviation properly for better working. If
difference between variables are high or more in nature then it reflect inappropriate
working although decision also get impacted.
Variances: All variances or variation of a frequency series need to understand by
managers properly so that better and effective decision making get encourage. It is
important to evaluate all variation of series properly so that better and suitable gain
outcome become high. Food For Friends have to evaluate variances of frequency series
properly so that suitable gain become possible.
2.4 Evaluation of correlation coefficient for appropriate understanding
Every variable have some link and interconnection with each other which need to
understand by business managers properly (Wheelen and et. al., 2017). Importance to evaluate
such relation between variable propose and provide better and effective working so that all
targets get accomplish in a better and suitable manner. This question depicts about correlation
coefficient of a table in context of Food For Friends so that effective decision could be gain in
better and appropriate frame.
Ratings R1 R2 R3 R4 R5
Correlation
coefficient
1 42 38 1
Relationship
between 1
and 4
2 24 24 20 12
3 20 30 30 0.5
Relationship
between 3
and 5
4 49 31
5 20 20 40
7
⊘ This is a preview!⊘
Do you want full access?
Subscribe today to unlock all pages.
Trusted by 1+ million students worldwide
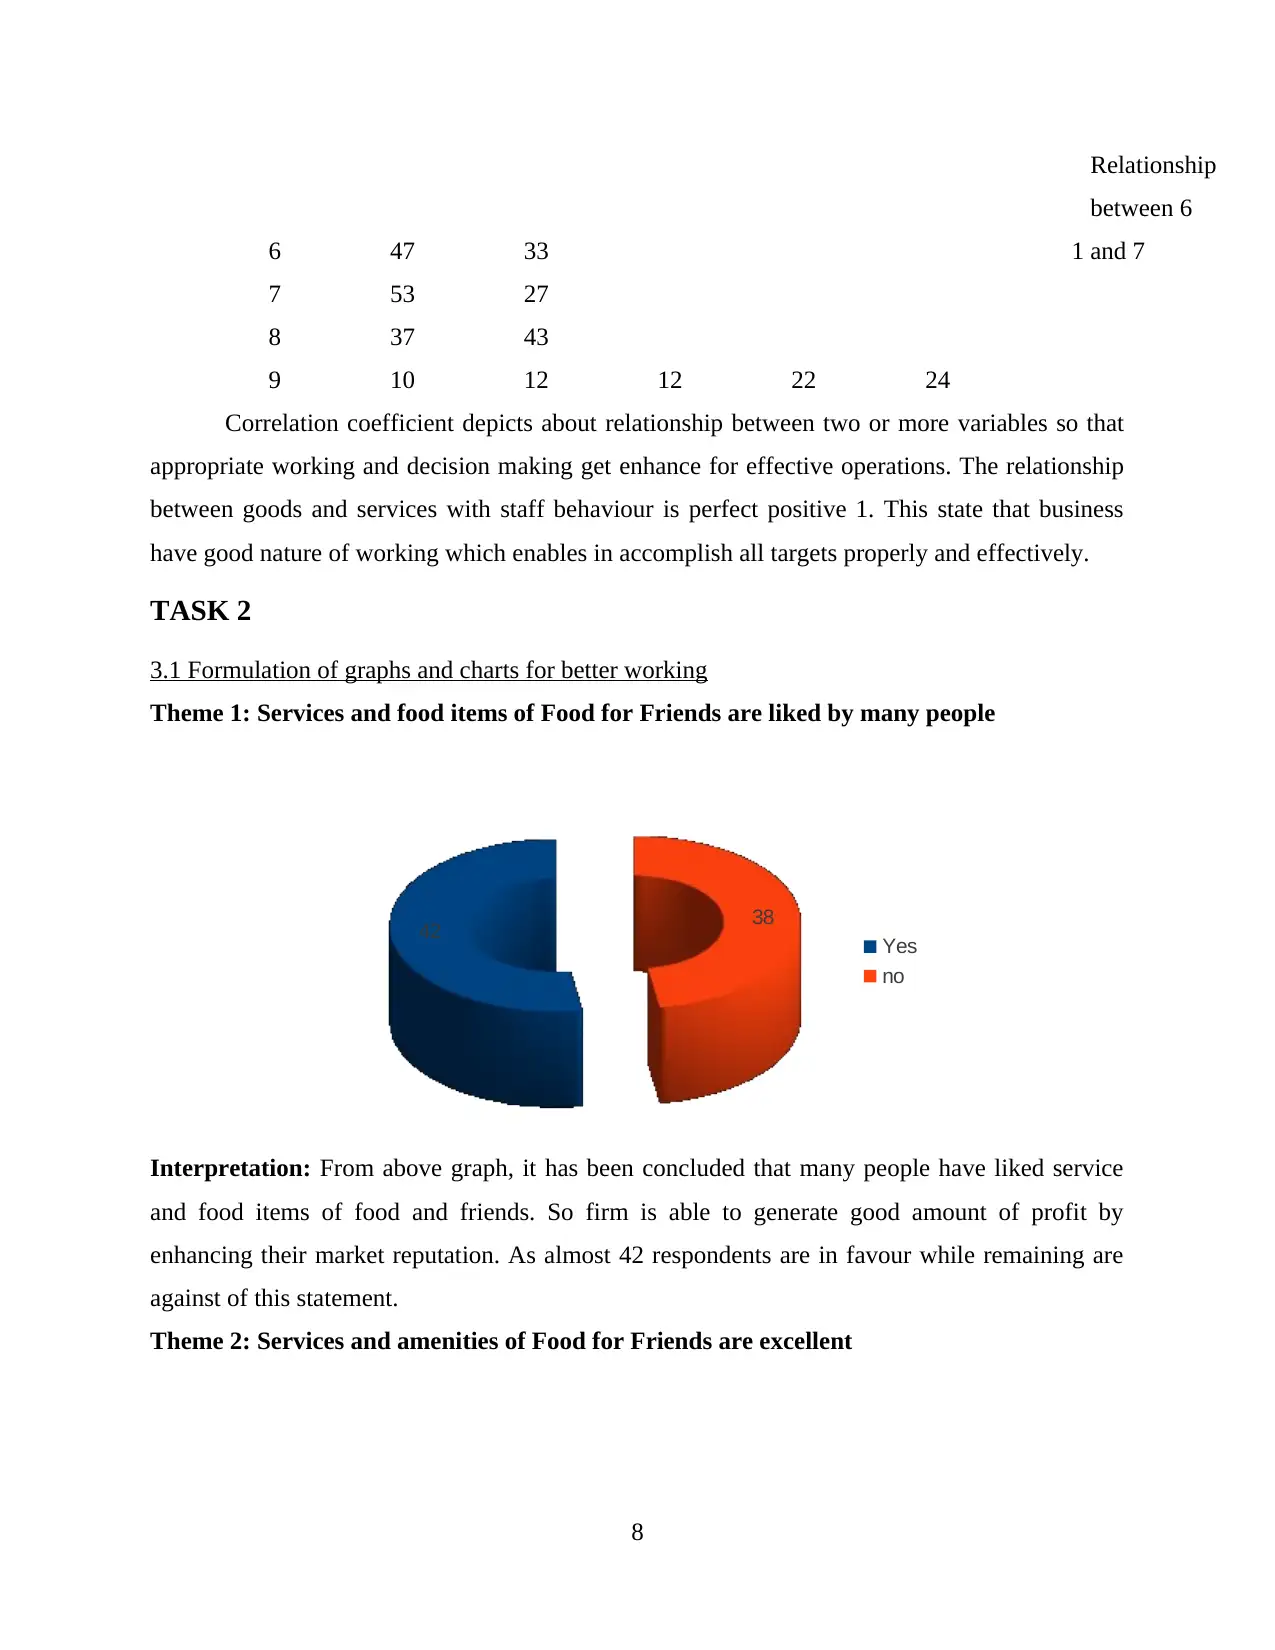
6 47 33 1
Relationship
between 6
and 7
7 53 27
8 37 43
9 10 12 12 22 24
Correlation coefficient depicts about relationship between two or more variables so that
appropriate working and decision making get enhance for effective operations. The relationship
between goods and services with staff behaviour is perfect positive 1. This state that business
have good nature of working which enables in accomplish all targets properly and effectively.
TASK 2
3.1 Formulation of graphs and charts for better working
Theme 1: Services and food items of Food for Friends are liked by many people
42 38
Yes
no
Interpretation: From above graph, it has been concluded that many people have liked service
and food items of food and friends. So firm is able to generate good amount of profit by
enhancing their market reputation. As almost 42 respondents are in favour while remaining are
against of this statement.
Theme 2: Services and amenities of Food for Friends are excellent
8
Paraphrase This Document
Need a fresh take? Get an instant paraphrase of this document with our AI Paraphraser
24
24
20
12
Excellent
Good
Average
Moderate
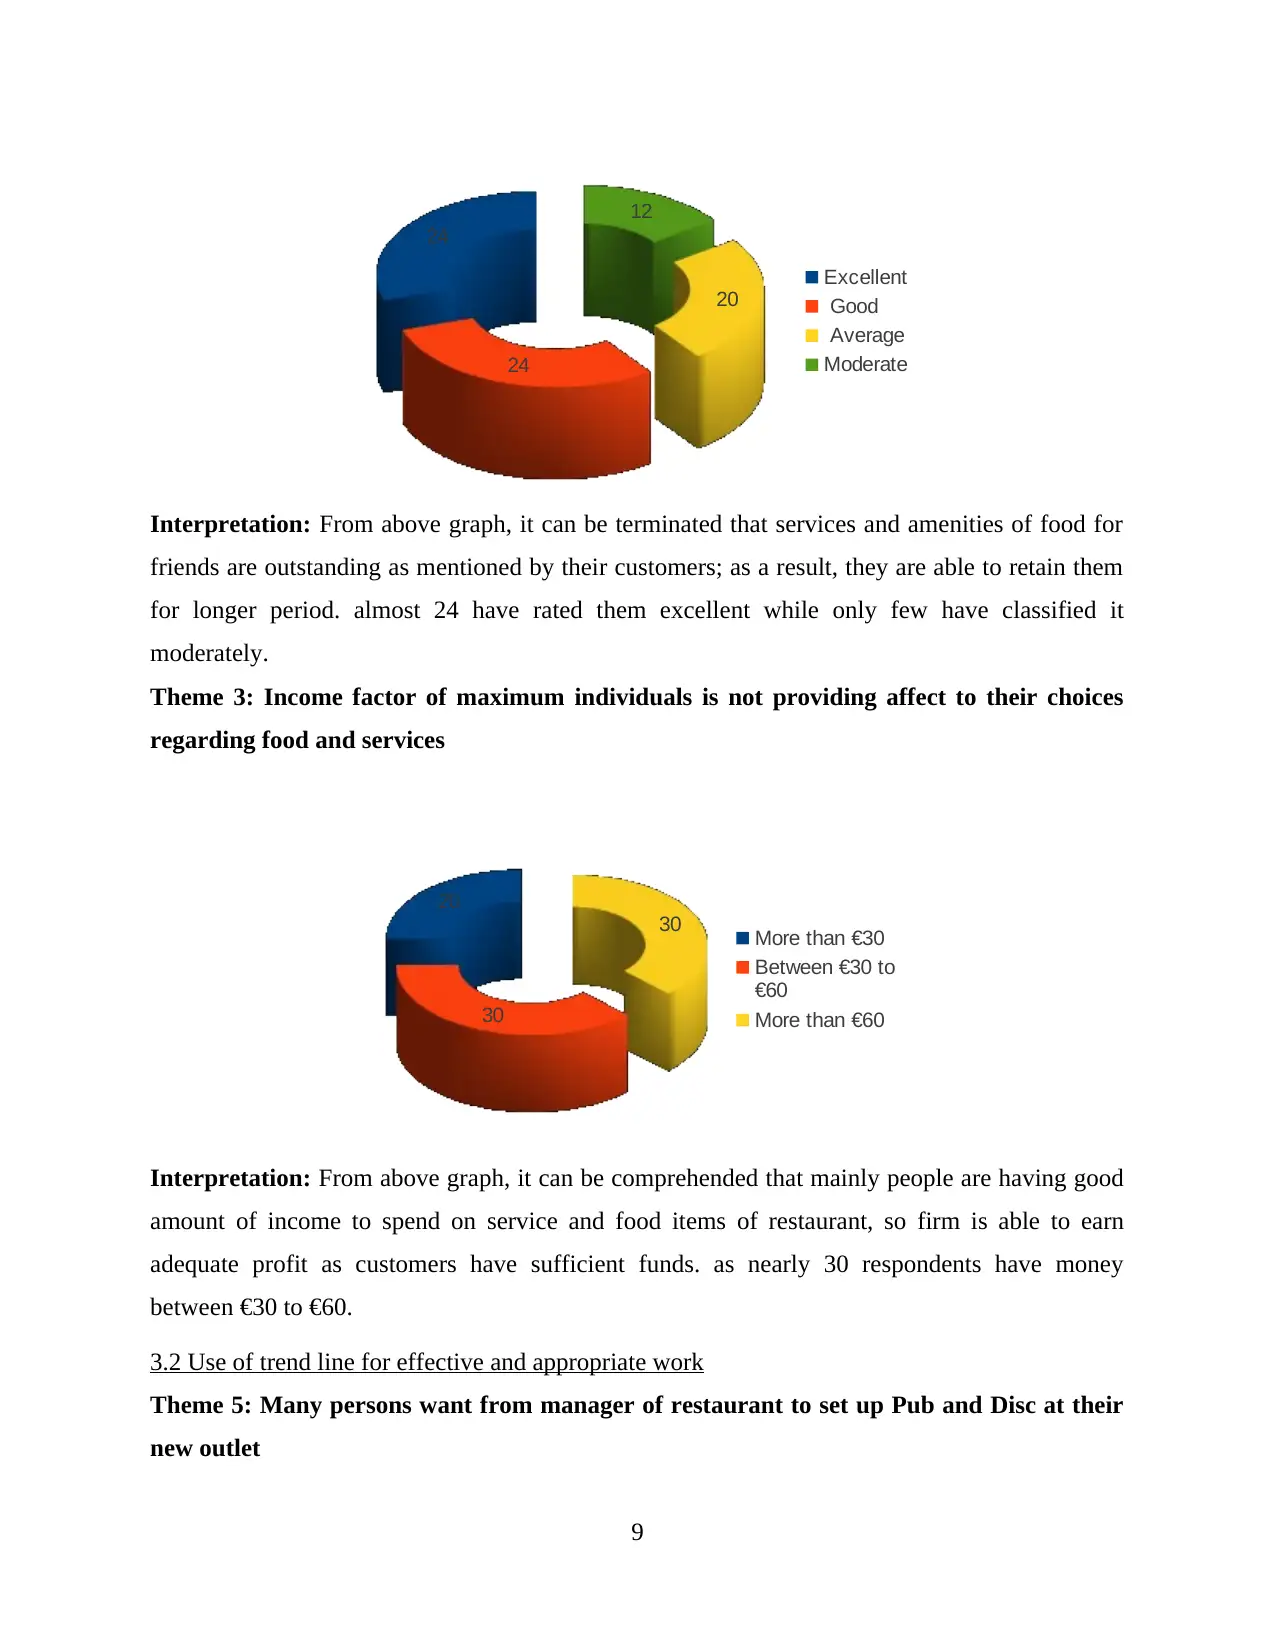
Interpretation: From above graph, it can be terminated that services and amenities of food for
friends are outstanding as mentioned by their customers; as a result, they are able to retain them
for longer period. almost 24 have rated them excellent while only few have classified it
moderately.
Theme 3: Income factor of maximum individuals is not providing affect to their choices
regarding food and services
20
30
30 More than €30
Between €30 to
€60
More than €60
Interpretation: From above graph, it can be comprehended that mainly people are having good
amount of income to spend on service and food items of restaurant, so firm is able to earn
adequate profit as customers have sufficient funds. as nearly 30 respondents have money
between €30 to €60.
3.2 Use of trend line for effective and appropriate work
Theme 5: Many persons want from manager of restaurant to set up Pub and Disc at their
new outlet
9
24
20
12
Excellent
Good
Average
Moderate
Interpretation: From above graph, it can be terminated that services and amenities of food for
friends are outstanding as mentioned by their customers; as a result, they are able to retain them
for longer period. almost 24 have rated them excellent while only few have classified it
moderately.
Theme 3: Income factor of maximum individuals is not providing affect to their choices
regarding food and services
20
30
30 More than €30
Between €30 to
€60
More than €60
Interpretation: From above graph, it can be comprehended that mainly people are having good
amount of income to spend on service and food items of restaurant, so firm is able to earn
adequate profit as customers have sufficient funds. as nearly 30 respondents have money
between €30 to €60.
3.2 Use of trend line for effective and appropriate work
Theme 5: Many persons want from manager of restaurant to set up Pub and Disc at their
new outlet
9
Near beach Rooftop Pub and Disc
0
5
10
15
20
25
30
35
40
45
20 20
40
Column B
Linear (Column B)
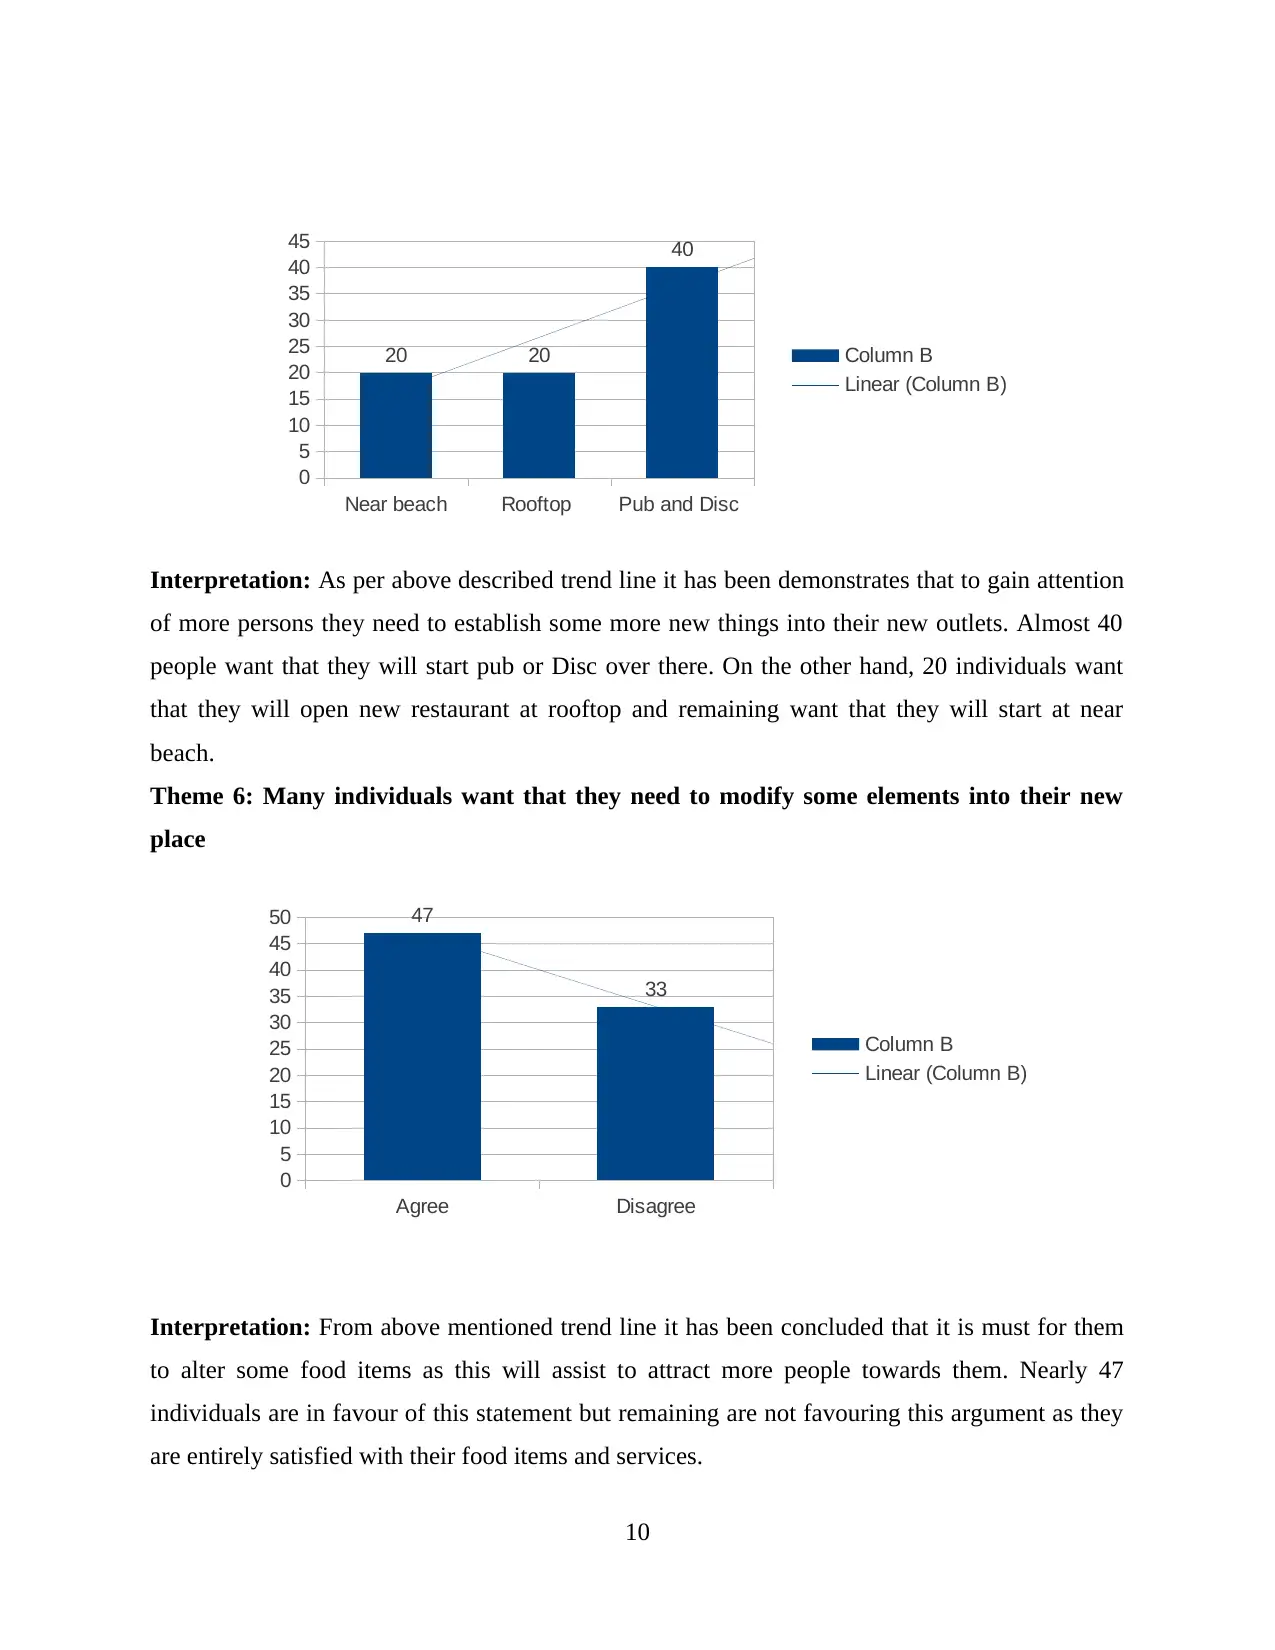
Interpretation: As per above described trend line it has been demonstrates that to gain attention
of more persons they need to establish some more new things into their new outlets. Almost 40
people want that they will start pub or Disc over there. On the other hand, 20 individuals want
that they will open new restaurant at rooftop and remaining want that they will start at near
beach.
Theme 6: Many individuals want that they need to modify some elements into their new
place
Agree Disagree
0
5
10
15
20
25
30
35
40
45
50 47
33
Column B
Linear (Column B)
Interpretation: From above mentioned trend line it has been concluded that it is must for them
to alter some food items as this will assist to attract more people towards them. Nearly 47
individuals are in favour of this statement but remaining are not favouring this argument as they
are entirely satisfied with their food items and services.
10
0
5
10
15
20
25
30
35
40
45
20 20
40
Column B
Linear (Column B)
Interpretation: As per above described trend line it has been demonstrates that to gain attention
of more persons they need to establish some more new things into their new outlets. Almost 40
people want that they will start pub or Disc over there. On the other hand, 20 individuals want
that they will open new restaurant at rooftop and remaining want that they will start at near
beach.
Theme 6: Many individuals want that they need to modify some elements into their new
place
Agree Disagree
0
5
10
15
20
25
30
35
40
45
50 47
33
Column B
Linear (Column B)
Interpretation: From above mentioned trend line it has been concluded that it is must for them
to alter some food items as this will assist to attract more people towards them. Nearly 47
individuals are in favour of this statement but remaining are not favouring this argument as they
are entirely satisfied with their food items and services.
10
⊘ This is a preview!⊘
Do you want full access?
Subscribe today to unlock all pages.
Trusted by 1+ million students worldwide
1 out of 18
Related Documents


Your All-in-One AI-Powered Toolkit for Academic Success.
+13062052269
info@desklib.com
Available 24*7 on WhatsApp / Email
![[object Object]](/_next/static/media/star-bottom.7253800d.svg)
Unlock your academic potential
Copyright © 2020–2026 A2Z Services. All Rights Reserved. Developed and managed by ZUCOL.