Analysis of Data and Decision Making Report for Restaurant Chain
VerifiedAdded on 2020/02/05
|23
|3750
|73
Report
AI Summary
This report delves into the crucial aspects of business decision-making within the competitive restaurant industry. It meticulously examines the application of various analytical tools and techniques, including data collection methods (primary and secondary), survey methodologies, and statistical analysis, such as measures of dispersion, quartiles, percentiles, and correlation coefficients. The report also demonstrates the use of graphical representations, like pie charts, bar graphs, and line graphs, to visualize sales performance across different cuisines. Furthermore, it incorporates financial tools and techniques to provide a comprehensive assessment for making informed decisions regarding opening a new restaurant in London. The report offers an in-depth analysis of data, providing insights to aid management in making strategic choices and highlights the importance of data-driven insights for effective decision-making in the restaurant business.

BUSINESS DECISION
MAKING
MAKING
Paraphrase This Document
Need a fresh take? Get an instant paraphrase of this document with our AI Paraphraser
Table of Contents
Introduction......................................................................................................................................1
TASK 1: Ability to identify variety of sources and range of techniques to analyze data...............1
Collection of primary and secondary data...................................................................................1
Survey methodology and Sampling technique............................................................................2
Questionnaire...............................................................................................................................2
Developing information for decision making..............................................................................4
Analyzing the collected information...........................................................................................5
Analyzing data using Measure of Dispersion..............................................................................6
Explanation of quartile, percentile and Coefficient correlation...................................................7
TASK 2: USE OF STATISTICAL GRAPHS AND REPORTS FOR DECISION MAKING
AND SOFTWARE GENERATED INFORMATION FOR DECISION MAKING......................8
Graphs and Spreadsheets.............................................................................................................8
Trend lines.................................................................................................................................12
Formal Business Report.............................................................................................................13
Information processing tools.....................................................................................................14
Network Diagram......................................................................................................................15
Use of Financial Tools...............................................................................................................16
Conclusion.....................................................................................................................................19
References......................................................................................................................................20
LIST OF FIGURES
Figure 1: 2013..................................................................................................................................9
Figure 2: 2014..................................................................................................................................9
Figure 3: 2015................................................................................................................................10
Figure 4: Bar Graph.......................................................................................................................10
Figure 5: Line graph......................................................................................................................11
Figure 6: Italian..............................................................................................................................12
Figure 7: Mexican..........................................................................................................................12
Figure 8: Indian..............................................................................................................................13
Figure 9: Continental.....................................................................................................................13
Figure 10: Gantt chart....................................................................................................................16
Figure 11: Network diagram..........................................................................................................16
⊘ This is a preview!⊘
Do you want full access?
Subscribe today to unlock all pages.
Trusted by 1+ million students worldwide
INTRODUCTION
Looking at the competitiveness of present corporate market it is essential for the firm
operating in it to carry out the entire course of business functioning in appropriate and reliable
manner. However, in doing so decision making capabilities of manager’s paly crucial role for the
enterprise. In this regard, decision making refers to the process of electing the best suitable
option from various alternatives (Zelman, McCue and Noah 2009). Present report focuses on
evaluating the significance of decision making with the help of graphical, statistical and financial
tools and techniques. However, these tools will be used to help the management of Restaurant
chain in making smart and effective judgement regarding opening a new restaurant in the popular
place of London.
TASK 1: ABILITY TO IDENTIFY VARIETY OF SOURCES AND RANGE
OF TECHNIQUES TO ANALYZE DATA
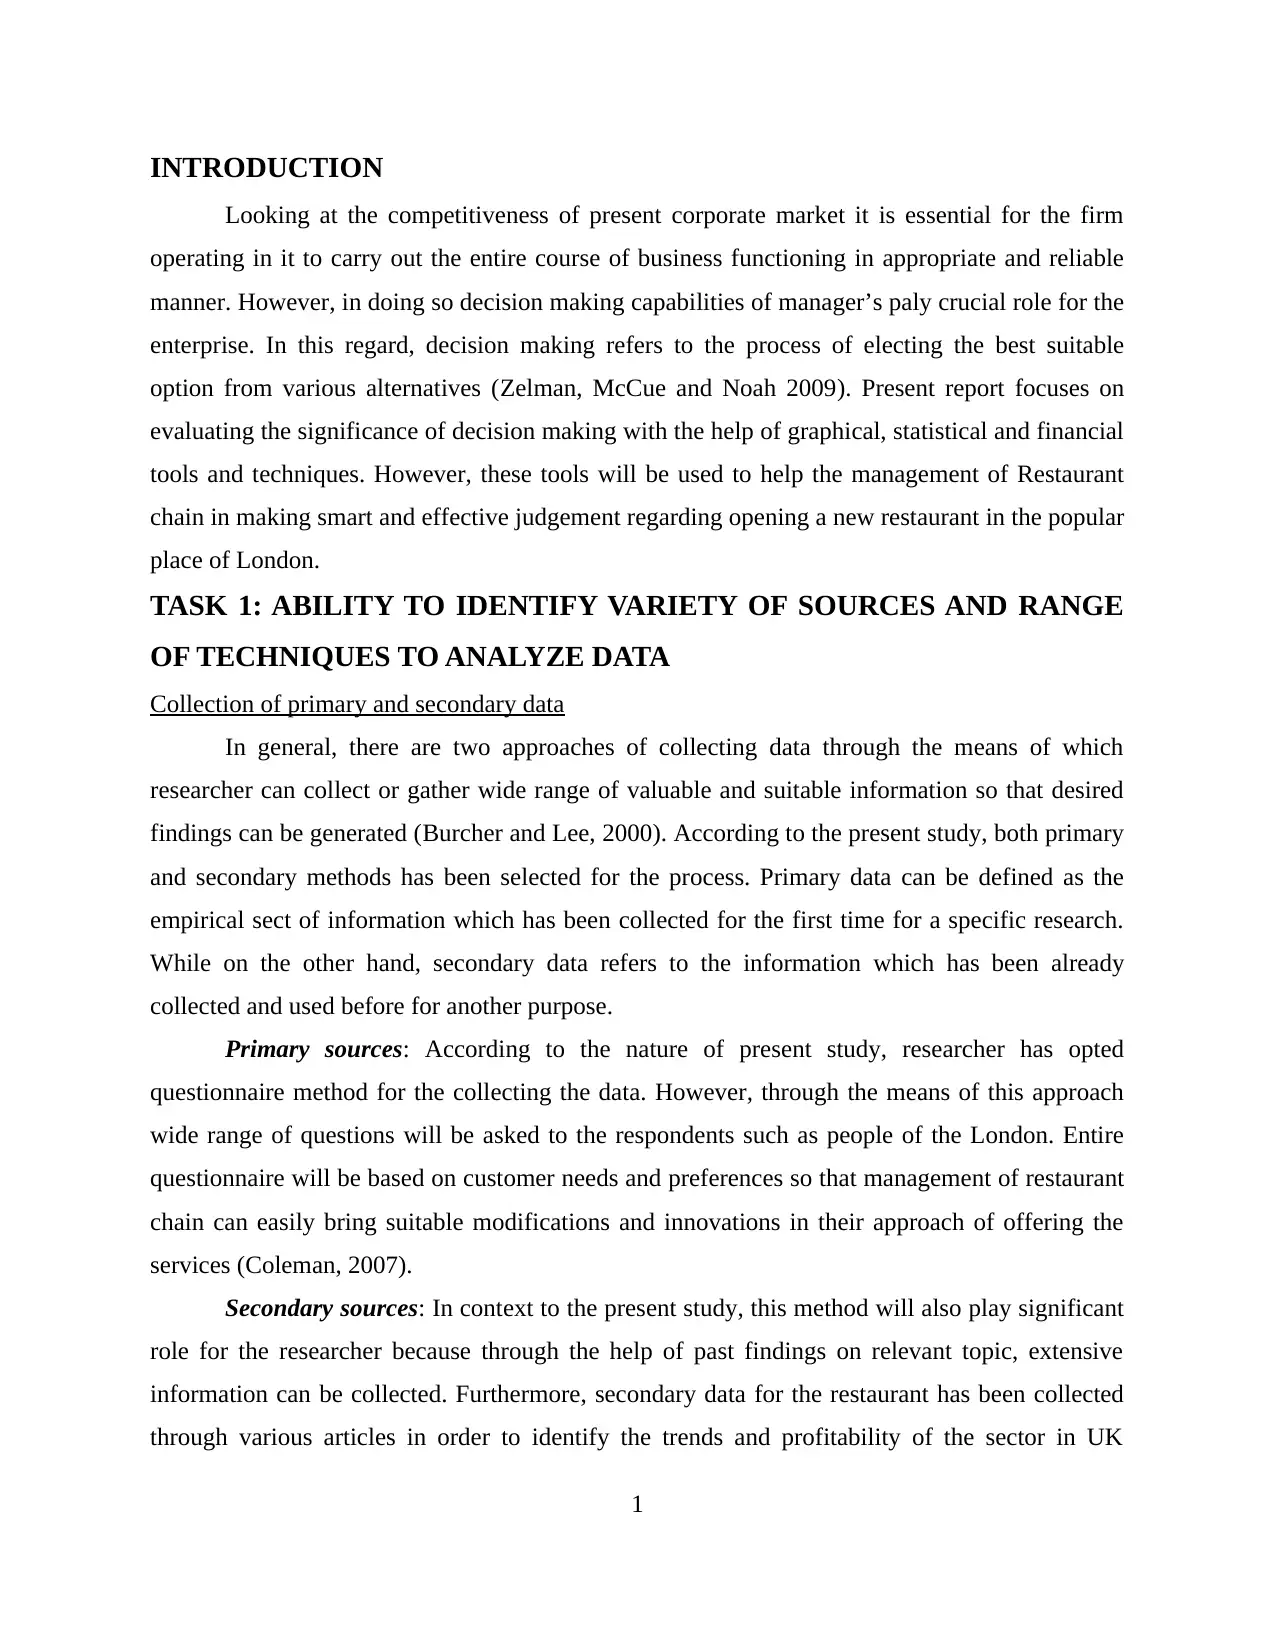
Collection of primary and secondary data
In general, there are two approaches of collecting data through the means of which
researcher can collect or gather wide range of valuable and suitable information so that desired
findings can be generated (Burcher and Lee, 2000). According to the present study, both primary
and secondary methods has been selected for the process. Primary data can be defined as the
empirical sect of information which has been collected for the first time for a specific research.
While on the other hand, secondary data refers to the information which has been already
collected and used before for another purpose.
Primary sources: According to the nature of present study, researcher has opted
questionnaire method for the collecting the data. However, through the means of this approach
wide range of questions will be asked to the respondents such as people of the London. Entire
questionnaire will be based on customer needs and preferences so that management of restaurant
chain can easily bring suitable modifications and innovations in their approach of offering the
services (Coleman, 2007).
Secondary sources: In context to the present study, this method will also play significant
role for the researcher because through the help of past findings on relevant topic, extensive
information can be collected. Furthermore, secondary data for the restaurant has been collected
through various articles in order to identify the trends and profitability of the sector in UK
1
Looking at the competitiveness of present corporate market it is essential for the firm
operating in it to carry out the entire course of business functioning in appropriate and reliable
manner. However, in doing so decision making capabilities of manager’s paly crucial role for the
enterprise. In this regard, decision making refers to the process of electing the best suitable
option from various alternatives (Zelman, McCue and Noah 2009). Present report focuses on
evaluating the significance of decision making with the help of graphical, statistical and financial
tools and techniques. However, these tools will be used to help the management of Restaurant
chain in making smart and effective judgement regarding opening a new restaurant in the popular
place of London.
TASK 1: ABILITY TO IDENTIFY VARIETY OF SOURCES AND RANGE
OF TECHNIQUES TO ANALYZE DATA
Collection of primary and secondary data
In general, there are two approaches of collecting data through the means of which
researcher can collect or gather wide range of valuable and suitable information so that desired
findings can be generated (Burcher and Lee, 2000). According to the present study, both primary
and secondary methods has been selected for the process. Primary data can be defined as the
empirical sect of information which has been collected for the first time for a specific research.
While on the other hand, secondary data refers to the information which has been already
collected and used before for another purpose.
Primary sources: According to the nature of present study, researcher has opted
questionnaire method for the collecting the data. However, through the means of this approach
wide range of questions will be asked to the respondents such as people of the London. Entire
questionnaire will be based on customer needs and preferences so that management of restaurant
chain can easily bring suitable modifications and innovations in their approach of offering the
services (Coleman, 2007).
Secondary sources: In context to the present study, this method will also play significant
role for the researcher because through the help of past findings on relevant topic, extensive
information can be collected. Furthermore, secondary data for the restaurant has been collected
through various articles in order to identify the trends and profitability of the sector in UK
1
Paraphrase This Document
Need a fresh take? Get an instant paraphrase of this document with our AI Paraphraser
(Mclean, 2002). Along with this, annual reports of different competitors present at the new
location has been analyzed to understand the sales performance and profit generation of past 10
years.
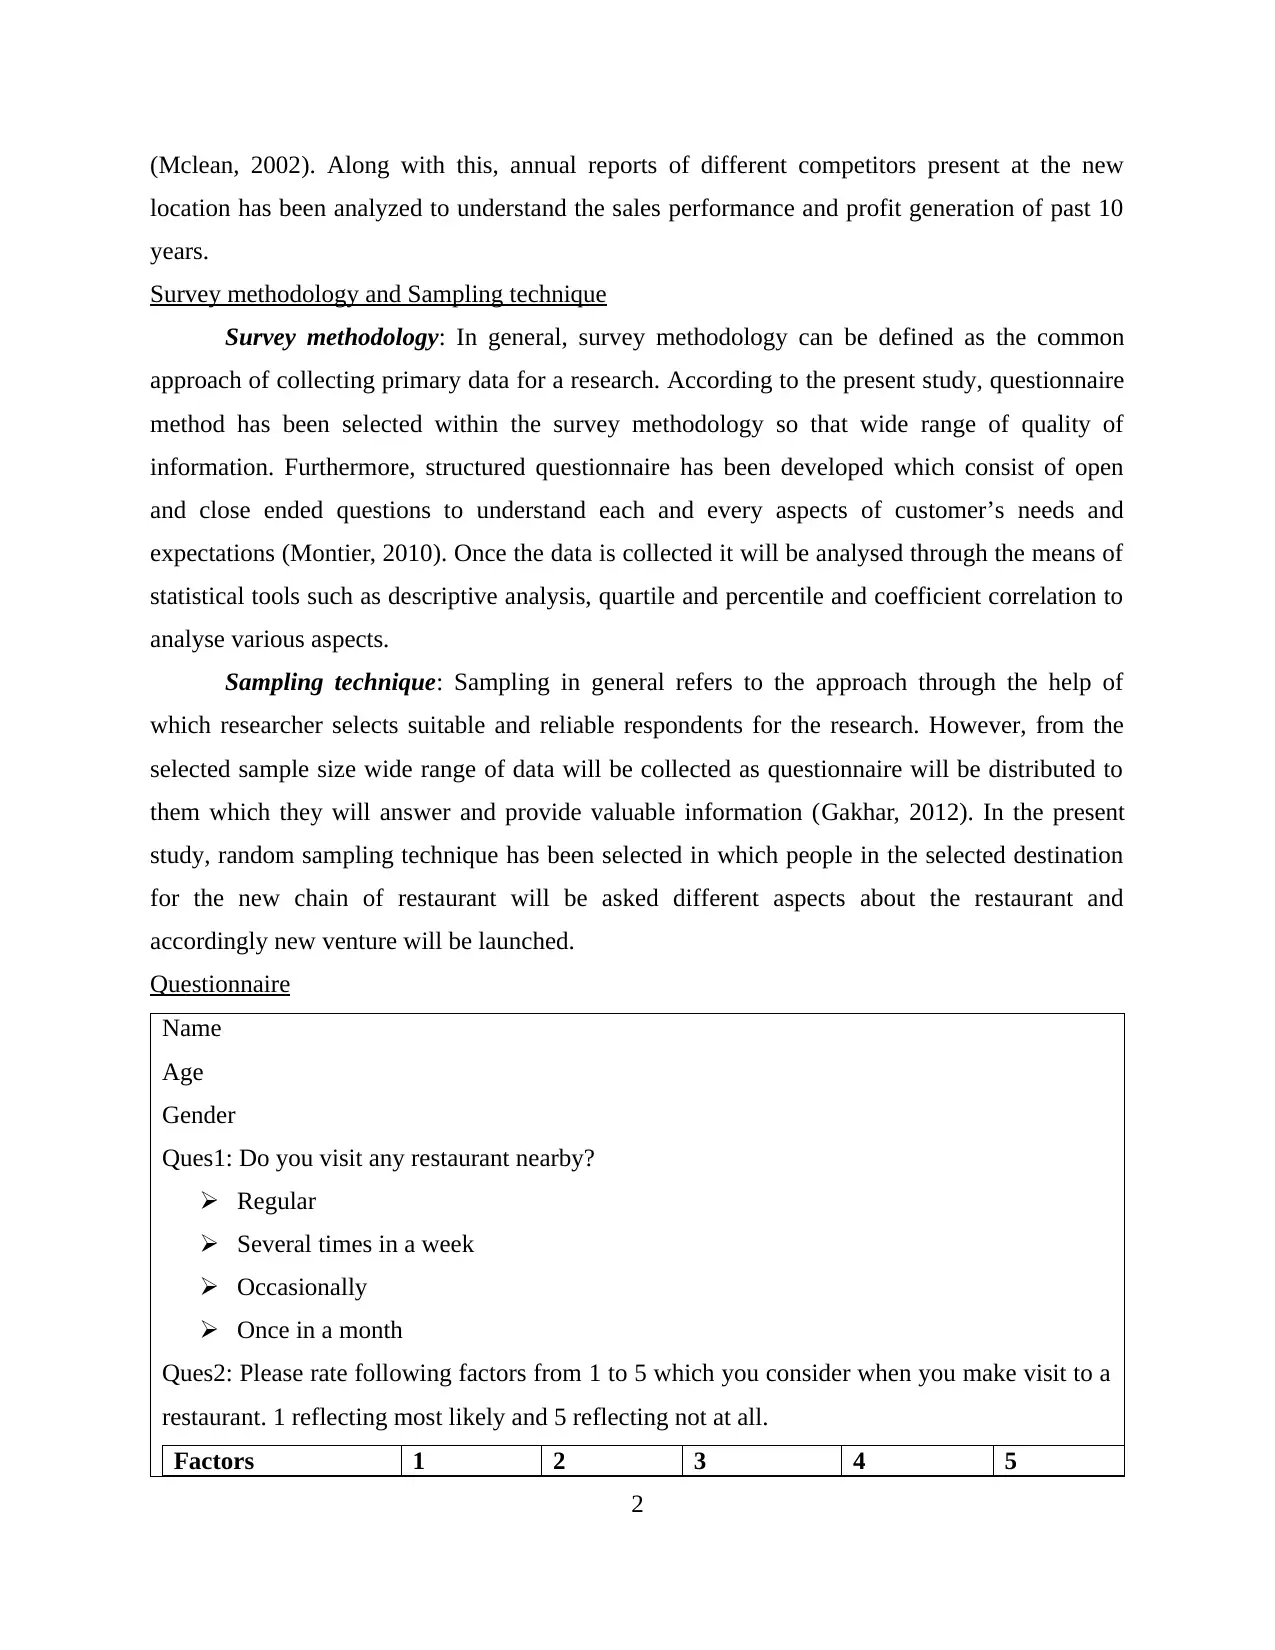
Survey methodology and Sampling technique
Survey methodology: In general, survey methodology can be defined as the common
approach of collecting primary data for a research. According to the present study, questionnaire
method has been selected within the survey methodology so that wide range of quality of
information. Furthermore, structured questionnaire has been developed which consist of open
and close ended questions to understand each and every aspects of customer’s needs and
expectations (Montier, 2010). Once the data is collected it will be analysed through the means of
statistical tools such as descriptive analysis, quartile and percentile and coefficient correlation to
analyse various aspects.
Sampling technique: Sampling in general refers to the approach through the help of
which researcher selects suitable and reliable respondents for the research. However, from the
selected sample size wide range of data will be collected as questionnaire will be distributed to
them which they will answer and provide valuable information (Gakhar, 2012). In the present
study, random sampling technique has been selected in which people in the selected destination
for the new chain of restaurant will be asked different aspects about the restaurant and
accordingly new venture will be launched.
Questionnaire
Name
Age
Gender
Ques1: Do you visit any restaurant nearby?
Regular
Several times in a week
Occasionally
Once in a month
Ques2: Please rate following factors from 1 to 5 which you consider when you make visit to a
restaurant. 1 reflecting most likely and 5 reflecting not at all.
Factors 1 2 3 4 5
2
location has been analyzed to understand the sales performance and profit generation of past 10
years.
Survey methodology and Sampling technique
Survey methodology: In general, survey methodology can be defined as the common
approach of collecting primary data for a research. According to the present study, questionnaire
method has been selected within the survey methodology so that wide range of quality of
information. Furthermore, structured questionnaire has been developed which consist of open
and close ended questions to understand each and every aspects of customer’s needs and
expectations (Montier, 2010). Once the data is collected it will be analysed through the means of
statistical tools such as descriptive analysis, quartile and percentile and coefficient correlation to
analyse various aspects.
Sampling technique: Sampling in general refers to the approach through the help of
which researcher selects suitable and reliable respondents for the research. However, from the
selected sample size wide range of data will be collected as questionnaire will be distributed to
them which they will answer and provide valuable information (Gakhar, 2012). In the present
study, random sampling technique has been selected in which people in the selected destination
for the new chain of restaurant will be asked different aspects about the restaurant and
accordingly new venture will be launched.
Questionnaire
Name
Age
Gender
Ques1: Do you visit any restaurant nearby?
Regular
Several times in a week
Occasionally
Once in a month
Ques2: Please rate following factors from 1 to 5 which you consider when you make visit to a
restaurant. 1 reflecting most likely and 5 reflecting not at all.
Factors 1 2 3 4 5
2
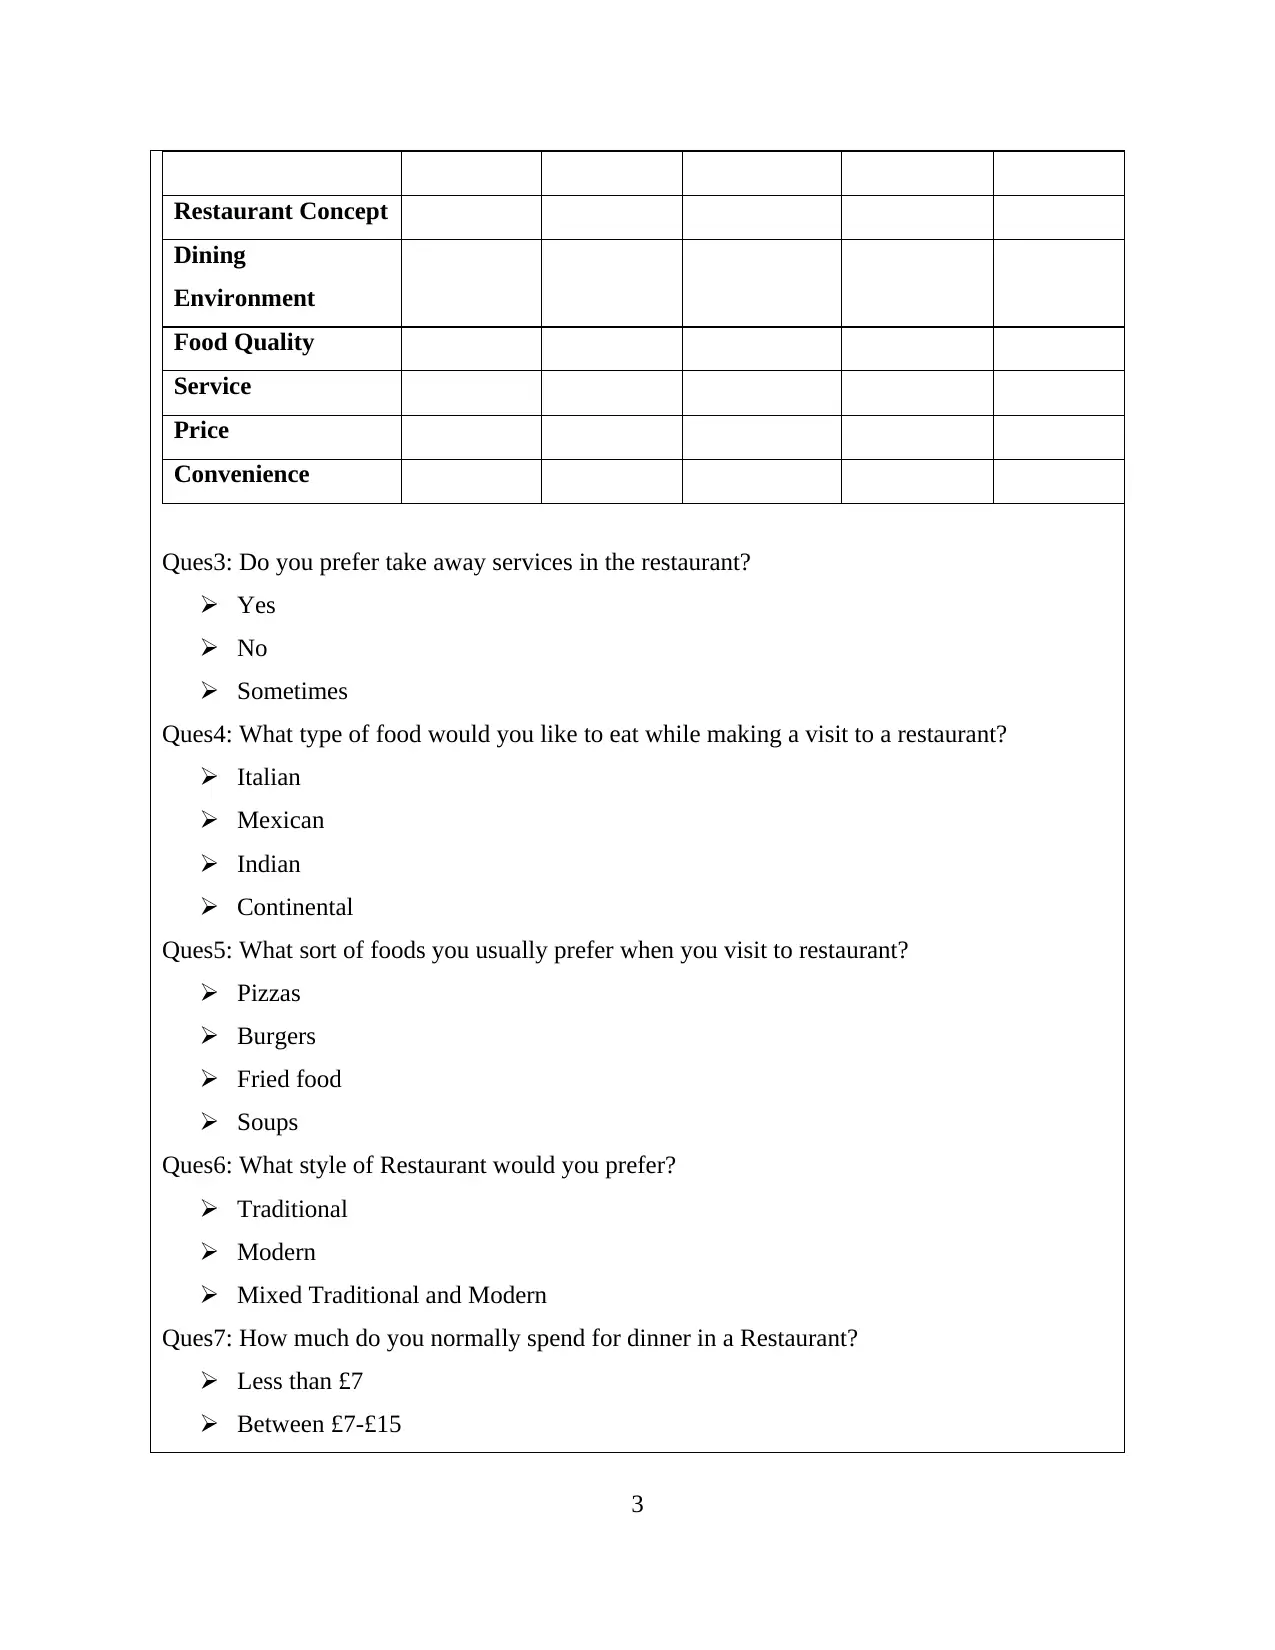
Restaurant Concept
Dining
Environment
Food Quality
Service
Price
Convenience
Ques3: Do you prefer take away services in the restaurant?
Yes
No
Sometimes
Ques4: What type of food would you like to eat while making a visit to a restaurant?
Italian
Mexican
Indian
Continental
Ques5: What sort of foods you usually prefer when you visit to restaurant?
Pizzas
Burgers
Fried food
Soups
Ques6: What style of Restaurant would you prefer?
Traditional
Modern
Mixed Traditional and Modern
Ques7: How much do you normally spend for dinner in a Restaurant?
Less than £7
Between £7-£15
3
⊘ This is a preview!⊘
Do you want full access?
Subscribe today to unlock all pages.
Trusted by 1+ million students worldwide
Above £15
Ques8: What attracts you the most if offered in a Restaurant?
Live music
Acted or Cultural club
Karaoke nights
Ques9: As per your view, what are the recommendations which you want that to be adopted by
the restaurants which you usually visit?
___________________________________________________________________________
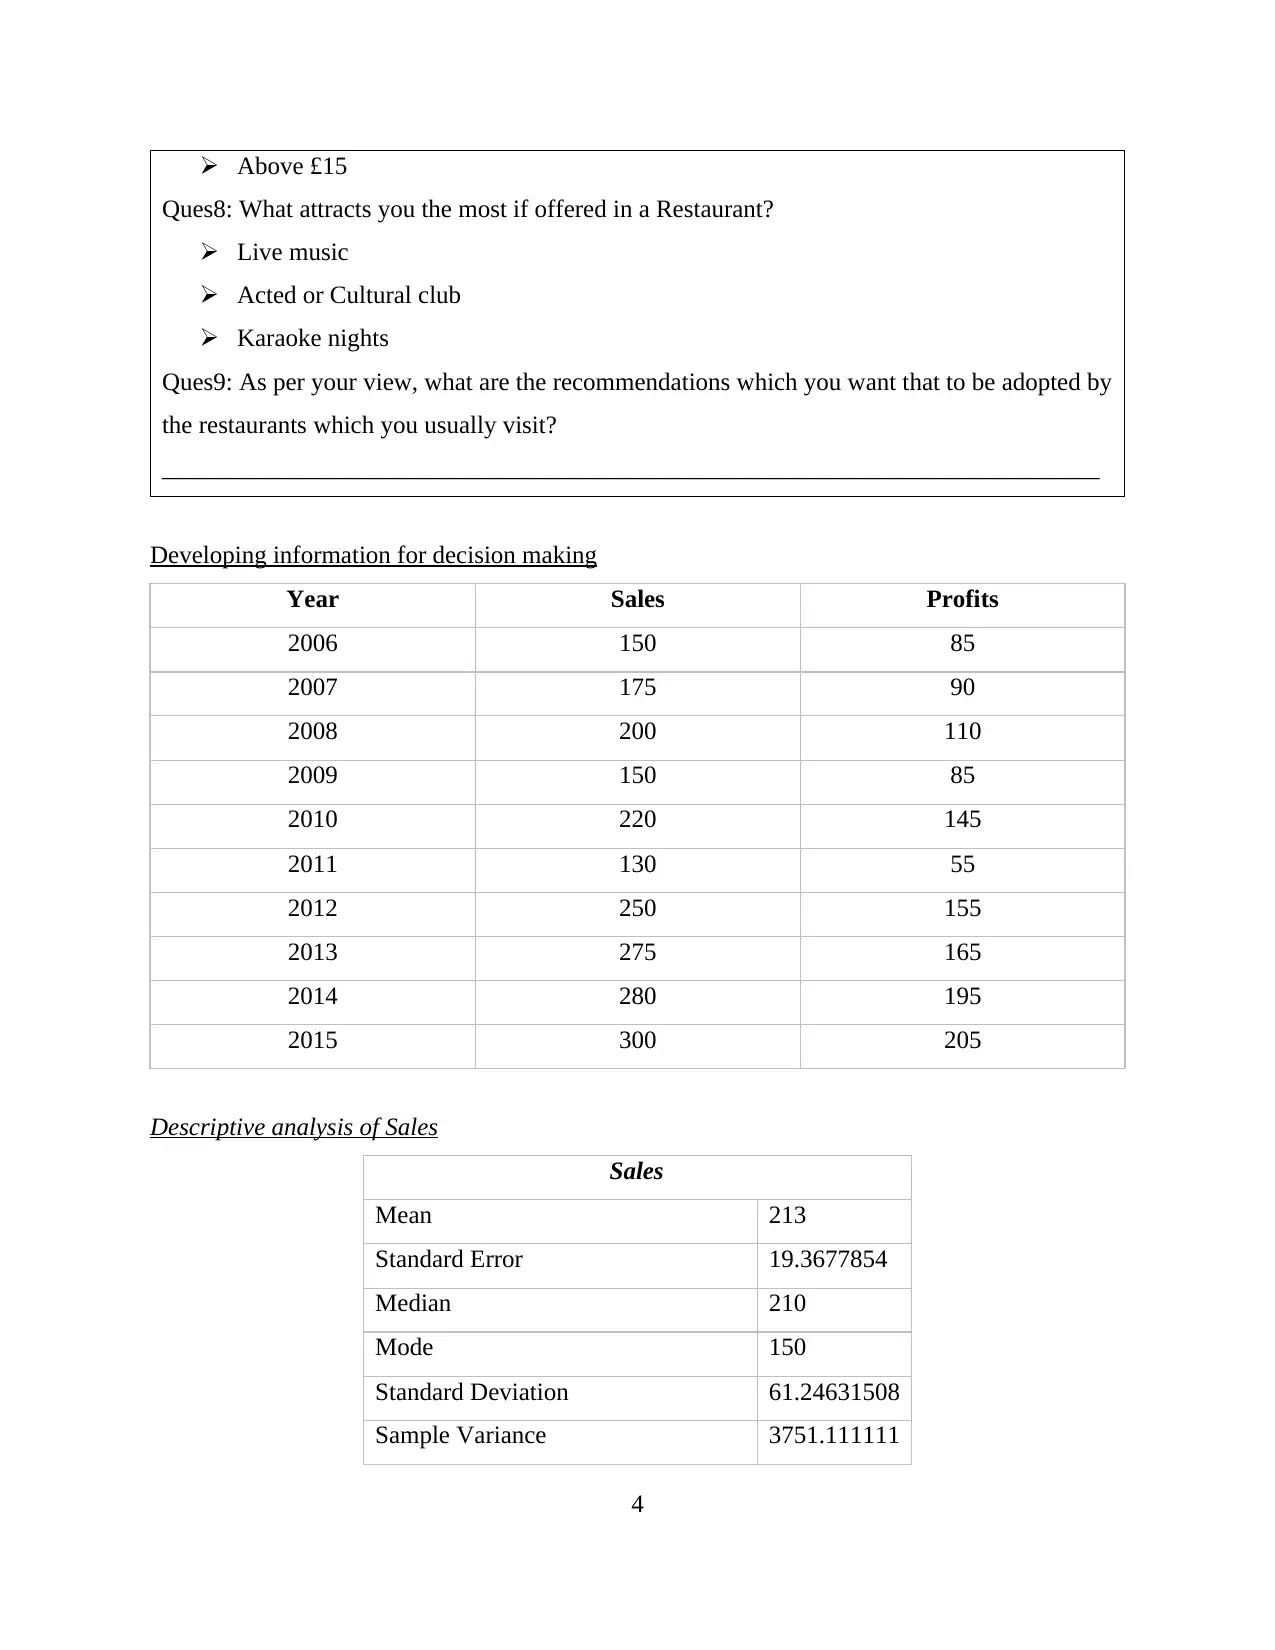
Developing information for decision making
Year Sales Profits
2006 150 85
2007 175 90
2008 200 110
2009 150 85
2010 220 145
2011 130 55
2012 250 155
2013 275 165
2014 280 195
2015 300 205
Descriptive analysis of Sales
Sales
Mean 213
Standard Error 19.3677854
Median 210
Mode 150
Standard Deviation 61.24631508
Sample Variance 3751.111111
4
Ques8: What attracts you the most if offered in a Restaurant?
Live music
Acted or Cultural club
Karaoke nights
Ques9: As per your view, what are the recommendations which you want that to be adopted by
the restaurants which you usually visit?
___________________________________________________________________________
Developing information for decision making
Year Sales Profits
2006 150 85
2007 175 90
2008 200 110
2009 150 85
2010 220 145
2011 130 55
2012 250 155
2013 275 165
2014 280 195
2015 300 205
Descriptive analysis of Sales
Sales
Mean 213
Standard Error 19.3677854
Median 210
Mode 150
Standard Deviation 61.24631508
Sample Variance 3751.111111
4
Paraphrase This Document
Need a fresh take? Get an instant paraphrase of this document with our AI Paraphraser
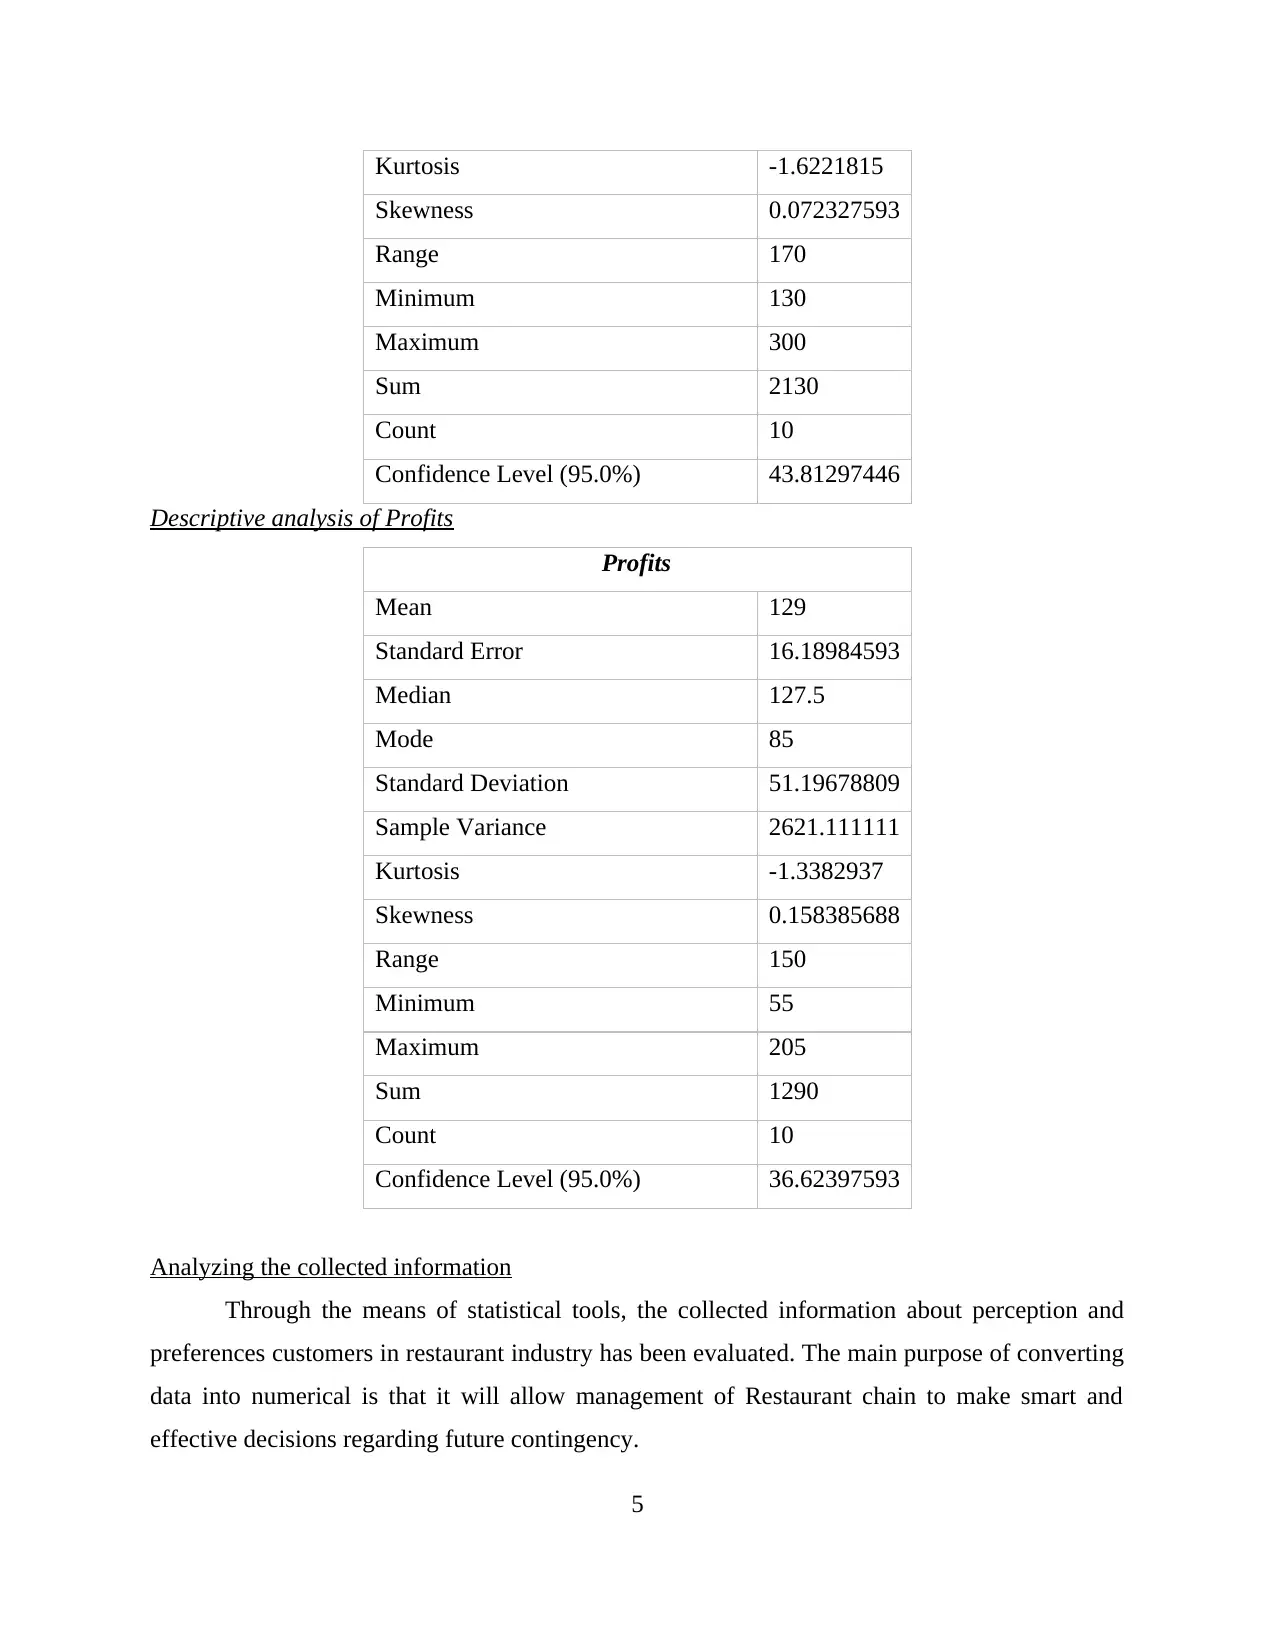
Kurtosis -1.6221815
Skewness 0.072327593
Range 170
Minimum 130
Maximum 300
Sum 2130
Count 10
Confidence Level (95.0%) 43.81297446
Descriptive analysis of Profits
Profits
Mean 129
Standard Error 16.18984593
Median 127.5
Mode 85
Standard Deviation 51.19678809
Sample Variance 2621.111111
Kurtosis -1.3382937
Skewness 0.158385688
Range 150
Minimum 55
Maximum 205
Sum 1290
Count 10
Confidence Level (95.0%) 36.62397593
Analyzing the collected information
Through the means of statistical tools, the collected information about perception and
preferences customers in restaurant industry has been evaluated. The main purpose of converting
data into numerical is that it will allow management of Restaurant chain to make smart and
effective decisions regarding future contingency.
5
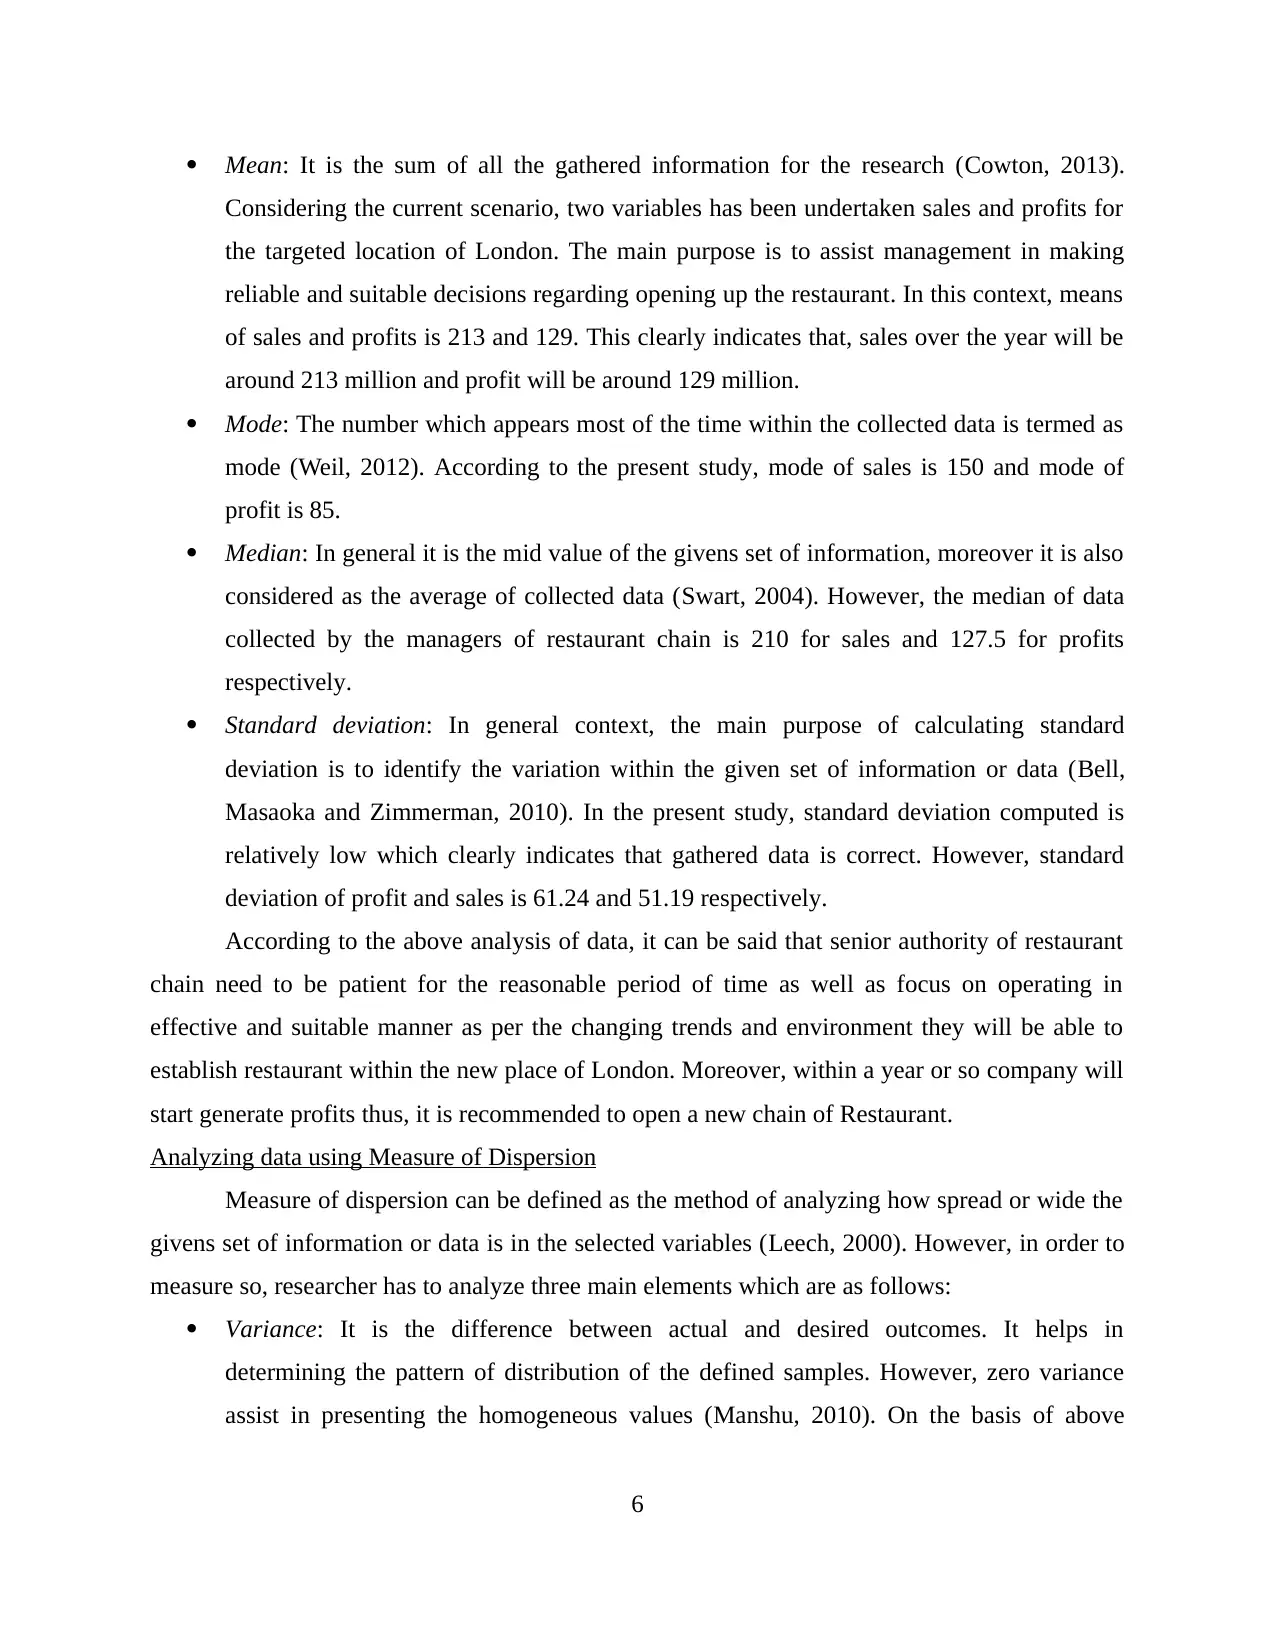
Mean: It is the sum of all the gathered information for the research (Cowton, 2013).
Considering the current scenario, two variables has been undertaken sales and profits for
the targeted location of London. The main purpose is to assist management in making
reliable and suitable decisions regarding opening up the restaurant. In this context, means
of sales and profits is 213 and 129. This clearly indicates that, sales over the year will be
around 213 million and profit will be around 129 million.
Mode: The number which appears most of the time within the collected data is termed as
mode (Weil, 2012). According to the present study, mode of sales is 150 and mode of
profit is 85.
Median: In general it is the mid value of the givens set of information, moreover it is also
considered as the average of collected data (Swart, 2004). However, the median of data
collected by the managers of restaurant chain is 210 for sales and 127.5 for profits
respectively.
Standard deviation: In general context, the main purpose of calculating standard
deviation is to identify the variation within the given set of information or data (Bell,
Masaoka and Zimmerman, 2010). In the present study, standard deviation computed is
relatively low which clearly indicates that gathered data is correct. However, standard
deviation of profit and sales is 61.24 and 51.19 respectively.
According to the above analysis of data, it can be said that senior authority of restaurant
chain need to be patient for the reasonable period of time as well as focus on operating in
effective and suitable manner as per the changing trends and environment they will be able to
establish restaurant within the new place of London. Moreover, within a year or so company will
start generate profits thus, it is recommended to open a new chain of Restaurant.
Analyzing data using Measure of Dispersion
Measure of dispersion can be defined as the method of analyzing how spread or wide the
givens set of information or data is in the selected variables (Leech, 2000). However, in order to
measure so, researcher has to analyze three main elements which are as follows:
Variance: It is the difference between actual and desired outcomes. It helps in
determining the pattern of distribution of the defined samples. However, zero variance
assist in presenting the homogeneous values (Manshu, 2010). On the basis of above
6
⊘ This is a preview!⊘
Do you want full access?
Subscribe today to unlock all pages.
Trusted by 1+ million students worldwide
sample, variance for sales and profit is 3751.1 and 2621.1 respectively. Thus, it indicates
restaurant business sales and profits are volatile from the mean values.
Standard Deviation: The main purpose of calculating standard deviation is to identify the
variation within the given set of information or data. In the present study, standard
deviation computed is relatively low which clearly indicates that gathered data is correct.
However, standard deviation of profit and sales is 61.24 and 51.19 respectively.
Range: This element aids in identifying as well as assessing the different between highest
value and lowest value of the define population (Afonso, 2009). Range is determined by
deducting minimum value from maximum value. Range of present gathered data is 170
and 150 for sales and profits respectively.
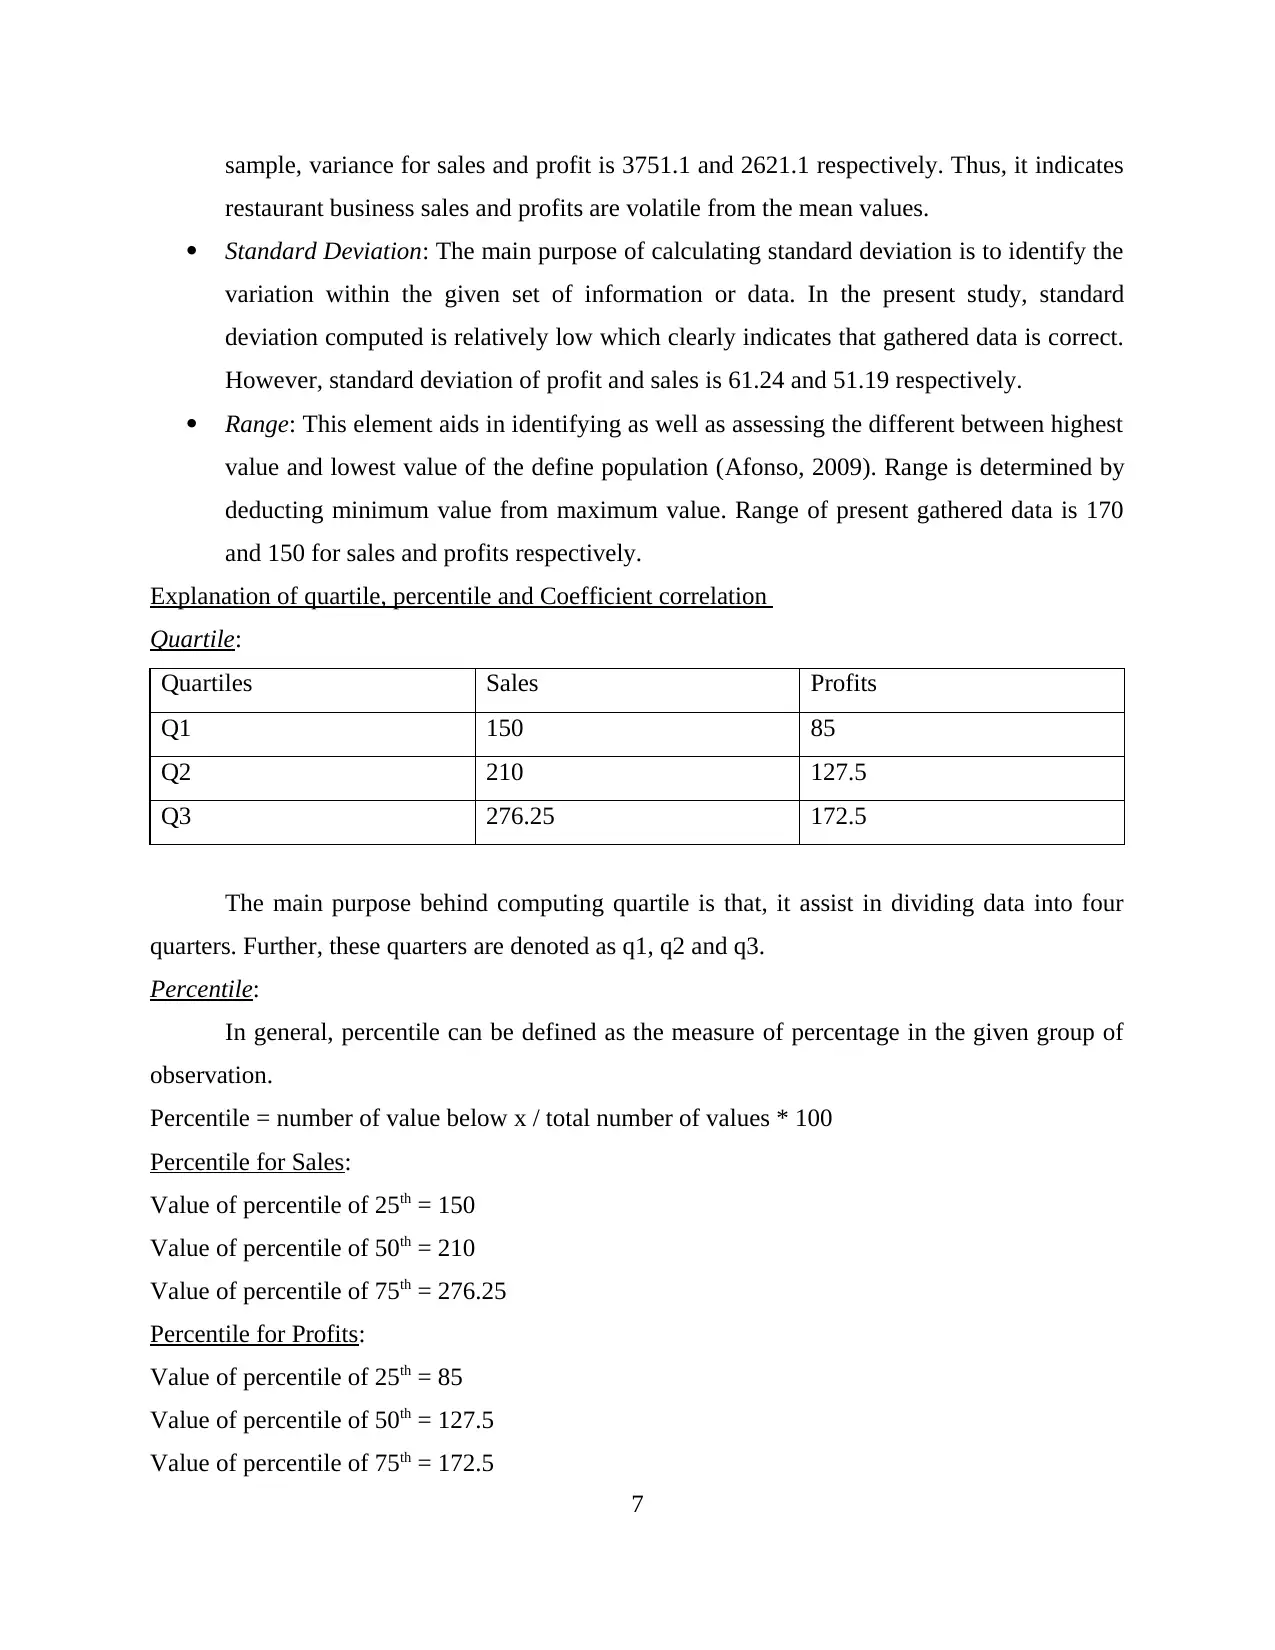
Explanation of quartile, percentile and Coefficient correlation
Quartile:
Quartiles Sales Profits
Q1 150 85
Q2 210 127.5
Q3 276.25 172.5
The main purpose behind computing quartile is that, it assist in dividing data into four
quarters. Further, these quarters are denoted as q1, q2 and q3.
Percentile:
In general, percentile can be defined as the measure of percentage in the given group of
observation.
Percentile = number of value below x / total number of values * 100
Percentile for Sales:
Value of percentile of 25th = 150
Value of percentile of 50th = 210
Value of percentile of 75th = 276.25
Percentile for Profits:
Value of percentile of 25th = 85
Value of percentile of 50th = 127.5
Value of percentile of 75th = 172.5
7
restaurant business sales and profits are volatile from the mean values.
Standard Deviation: The main purpose of calculating standard deviation is to identify the
variation within the given set of information or data. In the present study, standard
deviation computed is relatively low which clearly indicates that gathered data is correct.
However, standard deviation of profit and sales is 61.24 and 51.19 respectively.
Range: This element aids in identifying as well as assessing the different between highest
value and lowest value of the define population (Afonso, 2009). Range is determined by
deducting minimum value from maximum value. Range of present gathered data is 170
and 150 for sales and profits respectively.
Explanation of quartile, percentile and Coefficient correlation
Quartile:
Quartiles Sales Profits
Q1 150 85
Q2 210 127.5
Q3 276.25 172.5
The main purpose behind computing quartile is that, it assist in dividing data into four
quarters. Further, these quarters are denoted as q1, q2 and q3.
Percentile:
In general, percentile can be defined as the measure of percentage in the given group of
observation.
Percentile = number of value below x / total number of values * 100
Percentile for Sales:
Value of percentile of 25th = 150
Value of percentile of 50th = 210
Value of percentile of 75th = 276.25
Percentile for Profits:
Value of percentile of 25th = 85
Value of percentile of 50th = 127.5
Value of percentile of 75th = 172.5
7
Paraphrase This Document
Need a fresh take? Get an instant paraphrase of this document with our AI Paraphraser
Correlation coefficient:
Coefficient correlation
Sales Profits
Sales 1 0.983504
Profits 0.983504 1
The main aim behind computing correlation coefficient is that it helps in evaluating the
relationship between two variables. However, in the present study, sales and profit has been
defined as the two variables (Mike, 2012). Through the help of below defined calculation it has
been evaluated that, sales and profit are highly correlated to each other and if one increase other
will also increase and vice-verse.
TASK 2: USE OF STATISTICAL GRAPHS AND REPORTS FOR
DECISION MAKING AND SOFTWARE GENERATED INFORMATION
FOR DECISION MAKING
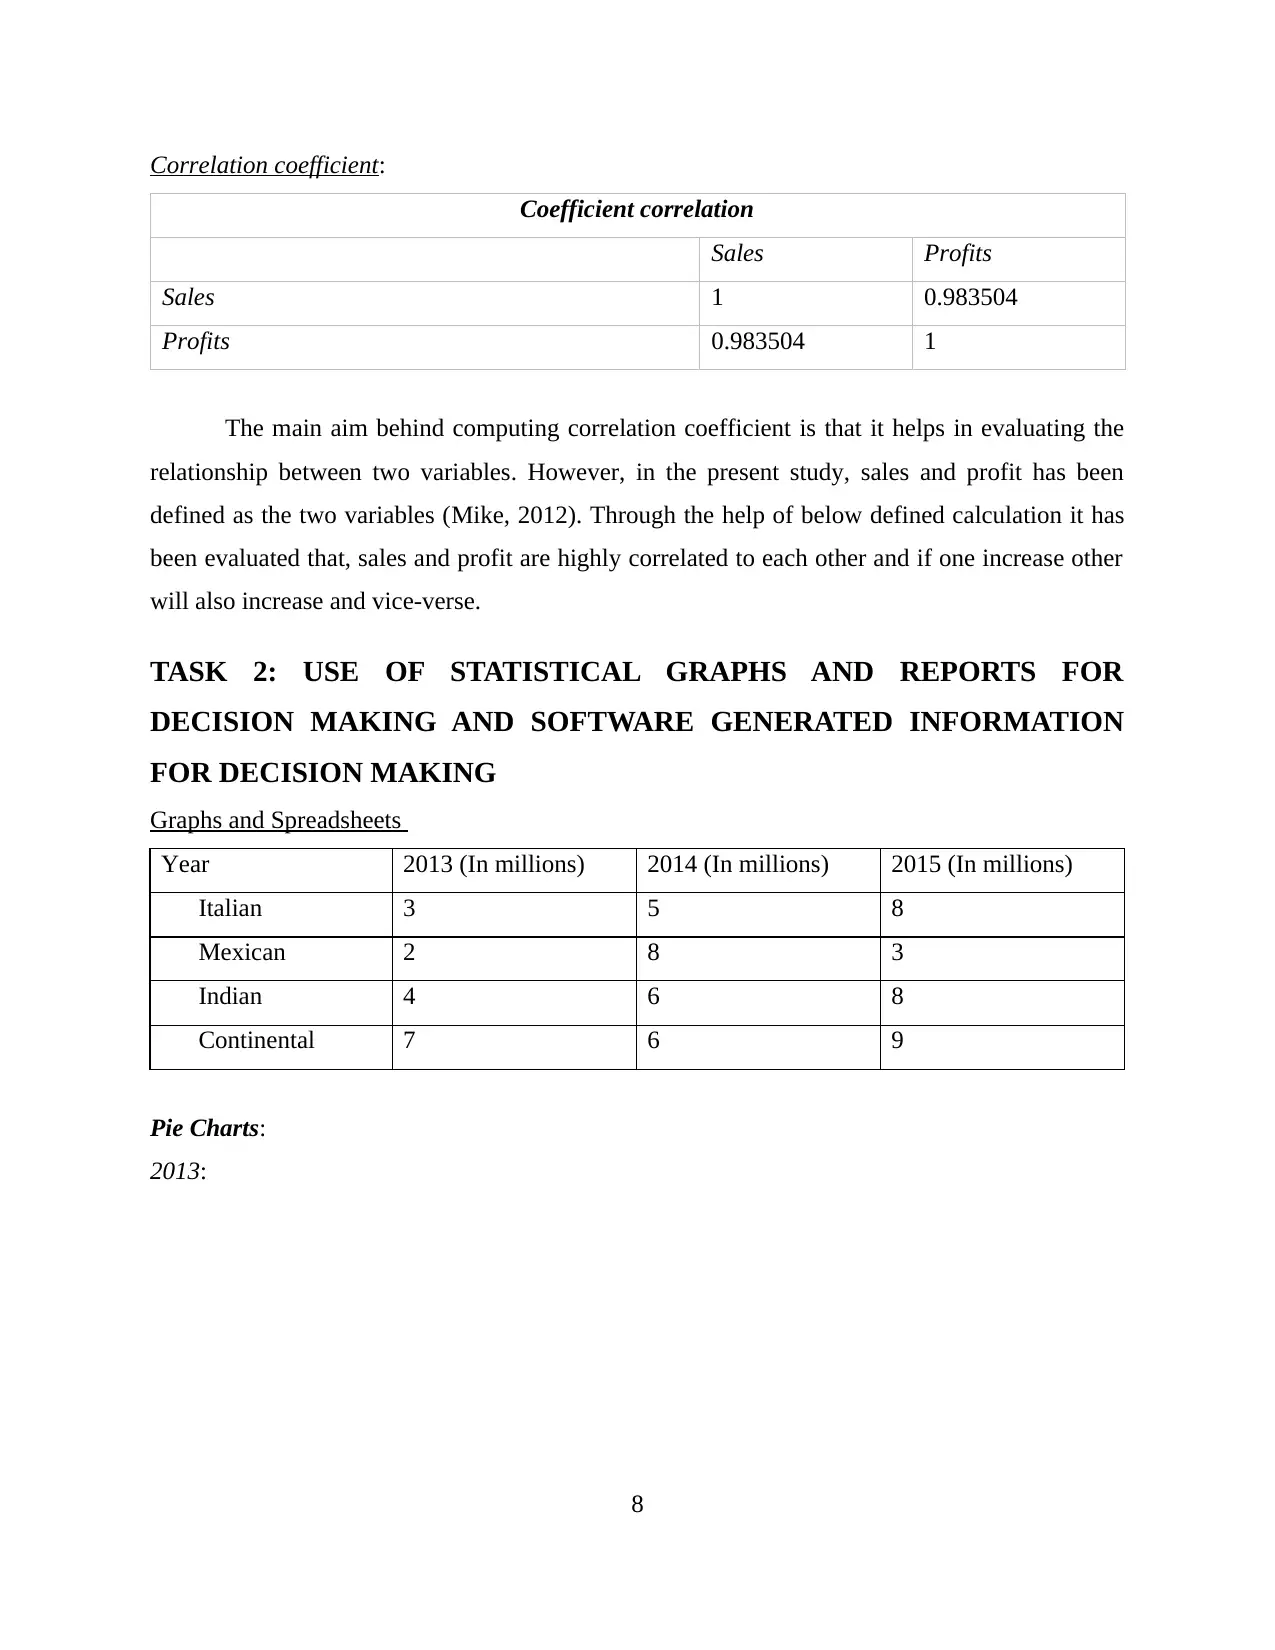
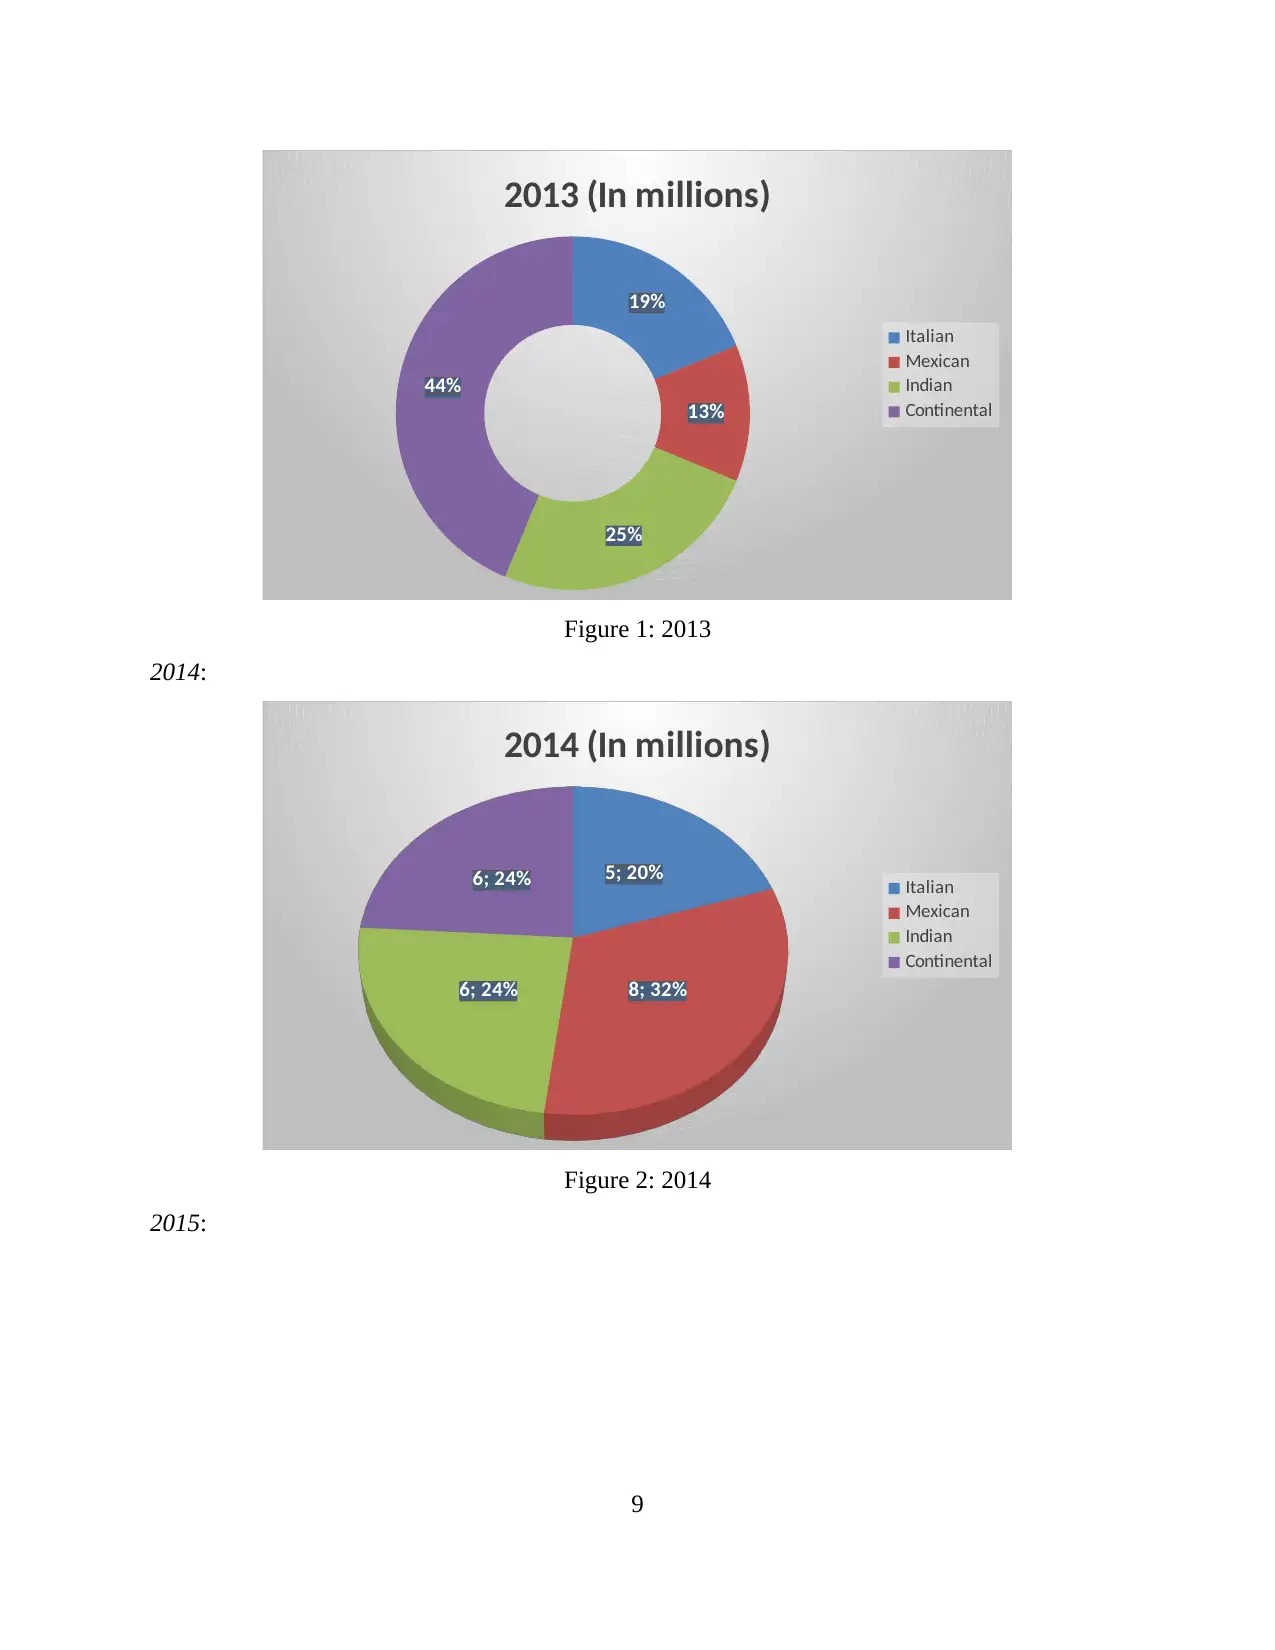
Graphs and Spreadsheets
Year 2013 (In millions) 2014 (In millions) 2015 (In millions)
Italian 3 5 8
Mexican 2 8 3
Indian 4 6 8
Continental 7 6 9
Pie Charts:
2013:
8
Coefficient correlation
Sales Profits
Sales 1 0.983504
Profits 0.983504 1
The main aim behind computing correlation coefficient is that it helps in evaluating the
relationship between two variables. However, in the present study, sales and profit has been
defined as the two variables (Mike, 2012). Through the help of below defined calculation it has
been evaluated that, sales and profit are highly correlated to each other and if one increase other
will also increase and vice-verse.
TASK 2: USE OF STATISTICAL GRAPHS AND REPORTS FOR
DECISION MAKING AND SOFTWARE GENERATED INFORMATION
FOR DECISION MAKING
Graphs and Spreadsheets
Year 2013 (In millions) 2014 (In millions) 2015 (In millions)
Italian 3 5 8
Mexican 2 8 3
Indian 4 6 8
Continental 7 6 9
Pie Charts:
2013:
8
19%
13%
25%
44%
2013 (In millions)
Italian
Mexican
Indian
Continental
Figure 1: 2013
2014:
5; 20%
8; 32%6; 24%
6; 24%
2014 (In millions)
Italian
Mexican
Indian
Continental
Figure 2: 2014
2015:
9
13%
25%
44%
2013 (In millions)
Italian
Mexican
Indian
Continental
Figure 1: 2013
2014:
5; 20%
8; 32%6; 24%
6; 24%
2014 (In millions)
Italian
Mexican
Indian
Continental
Figure 2: 2014
2015:
9
⊘ This is a preview!⊘
Do you want full access?
Subscribe today to unlock all pages.
Trusted by 1+ million students worldwide
1 out of 23
Related Documents


Your All-in-One AI-Powered Toolkit for Academic Success.
+13062052269
info@desklib.com
Available 24*7 on WhatsApp / Email
![[object Object]](/_next/static/media/star-bottom.7253800d.svg)
Unlock your academic potential
Copyright © 2020–2026 A2Z Services. All Rights Reserved. Developed and managed by ZUCOL.