Business Decision Making Report: Analysis of UK Fresh Juice Industry
VerifiedAdded on 2019/12/03
|22
|4797
|236
Report
AI Summary
This report provides a detailed analysis of the UK Fresh Juice industry, focusing on business decision-making processes. The report begins with an introduction to data collection methods, including primary and secondary sources, and highlights their importance for understanding consumer behavior. Task 1 explores consumer profiles, preferences, attitudes, and buying behaviors, along with survey methodologies and questionnaire design for UK Fresh Juice. Task 2 delves into data analysis techniques, including frequency tables, charts, and statistical tools like quartile and percentile deviation. The report analyzes both primary data collected through surveys and secondary data from industry records, examining sales, profits, and trends. Task 3 focuses on constructing charts, trend lines, and graphical representations to analyze data and draw conclusions, culminating in a formal business report. Finally, Task 4 outlines a project plan for launching a new product in the market. The report concludes with a summary of findings and references to relevant literature.

BUSINESS DECISION
MAKING
MAKING
Paraphrase This Document
Need a fresh take? Get an instant paraphrase of this document with our AI Paraphraser
TABLE OF CONTENTS
INTRODUCTION......................................................................................................................1
TASK 1......................................................................................................................................1
AC 1.1 Determination of consumer profile, preferences, attitude and their buying
behaviour...............................................................................................................................1
(B) Survey methodology and sampling method....................................................................2
(C) Designing of questionnaire for UK Fresh Juice organization.........................................3
TASK 2......................................................................................................................................5
AC 2.1 Data analysis of collected primary and secondary data............................................5
(B) Quartile and percentile deviation and correlation...........................................................9
Task 3.......................................................................................................................................10
(A) Analysis and conclusion by construction charts...........................................................10
(B) Construction of Trend Line...........................................................................................12
(C)Analysis through graphical representation.....................................................................13
(D) Formal Business Report................................................................................................13
TASK 4....................................................................................................................................13
Project plan for launching a new product in the market......................................................13
CONCLUSION........................................................................................................................15
REFERENCES:........................................................................................................................16

INDEX OF TABLES
Table 1: sales and profit of UK Fresh Juice Industry (In £).......................................................7
Table 2: Descriptive statistics.....................................................................................................8
Table 3: Quartile and percentile deviation of sales (In £)..........................................................9
Table 4: Quartile and percentile deviation of profits (In £).......................................................9
Table 5: Correlation between sales and profits........................................................................10
Table 6: Histogram of sales......................................................................................................11
Table 7: Histogram of profits...................................................................................................11
⊘ This is a preview!⊘
Do you want full access?
Subscribe today to unlock all pages.
Trusted by 1+ million students worldwide
INTRODUCTION
Every organization needs to collect the necessary data and analyse it through different
analytical tools. There are two sources available to collect the required data, that is, primary
as well as secondary. However, data analysis can be done by preparing different kinds of
charts. Moreover, it can be done by applying variety of analytical tools such as average,
correlation and quartile as well as percentile deviation. This report will help in identifying
different sources of data collection for Fresh Juice Manufacturer Company in London (Laing,
Ross and Joubert, 2014). Moreover, it determines the techniques that are available for data
analysis. In addition to this, the present report will also focus on identifying the financial
viability of project.
TASK 1
AC 1.1 Determination of consumer profile, preferences, attitude and their buying behaviour
Data collection is an important activity and concerned with the preparation of
necessary data in a suitable manner. Information can be required for different purposes of the
organization for which primary and secondary sources are available.
Primary sources: This kind of data is collected by the investigator himself for the first
time. Every researcher identifies his own requirement and collects data by research (Zeleny
and Cochrane, 2010). It is also termed as the original information because this is collected by
the researcher himself. Primary research helps the organization to collect quantitative as well
as qualitative data.
Secondary sources: This type of data is previously collected by the others for their
purpose. It is also termed as published sources and includes internal and external information.
Internal data is already available in the organization such as their financial statements or
previous records. However, external data involves journals, newspaper, magazines and other
published sources outside the organization.
Fresh Juice Manufacturer in UK also conducts primary and secondary research so as
to identify the customer choices, consumer profile, their attitude and purchasing behaviour.
Consumer profile: It is the process of classifying consumers on the basis of different
factors. Fresh Juice Manufacturer of UK can classify the customers on the basis of their
locality, literacy, demographic and psychological factors. It helps the organization for
advertisement and marketing purpose. Research can organize the field surveys and direct
observation of customers as the primary source of data collection. However, secondary
1 | P a g e
Paraphrase This Document
Need a fresh take? Get an instant paraphrase of this document with our AI Paraphraser
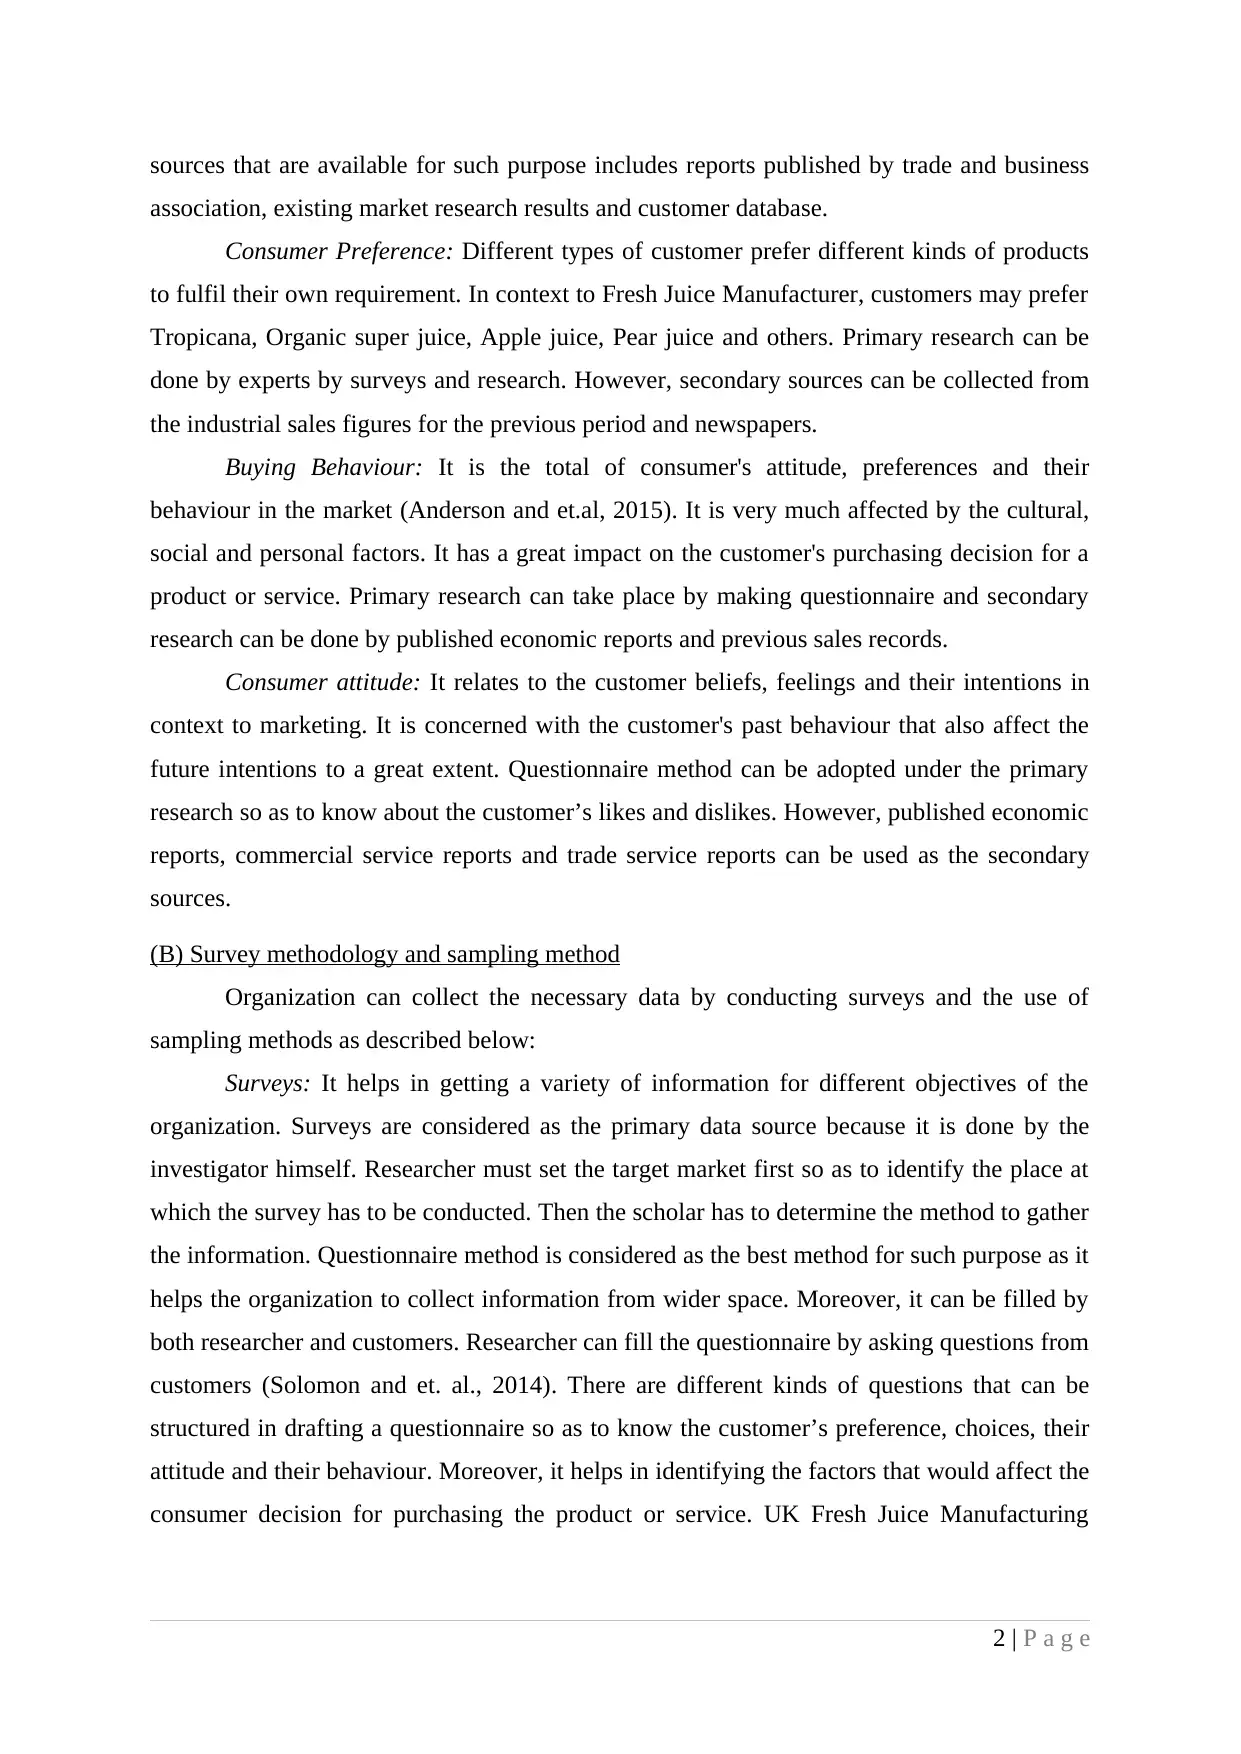
sources that are available for such purpose includes reports published by trade and business
association, existing market research results and customer database.
Consumer Preference: Different types of customer prefer different kinds of products
to fulfil their own requirement. In context to Fresh Juice Manufacturer, customers may prefer
Tropicana, Organic super juice, Apple juice, Pear juice and others. Primary research can be
done by experts by surveys and research. However, secondary sources can be collected from
the industrial sales figures for the previous period and newspapers.
Buying Behaviour: It is the total of consumer's attitude, preferences and their
behaviour in the market (Anderson and et.al, 2015). It is very much affected by the cultural,
social and personal factors. It has a great impact on the customer's purchasing decision for a
product or service. Primary research can take place by making questionnaire and secondary
research can be done by published economic reports and previous sales records.
Consumer attitude: It relates to the customer beliefs, feelings and their intentions in
context to marketing. It is concerned with the customer's past behaviour that also affect the
future intentions to a great extent. Questionnaire method can be adopted under the primary
research so as to know about the customer’s likes and dislikes. However, published economic
reports, commercial service reports and trade service reports can be used as the secondary
sources.
(B) Survey methodology and sampling method
Organization can collect the necessary data by conducting surveys and the use of
sampling methods as described below:
Surveys: It helps in getting a variety of information for different objectives of the
organization. Surveys are considered as the primary data source because it is done by the
investigator himself. Researcher must set the target market first so as to identify the place at
which the survey has to be conducted. Then the scholar has to determine the method to gather
the information. Questionnaire method is considered as the best method for such purpose as it
helps the organization to collect information from wider space. Moreover, it can be filled by
both researcher and customers. Researcher can fill the questionnaire by asking questions from
customers (Solomon and et. al., 2014). There are different kinds of questions that can be
structured in drafting a questionnaire so as to know the customer’s preference, choices, their
attitude and their behaviour. Moreover, it helps in identifying the factors that would affect the
consumer decision for purchasing the product or service. UK Fresh Juice Manufacturing
2 | P a g e
Company can also use this method. It is an appropriate method because it is a confidential
source of information and takes less time and eliminates bias.
Sampling method: It is not always possible to collect the data of complete research
universe, that is, the target segment. Therefore, the sampling method will be used by the
organization. In this method, researcher determines the appropriate size of sample and
collects the related data. The sample should be a representative of the universe. Through this
method, the investigator can analyse the universe by collecting data of sample only. The
sample can be selected by two methods which are random sampling and non random
sampling. In random sampling, all the units of universe have an equal chance of possibility of
inclusion in the sample. The best advantage is that sampling error can be estimated in this
method (Ibrahim Dumas and McGuire, 2015). However, in non random sampling, sample is
determined on the basis of some factor. It is used by the organization for their convenience
and speed. Quota sampling and judgemental sampling is the type of such techniques.
Therefore, it can be concluded that random sampling will be more appropriate method for
UK Fresh Juice Manufacturers as it eliminates the present biases. Moreover, the probability
of all the units for determining the sample is equal.
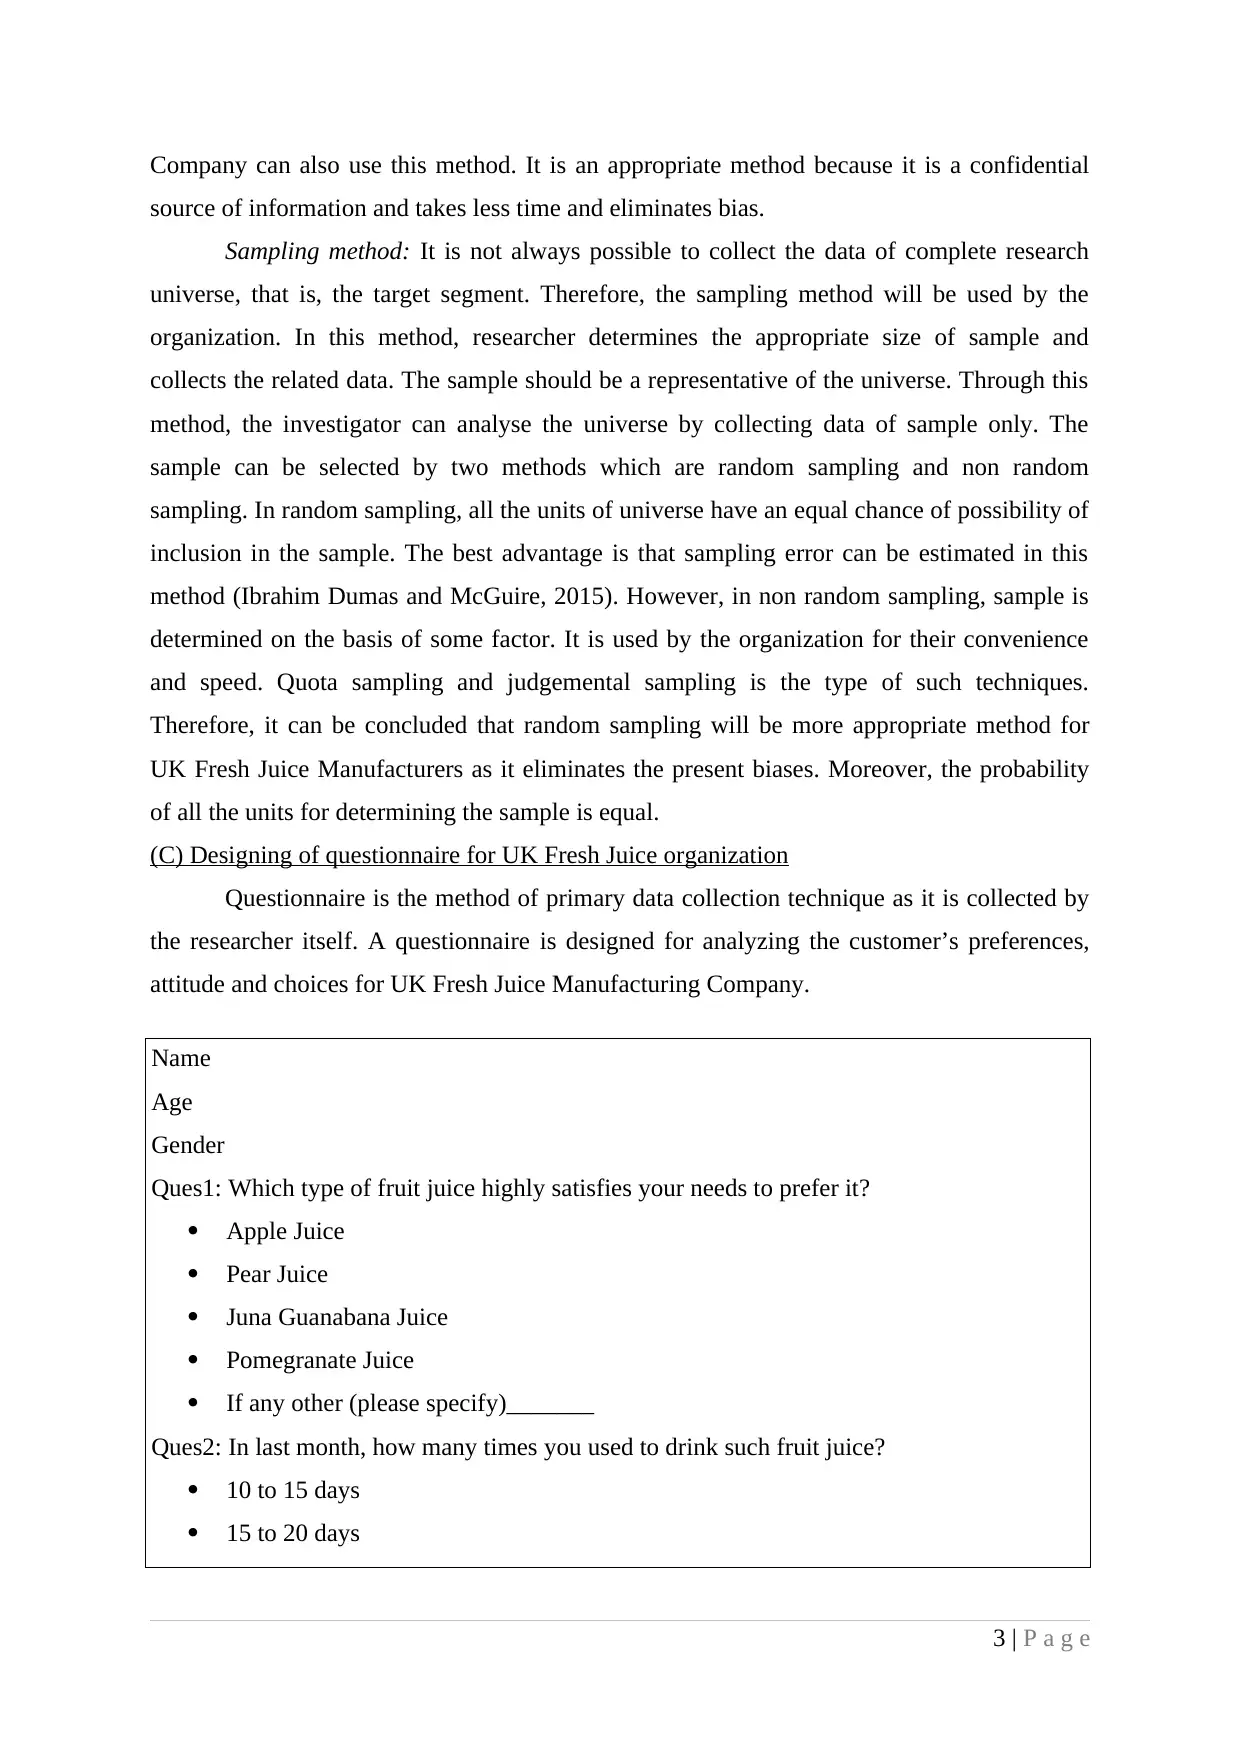
(C) Designing of questionnaire for UK Fresh Juice organization
Questionnaire is the method of primary data collection technique as it is collected by
the researcher itself. A questionnaire is designed for analyzing the customer’s preferences,
attitude and choices for UK Fresh Juice Manufacturing Company.
Name
Age
Gender
Ques1: Which type of fruit juice highly satisfies your needs to prefer it?
Apple Juice
Pear Juice
Juna Guanabana Juice
Pomegranate Juice
If any other (please specify)_______
Ques2: In last month, how many times you used to drink such fruit juice?
10 to 15 days
15 to 20 days
3 | P a g e
source of information and takes less time and eliminates bias.
Sampling method: It is not always possible to collect the data of complete research
universe, that is, the target segment. Therefore, the sampling method will be used by the
organization. In this method, researcher determines the appropriate size of sample and
collects the related data. The sample should be a representative of the universe. Through this
method, the investigator can analyse the universe by collecting data of sample only. The
sample can be selected by two methods which are random sampling and non random
sampling. In random sampling, all the units of universe have an equal chance of possibility of
inclusion in the sample. The best advantage is that sampling error can be estimated in this
method (Ibrahim Dumas and McGuire, 2015). However, in non random sampling, sample is
determined on the basis of some factor. It is used by the organization for their convenience
and speed. Quota sampling and judgemental sampling is the type of such techniques.
Therefore, it can be concluded that random sampling will be more appropriate method for
UK Fresh Juice Manufacturers as it eliminates the present biases. Moreover, the probability
of all the units for determining the sample is equal.
(C) Designing of questionnaire for UK Fresh Juice organization
Questionnaire is the method of primary data collection technique as it is collected by
the researcher itself. A questionnaire is designed for analyzing the customer’s preferences,
attitude and choices for UK Fresh Juice Manufacturing Company.
Name
Age
Gender
Ques1: Which type of fruit juice highly satisfies your needs to prefer it?
Apple Juice
Pear Juice
Juna Guanabana Juice
Pomegranate Juice
If any other (please specify)_______
Ques2: In last month, how many times you used to drink such fruit juice?
10 to 15 days
15 to 20 days
3 | P a g e
⊘ This is a preview!⊘
Do you want full access?
Subscribe today to unlock all pages.
Trusted by 1+ million students worldwide
Daily
Ques3: How much amount did you spend on your preferred juice brand?
Less than 150£
150£ to 200£
More than 200£
Ques4: From where do you purchase such fresh juice?
Specialized shops
Supermarket
Any other (Please specify)______
Ques5: Which factor has a great impact on your buying decisions?
Price
Place
Quality
Volume
Any other (Please specify)_________
Ques6: Do you satisfy that preferred fresh Juice is under your purchasing power?
Yes
No
Ques7: Do you satisfy with the quality produced by the juice manufacturer and fulfill your
nutrition requirement.
Yes
No
Ques8: Will you prefer such juice in the future period also?
Yes
No
Ques9: Do you want to bring any changes in your preferred fresh juice in terms of quality,
price and packaging?
Specify: _______________________________________________________
TASK 2
AC 2.1 Data analysis of collected primary and secondary data
Data analysis can be done by constructing frequency table and making charts from
gathered primary and secondary data. Frequency table summarize the collected data by
4 | P a g e
Paraphrase This Document
Need a fresh take? Get an instant paraphrase of this document with our AI Paraphraser
identifying the frequency for each item (Drucker, 2001). The frequency table for primary and
secondary data collected is explained below:
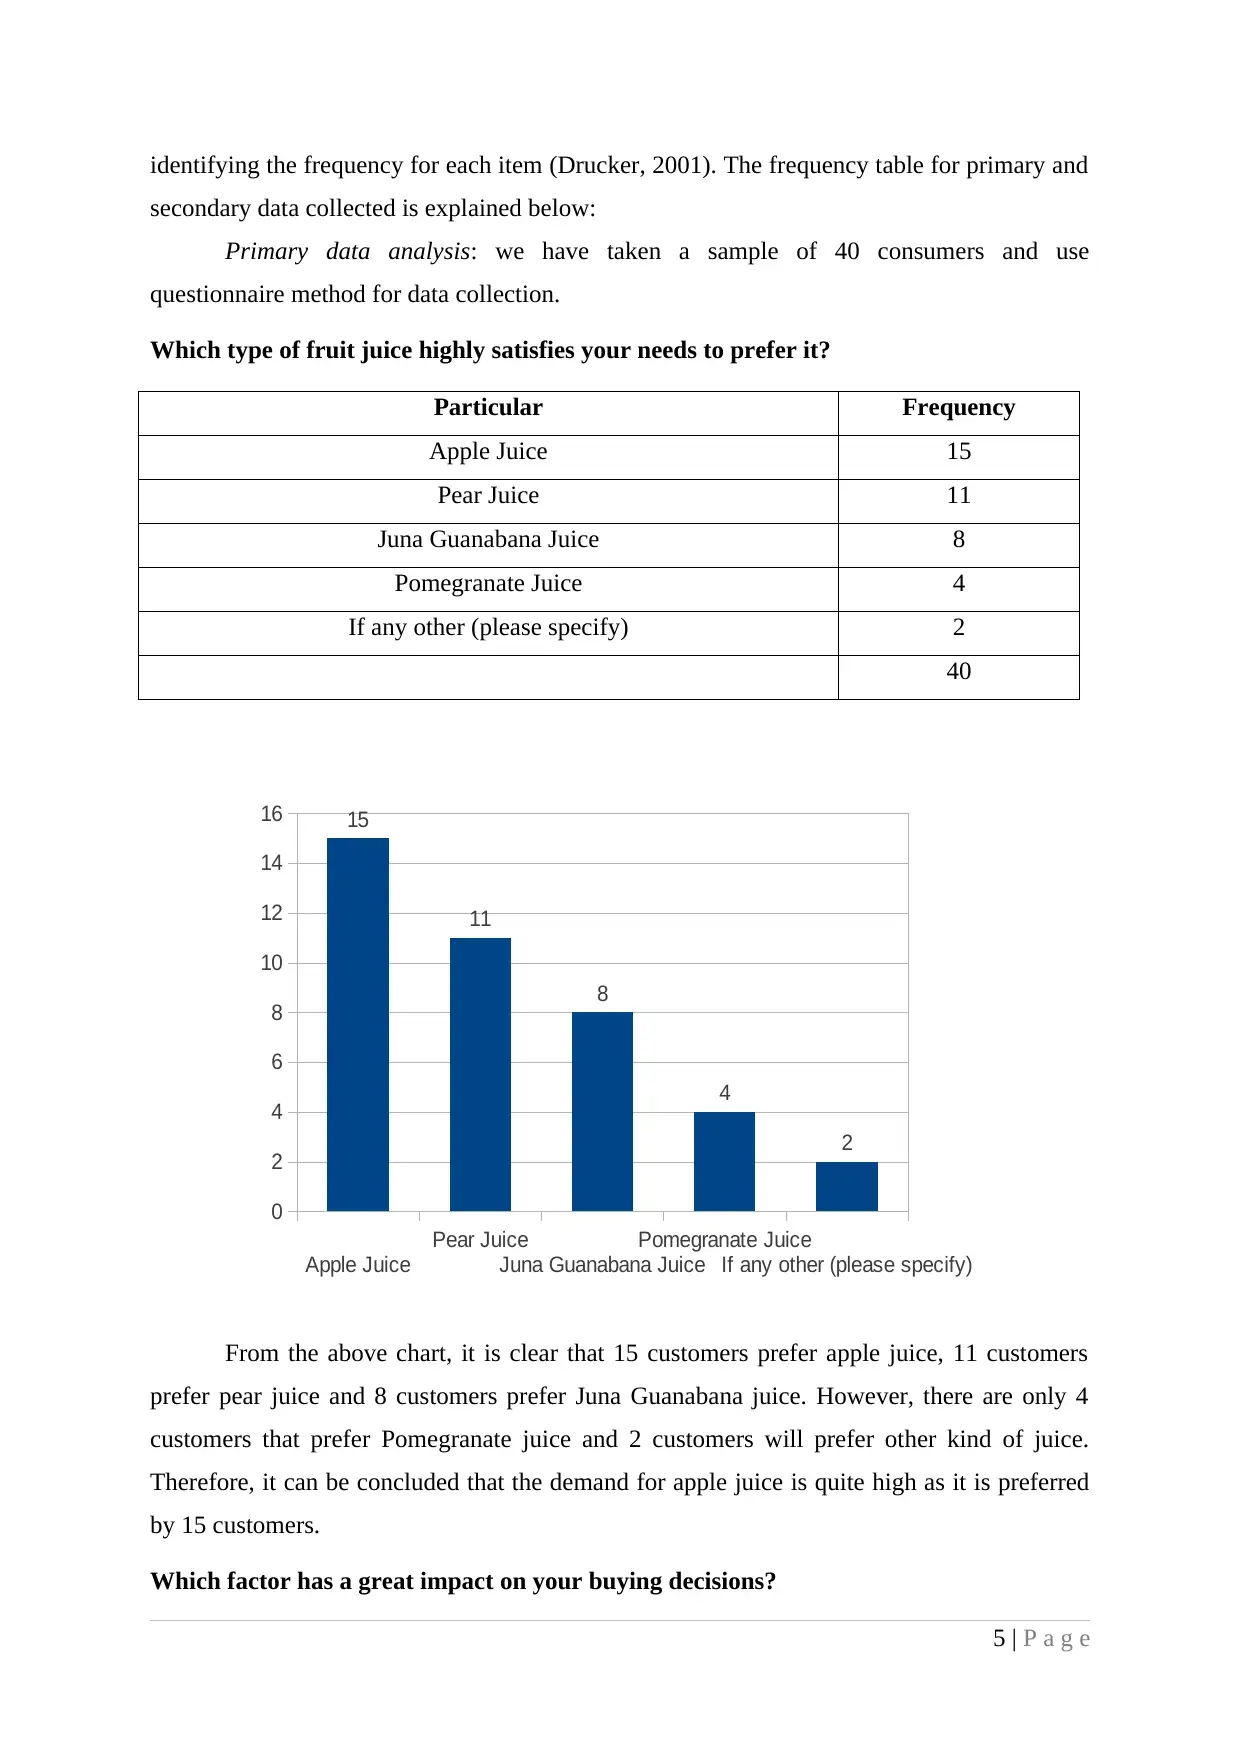
Primary data analysis: we have taken a sample of 40 consumers and use
questionnaire method for data collection.
Which type of fruit juice highly satisfies your needs to prefer it?
Particular Frequency
Apple Juice 15
Pear Juice 11
Juna Guanabana Juice 8
Pomegranate Juice 4
If any other (please specify) 2
40
From the above chart, it is clear that 15 customers prefer apple juice, 11 customers
prefer pear juice and 8 customers prefer Juna Guanabana juice. However, there are only 4
customers that prefer Pomegranate juice and 2 customers will prefer other kind of juice.
Therefore, it can be concluded that the demand for apple juice is quite high as it is preferred
by 15 customers.
Which factor has a great impact on your buying decisions?
5 | P a g e
Apple Juice
Pear Juice
Juna Guanabana Juice
Pomegranate Juice
If any other (please specify)
0
2
4
6
8
10
12
14
16 15
11
8
4
2
secondary data collected is explained below:
Primary data analysis: we have taken a sample of 40 consumers and use
questionnaire method for data collection.
Which type of fruit juice highly satisfies your needs to prefer it?
Particular Frequency
Apple Juice 15
Pear Juice 11
Juna Guanabana Juice 8
Pomegranate Juice 4
If any other (please specify) 2
40
From the above chart, it is clear that 15 customers prefer apple juice, 11 customers
prefer pear juice and 8 customers prefer Juna Guanabana juice. However, there are only 4
customers that prefer Pomegranate juice and 2 customers will prefer other kind of juice.
Therefore, it can be concluded that the demand for apple juice is quite high as it is preferred
by 15 customers.
Which factor has a great impact on your buying decisions?
5 | P a g e
Apple Juice
Pear Juice
Juna Guanabana Juice
Pomegranate Juice
If any other (please specify)
0
2
4
6
8
10
12
14
16 15
11
8
4
2
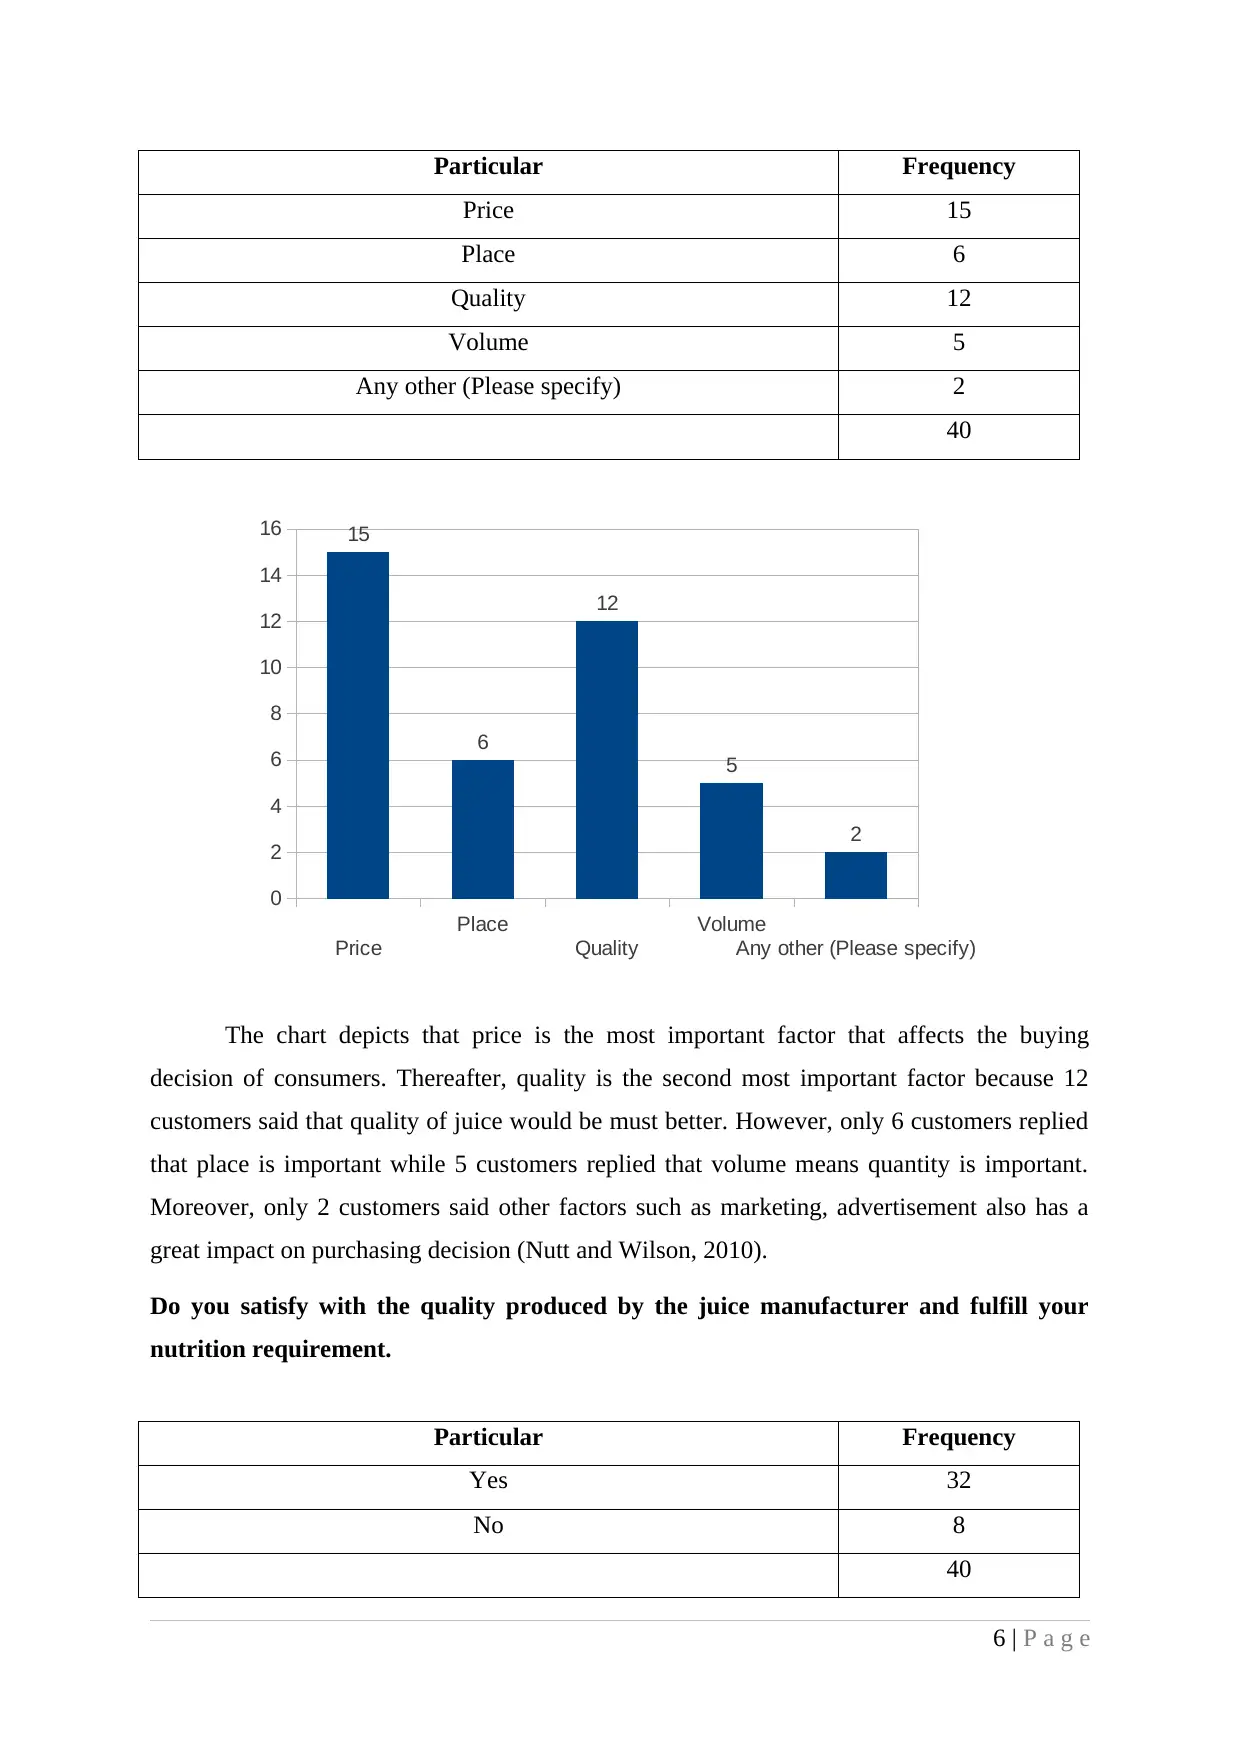
Particular Frequency
Price 15
Place 6
Quality 12
Volume 5
Any other (Please specify) 2
40
The chart depicts that price is the most important factor that affects the buying
decision of consumers. Thereafter, quality is the second most important factor because 12
customers said that quality of juice would be must better. However, only 6 customers replied
that place is important while 5 customers replied that volume means quantity is important.
Moreover, only 2 customers said other factors such as marketing, advertisement also has a
great impact on purchasing decision (Nutt and Wilson, 2010).
Do you satisfy with the quality produced by the juice manufacturer and fulfill your
nutrition requirement.
Particular Frequency
Yes 32
No 8
40
6 | P a g e
Price
Place
Quality
Volume
Any other (Please specify)
0
2
4
6
8
10
12
14
16 15
6
12
5
2
⊘ This is a preview!⊘
Do you want full access?
Subscribe today to unlock all pages.
Trusted by 1+ million students worldwide
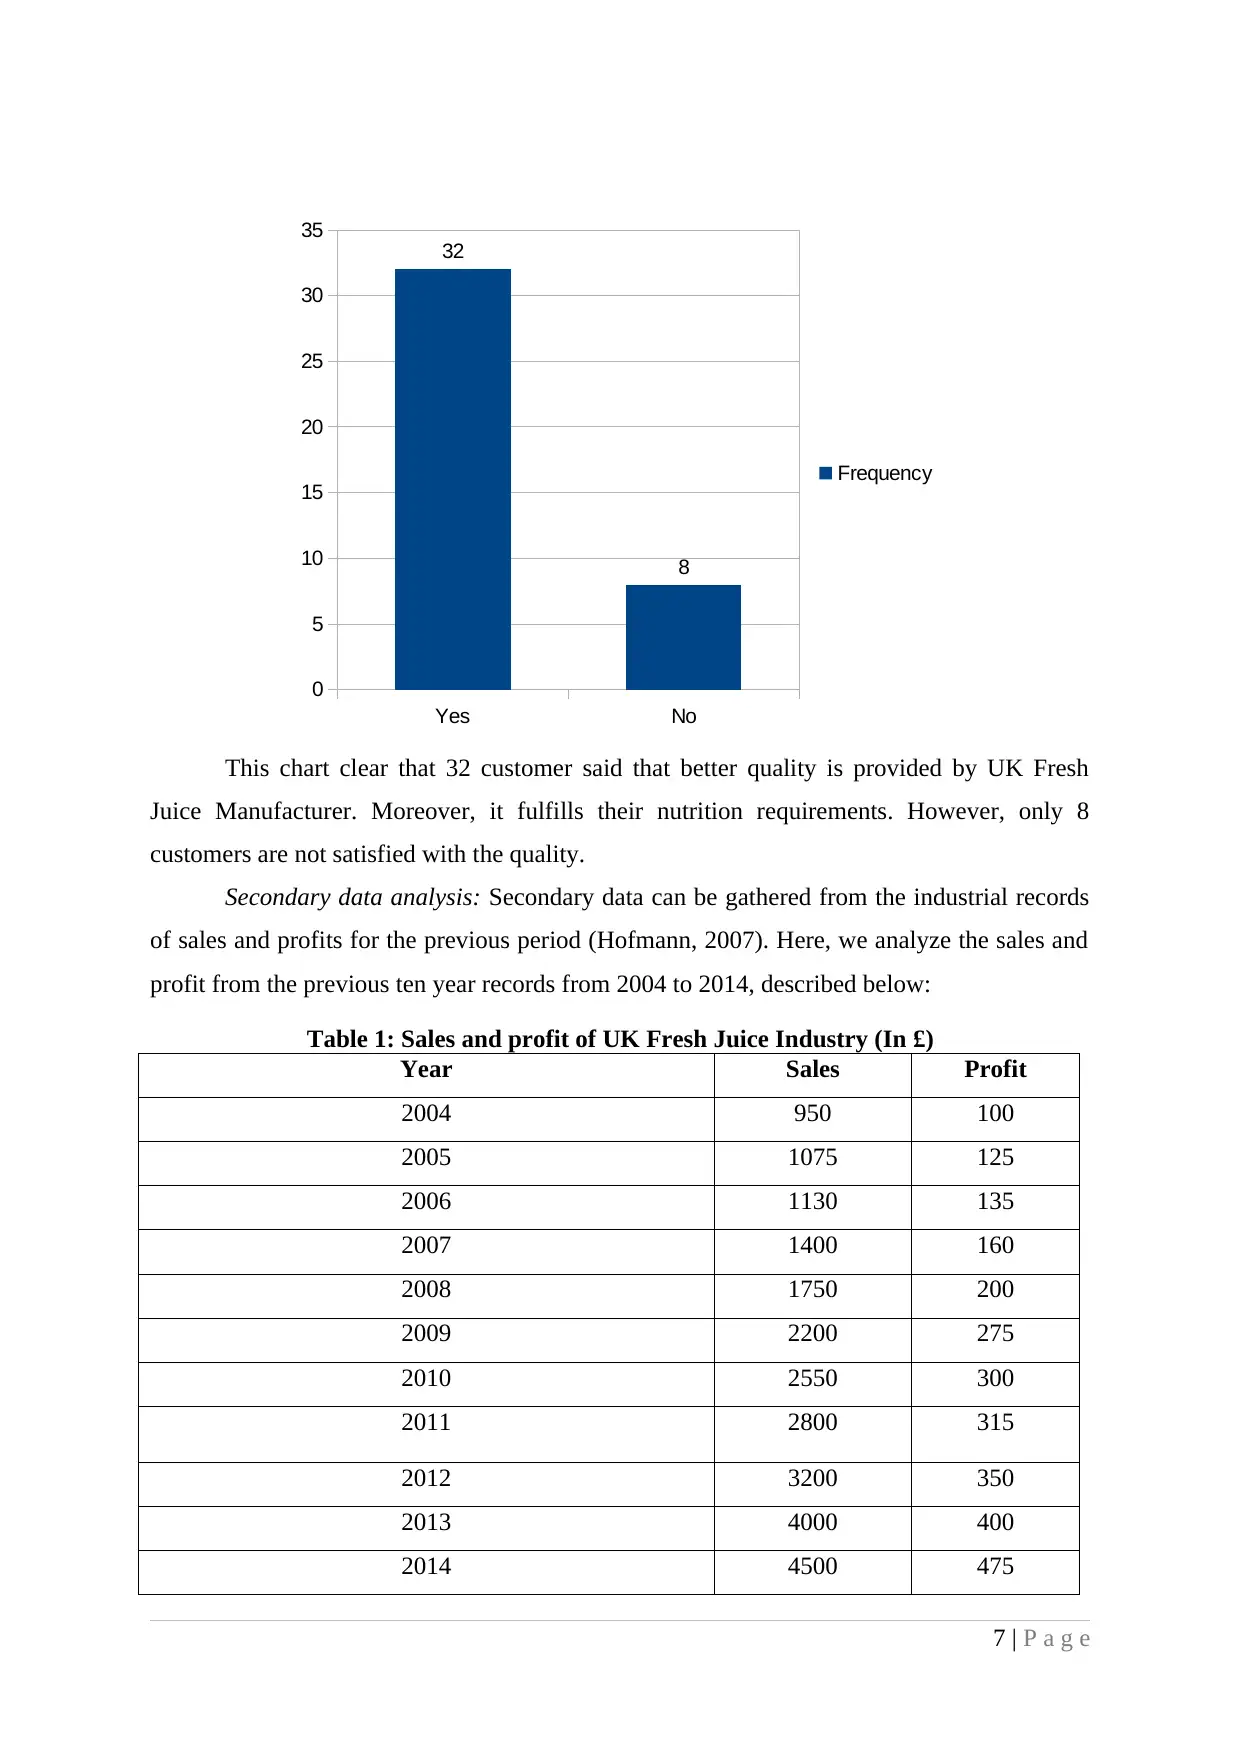
This chart clear that 32 customer said that better quality is provided by UK Fresh
Juice Manufacturer. Moreover, it fulfills their nutrition requirements. However, only 8
customers are not satisfied with the quality.
Secondary data analysis: Secondary data can be gathered from the industrial records
of sales and profits for the previous period (Hofmann, 2007). Here, we analyze the sales and
profit from the previous ten year records from 2004 to 2014, described below:
Table 1: Sales and profit of UK Fresh Juice Industry (In £)
Year Sales Profit
2004 950 100
2005 1075 125
2006 1130 135
2007 1400 160
2008 1750 200
2009 2200 275
2010 2550 300
2011 2800 315
2012 3200 350
2013 4000 400
2014 4500 475
7 | P a g e
Yes No
0
5
10
15
20
25
30
35
32
8
Frequency
Paraphrase This Document
Need a fresh take? Get an instant paraphrase of this document with our AI Paraphraser
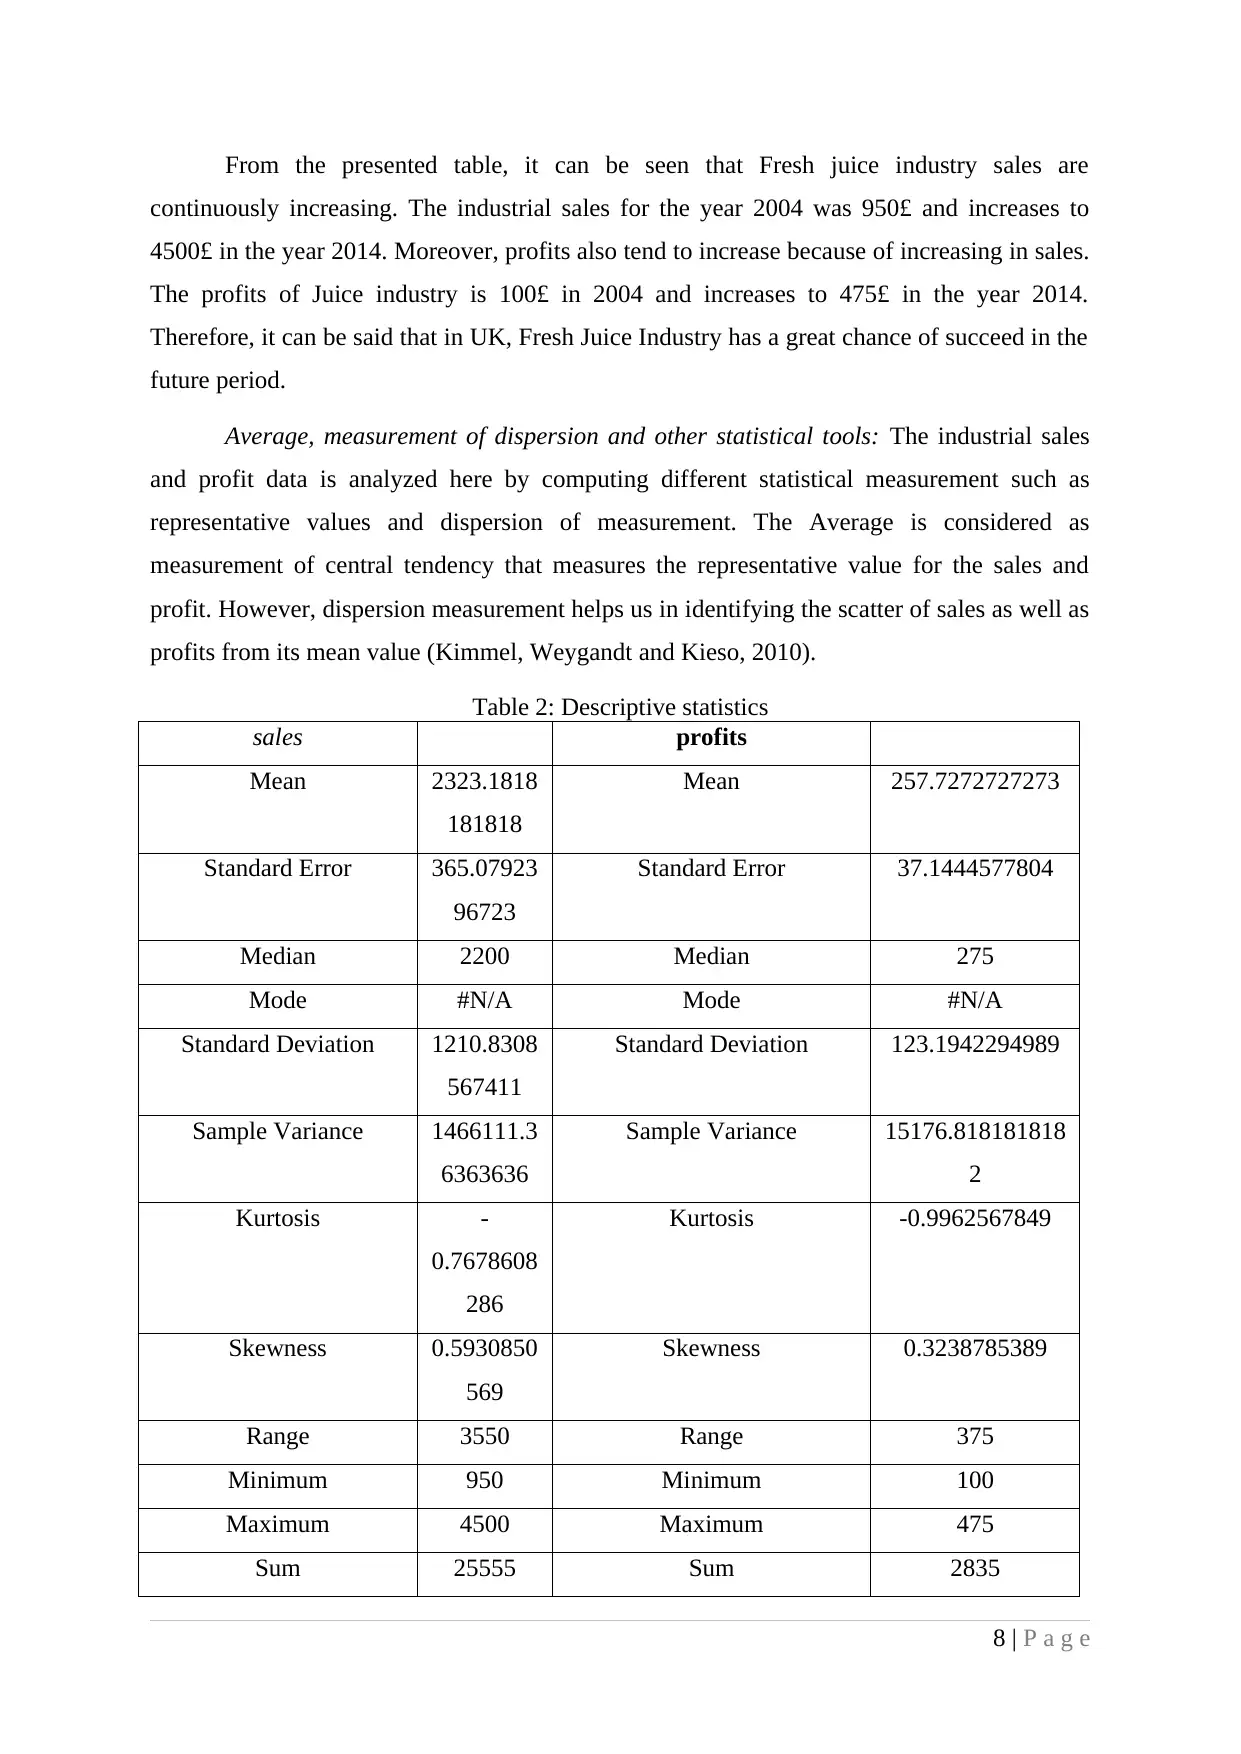
From the presented table, it can be seen that Fresh juice industry sales are
continuously increasing. The industrial sales for the year 2004 was 950£ and increases to
4500£ in the year 2014. Moreover, profits also tend to increase because of increasing in sales.
The profits of Juice industry is 100£ in 2004 and increases to 475£ in the year 2014.
Therefore, it can be said that in UK, Fresh Juice Industry has a great chance of succeed in the
future period.
Average, measurement of dispersion and other statistical tools: The industrial sales
and profit data is analyzed here by computing different statistical measurement such as
representative values and dispersion of measurement. The Average is considered as
measurement of central tendency that measures the representative value for the sales and
profit. However, dispersion measurement helps us in identifying the scatter of sales as well as
profits from its mean value (Kimmel, Weygandt and Kieso, 2010).
Table 2: Descriptive statistics
sales profits
Mean 2323.1818
181818
Mean 257.7272727273
Standard Error 365.07923
96723
Standard Error 37.1444577804
Median 2200 Median 275
Mode #N/A Mode #N/A
Standard Deviation 1210.8308
567411
Standard Deviation 123.1942294989
Sample Variance 1466111.3
6363636
Sample Variance 15176.818181818
2
Kurtosis -
0.7678608
286
Kurtosis -0.9962567849
Skewness 0.5930850
569
Skewness 0.3238785389
Range 3550 Range 375
Minimum 950 Minimum 100
Maximum 4500 Maximum 475
Sum 25555 Sum 2835
8 | P a g e
Count 11 Count 11
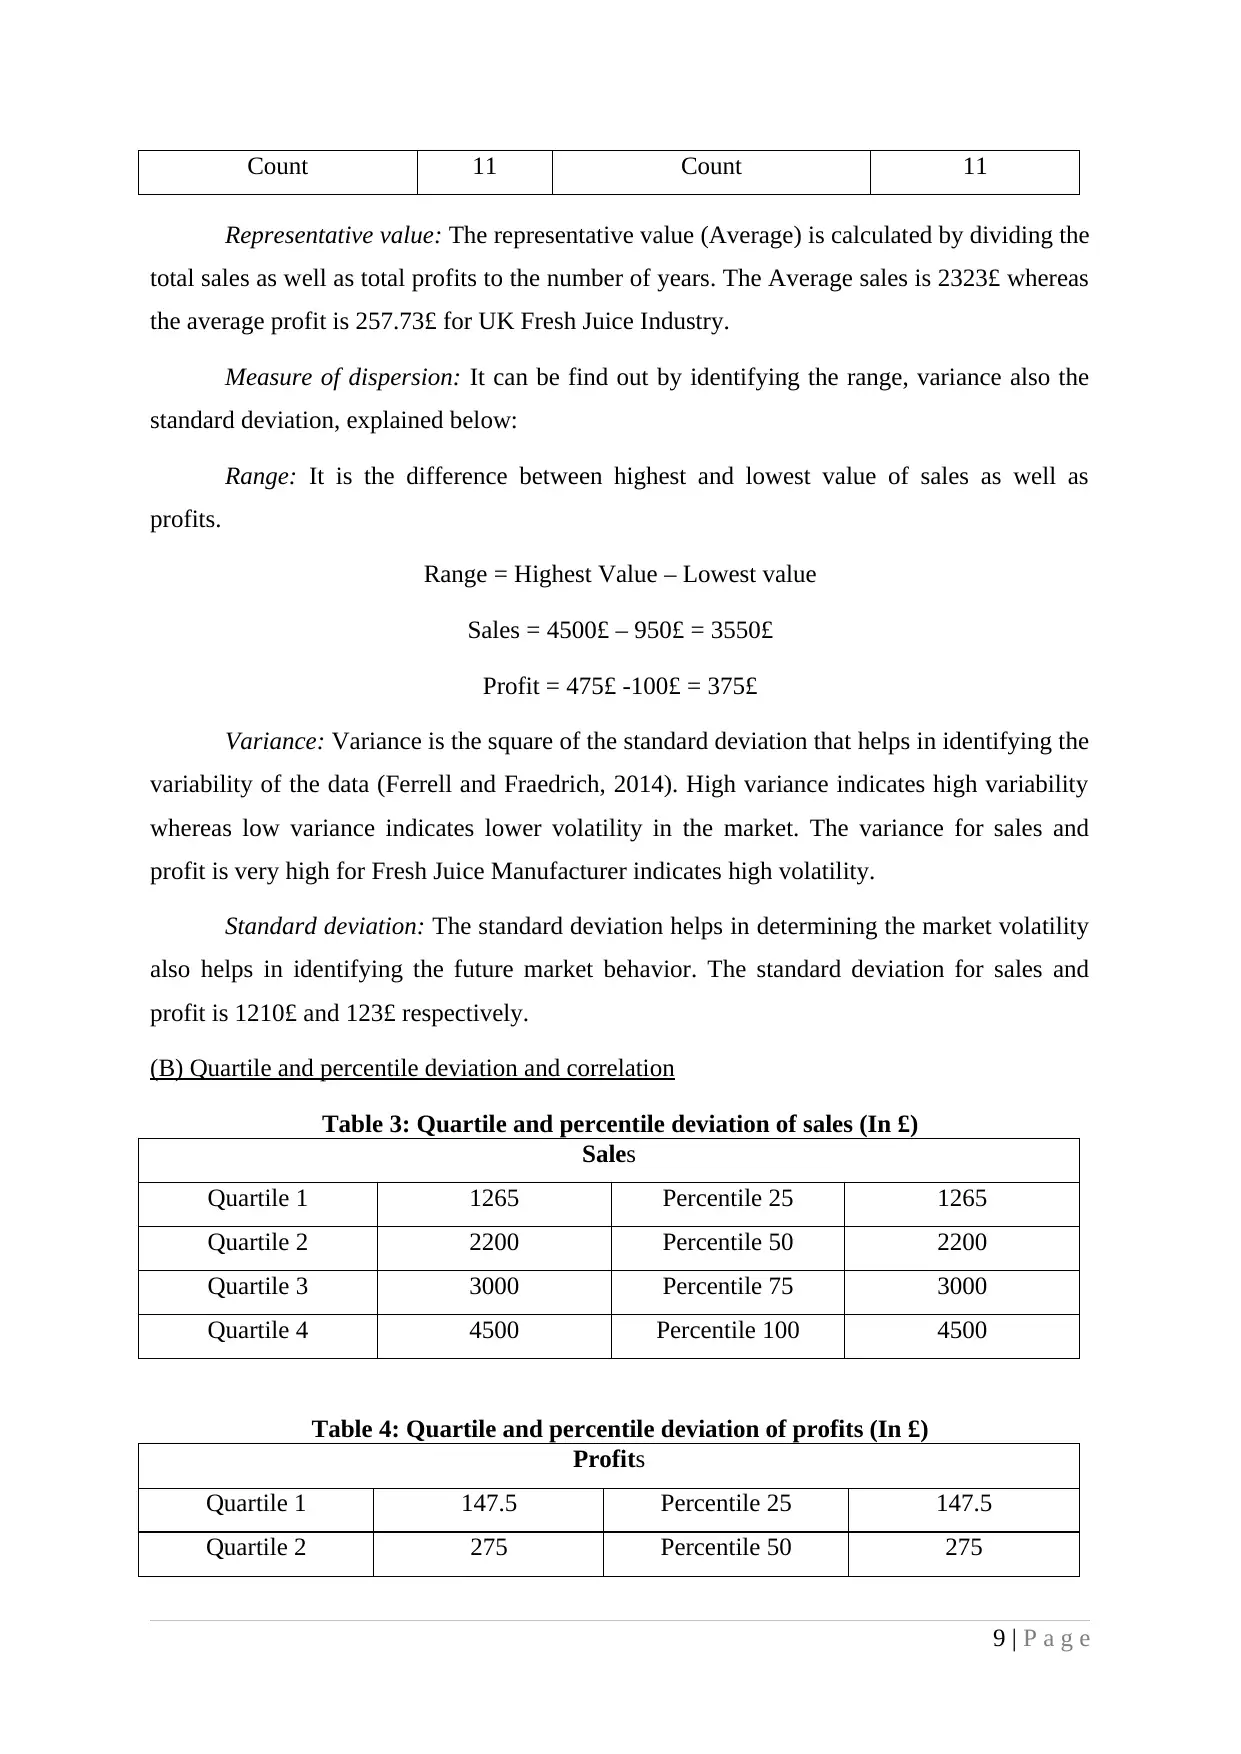
Representative value: The representative value (Average) is calculated by dividing the
total sales as well as total profits to the number of years. The Average sales is 2323£ whereas
the average profit is 257.73£ for UK Fresh Juice Industry.
Measure of dispersion: It can be find out by identifying the range, variance also the
standard deviation, explained below:
Range: It is the difference between highest and lowest value of sales as well as
profits.
Range = Highest Value – Lowest value
Sales = 4500£ – 950£ = 3550£
Profit = 475£ -100£ = 375£
Variance: Variance is the square of the standard deviation that helps in identifying the
variability of the data (Ferrell and Fraedrich, 2014). High variance indicates high variability
whereas low variance indicates lower volatility in the market. The variance for sales and
profit is very high for Fresh Juice Manufacturer indicates high volatility.
Standard deviation: The standard deviation helps in determining the market volatility
also helps in identifying the future market behavior. The standard deviation for sales and
profit is 1210£ and 123£ respectively.
(B) Quartile and percentile deviation and correlation
Table 3: Quartile and percentile deviation of sales (In £)
Sales
Quartile 1 1265 Percentile 25 1265
Quartile 2 2200 Percentile 50 2200
Quartile 3 3000 Percentile 75 3000
Quartile 4 4500 Percentile 100 4500
Table 4: Quartile and percentile deviation of profits (In £)
Profits
Quartile 1 147.5 Percentile 25 147.5
Quartile 2 275 Percentile 50 275
9 | P a g e
⊘ This is a preview!⊘
Do you want full access?
Subscribe today to unlock all pages.
Trusted by 1+ million students worldwide
1 out of 22
Related Documents


Your All-in-One AI-Powered Toolkit for Academic Success.
+13062052269
info@desklib.com
Available 24*7 on WhatsApp / Email
![[object Object]](/_next/static/media/star-bottom.7253800d.svg)
Unlock your academic potential
Copyright © 2020–2026 A2Z Services. All Rights Reserved. Developed and managed by ZUCOL.