GB513M1: Chart Analysis Report on Business Data and Solutions
VerifiedAdded on 2022/10/17
|7
|1111
|69
Homework Assignment
AI Summary
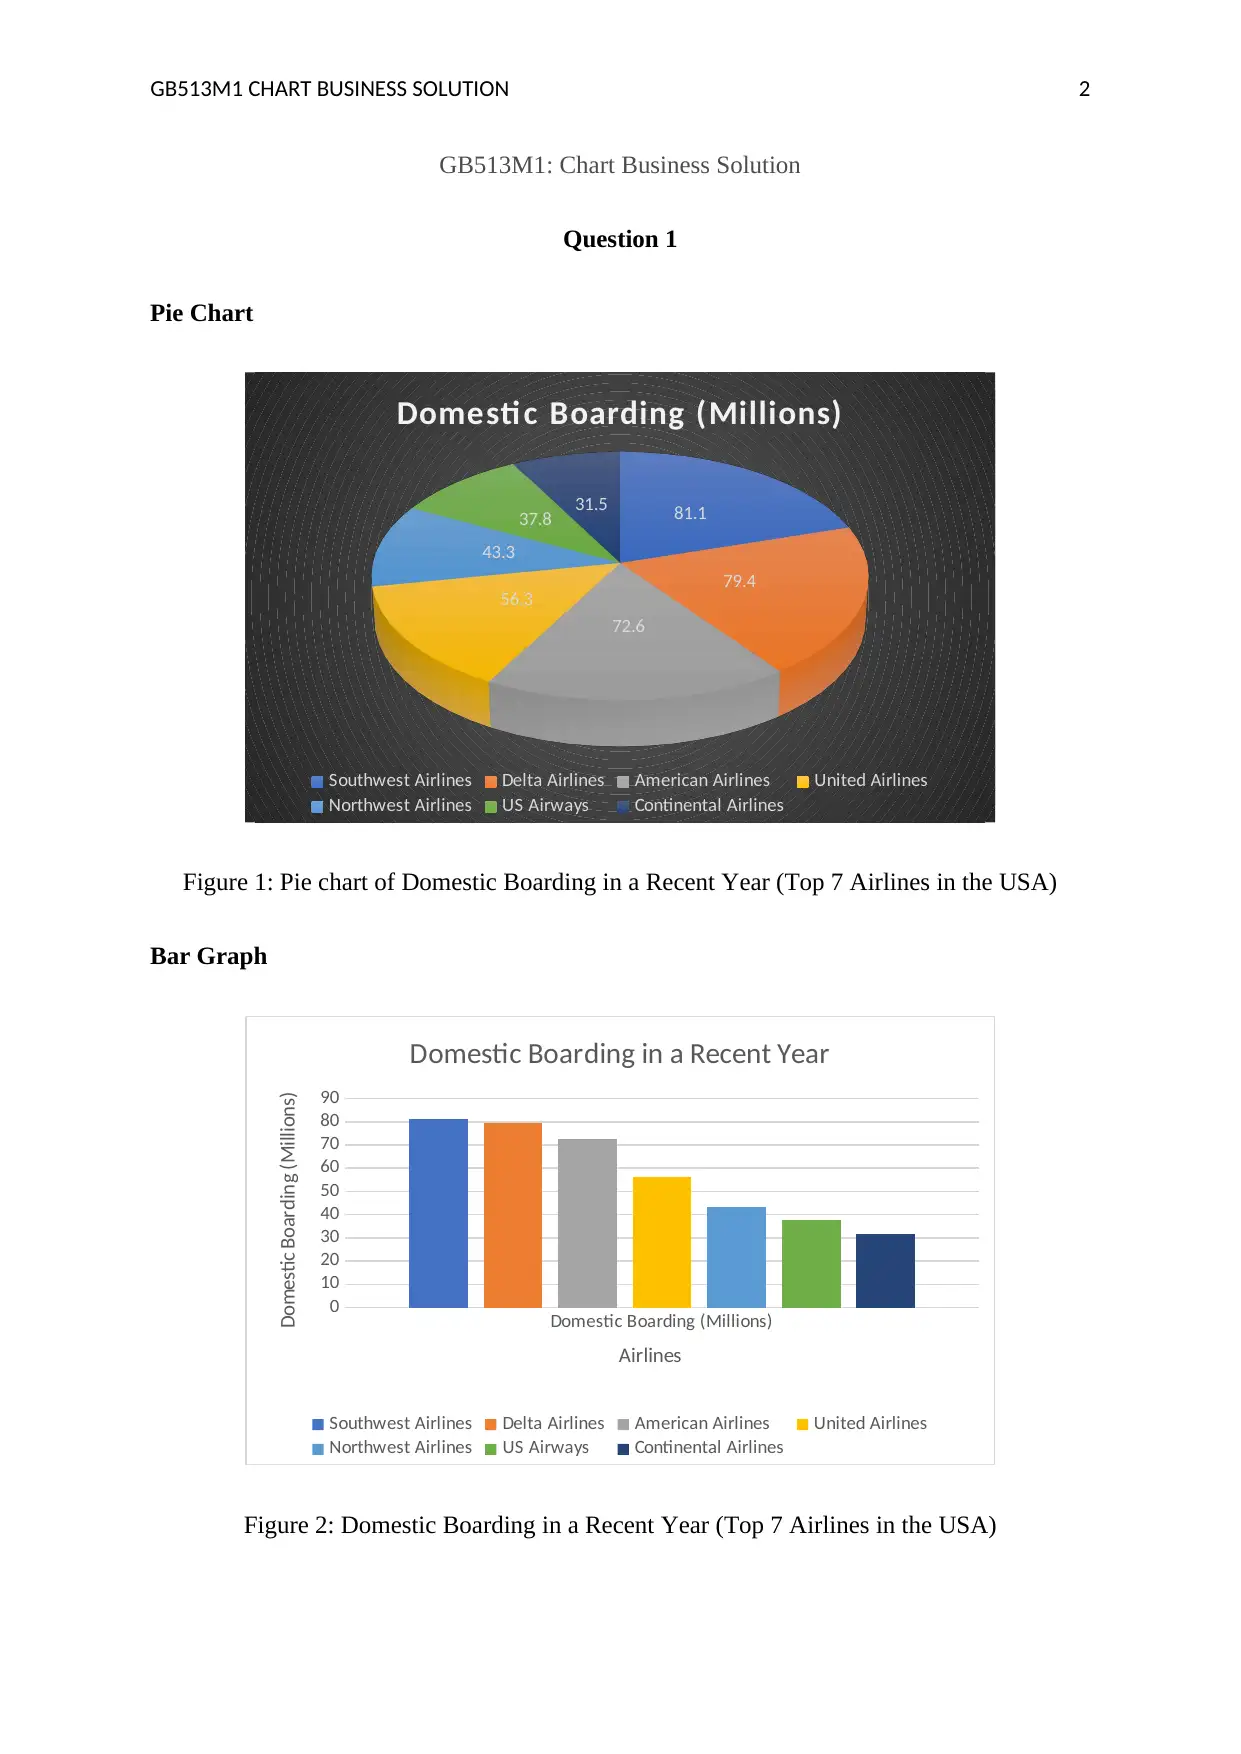
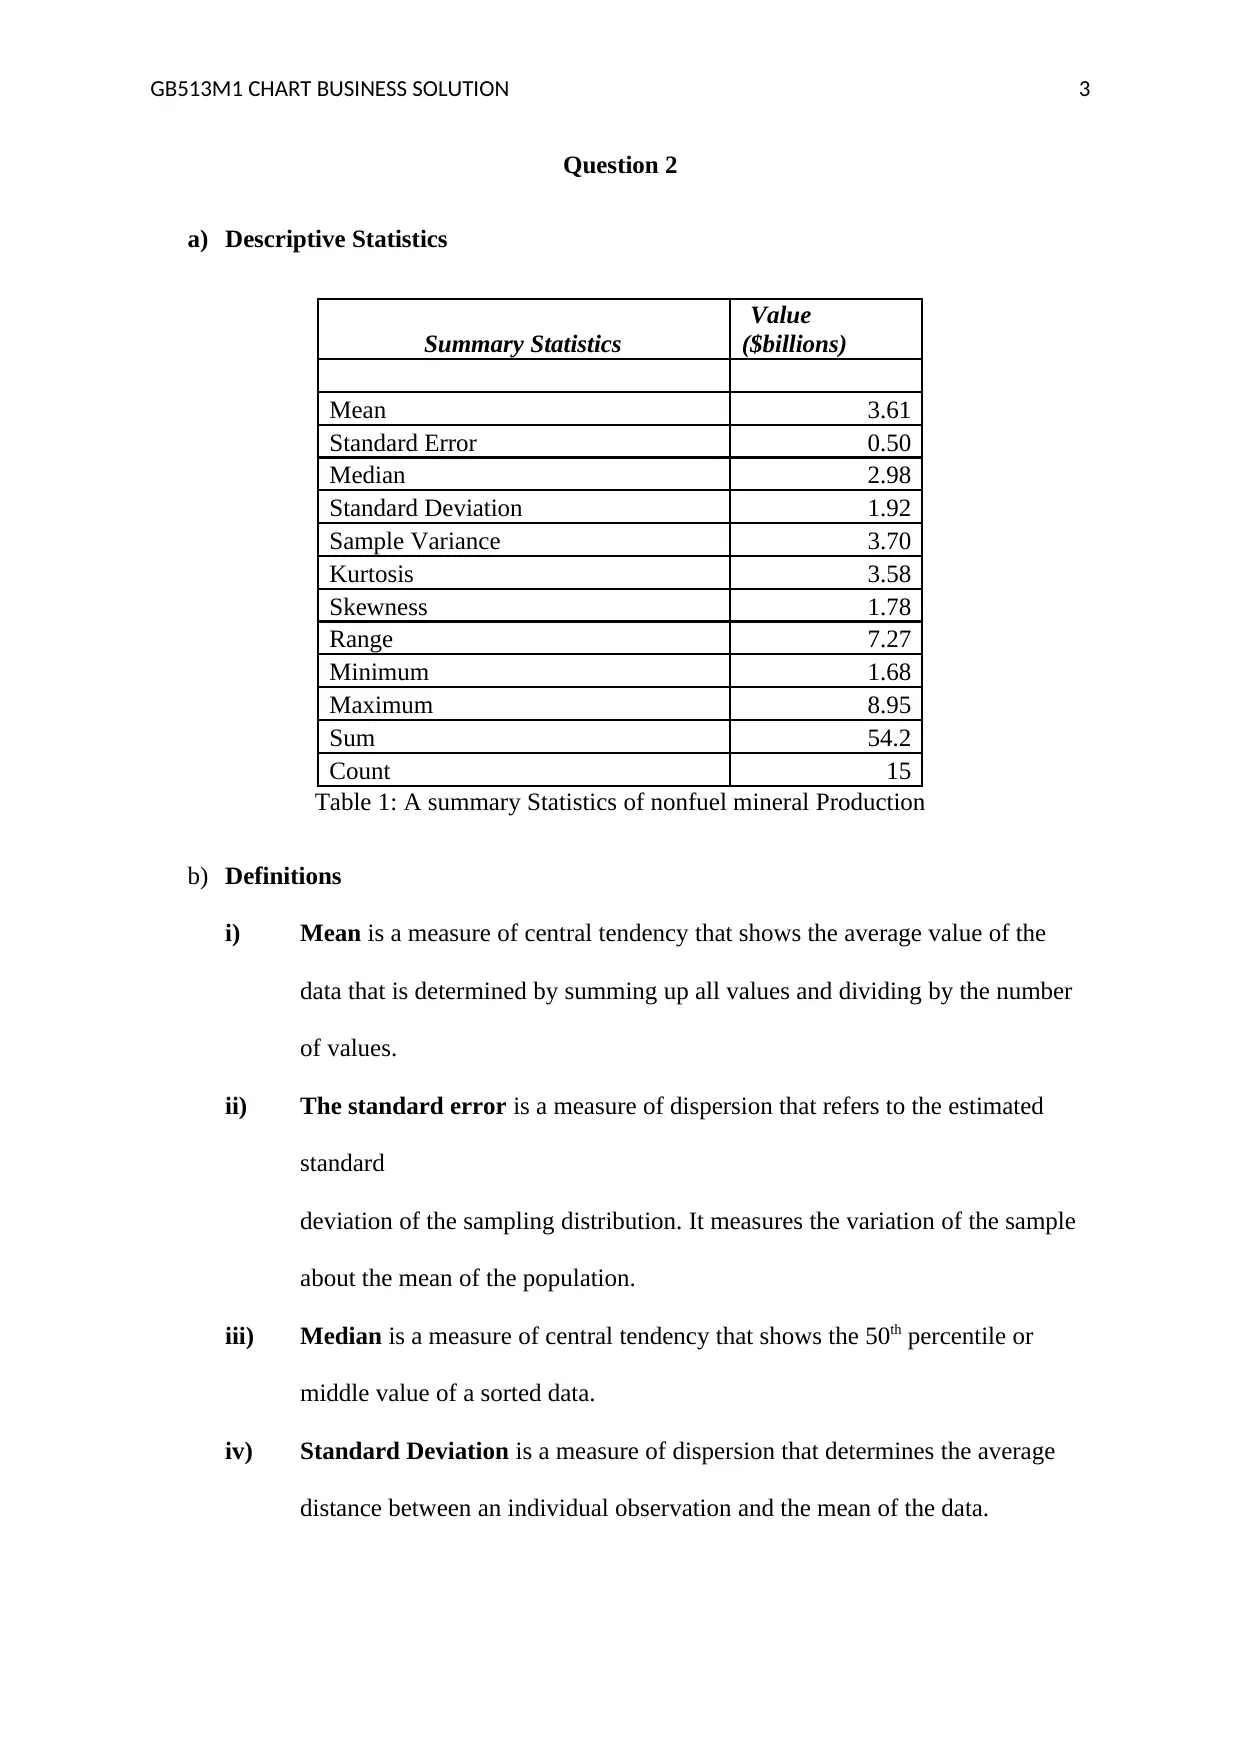
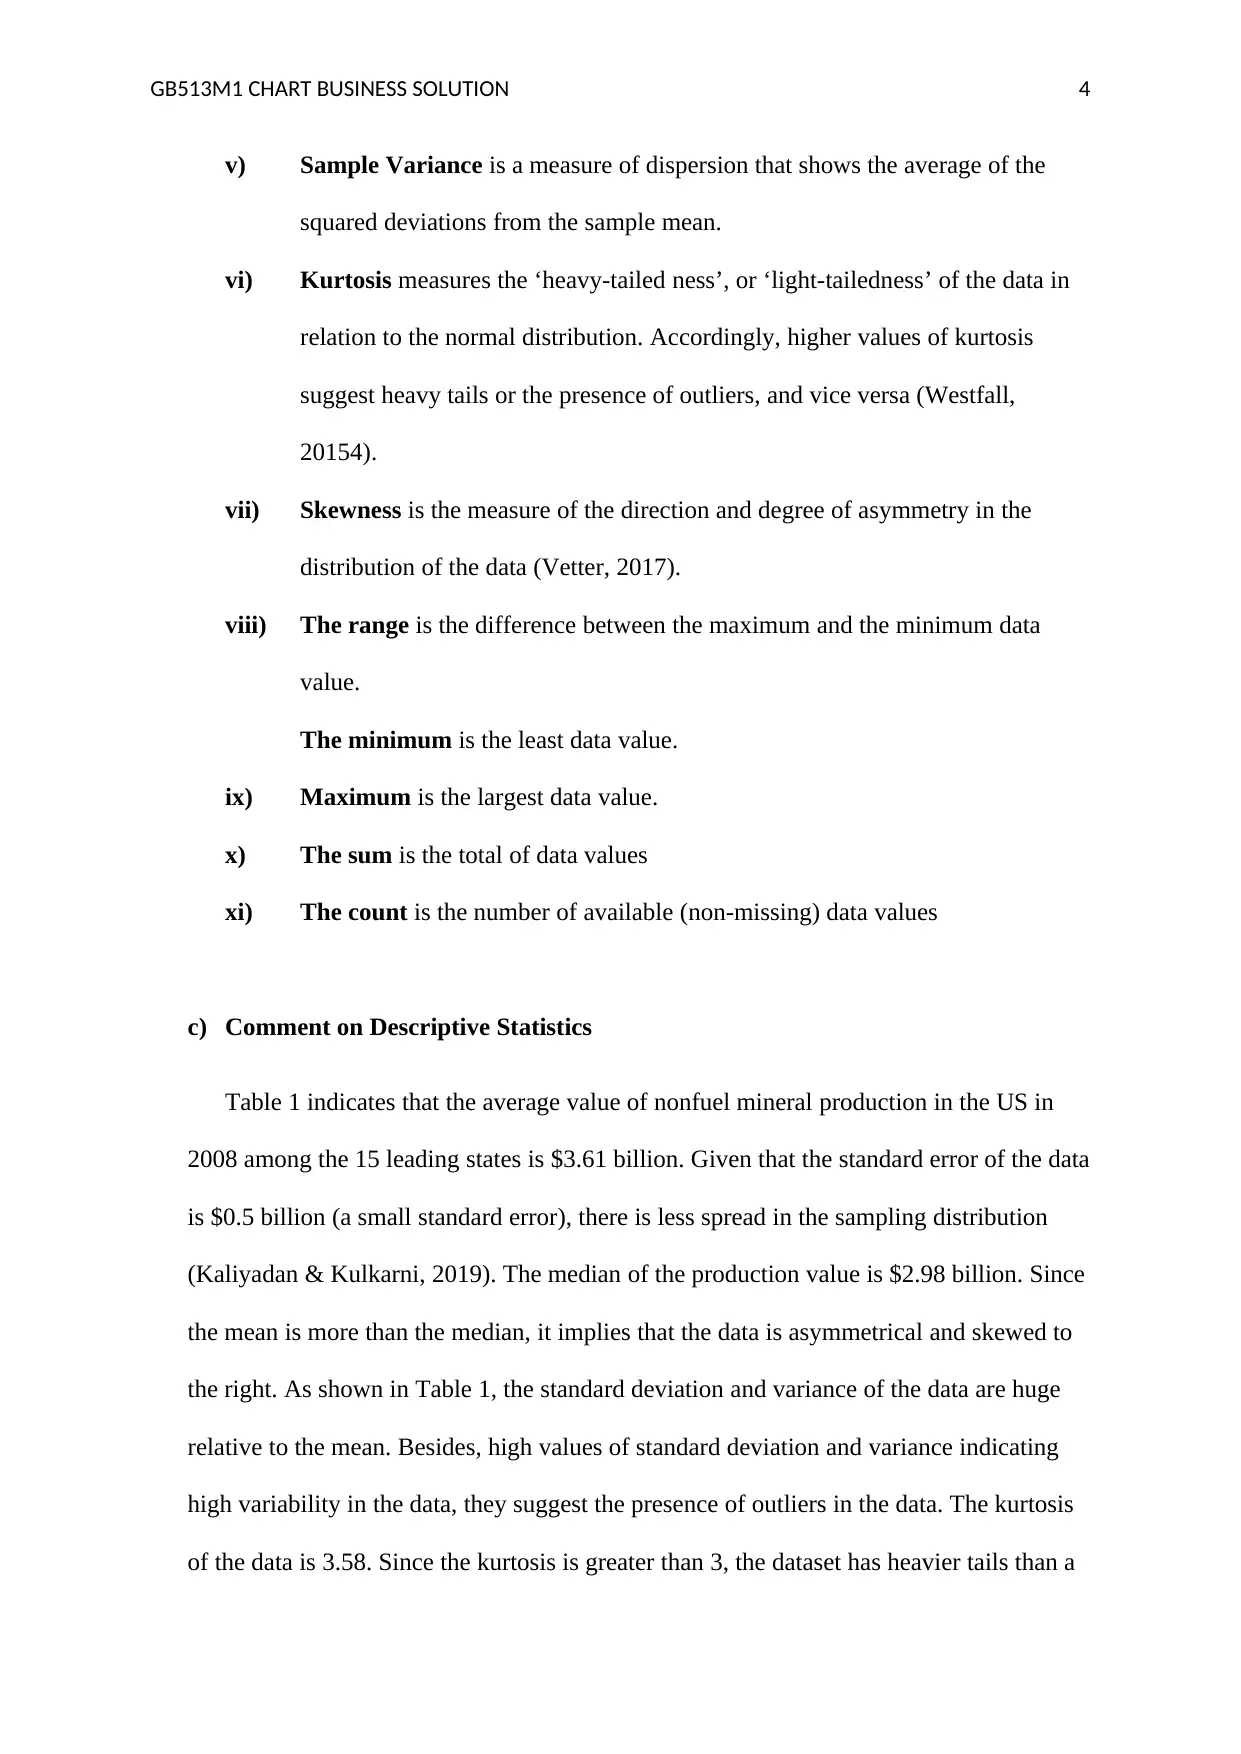
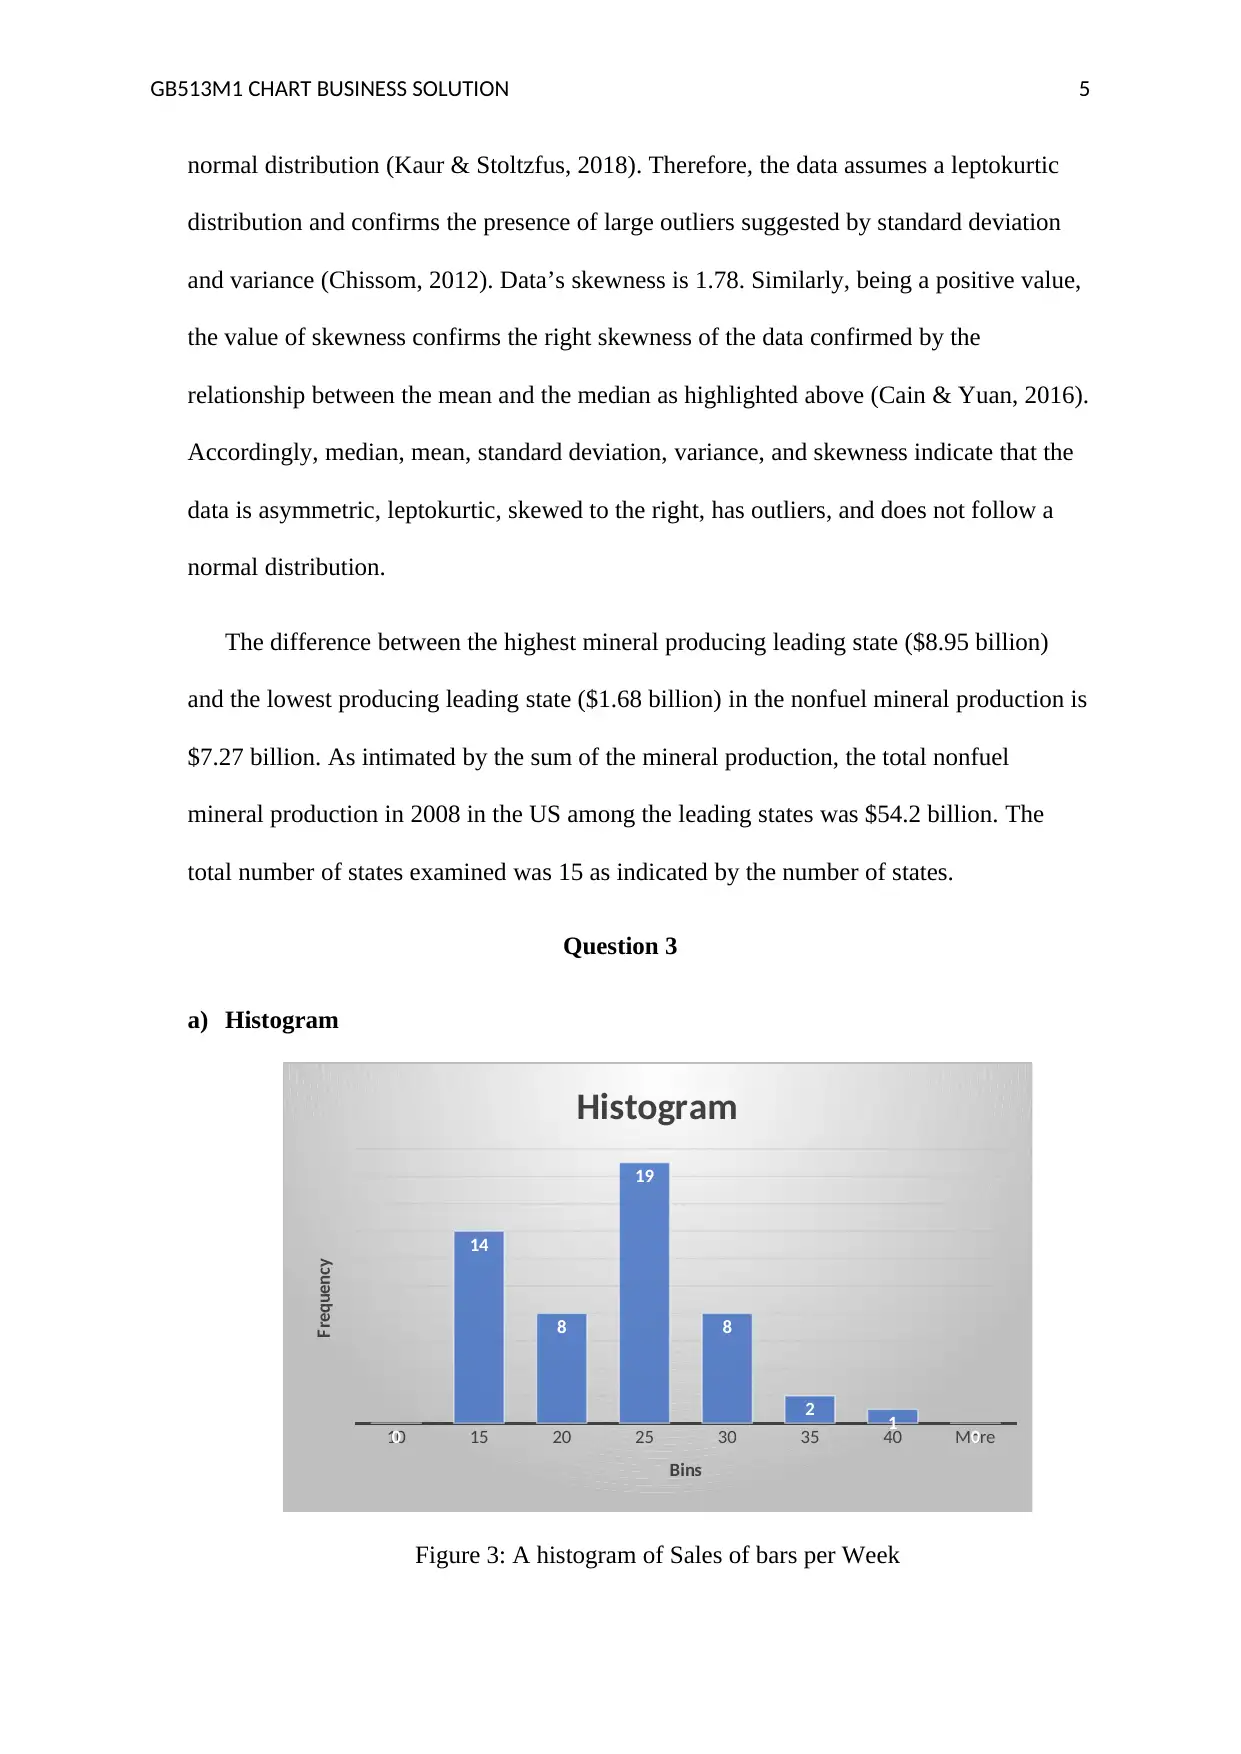
This document provides a comprehensive solution to the GB513M1 assignment, focusing on business chart analysis and data interpretation. The assignment includes the creation and analysis of a pie chart and bar graph illustrating domestic boarding data for top US airlines. It also involves the calculation and interpretation of descriptive statistics, including mean, standard error, median, standard deviation, variance, kurtosis, skewness, range, minimum, maximum, and sum, applied to nonfuel mineral production data. Furthermore, the solution presents a histogram analyzing bar soap sales, interpreting sales trends and volumes. The report emphasizes the importance of these visualizations in business decision-making, offering insights into sales patterns, data distribution, and potential outliers, all presented in a structured Word document format as required by the assignment brief.
1 out of 7
Related Documents


Your All-in-One AI-Powered Toolkit for Academic Success.
+13062052269
info@desklib.com
Available 24*7 on WhatsApp / Email
![[object Object]](/_next/static/media/star-bottom.7253800d.svg)
Copyright © 2020–2026 A2Z Services. All Rights Reserved. Developed and managed by ZUCOL.