Business Decision Making Report: Data Analysis and Conclusions
VerifiedAdded on 2020/06/04
|22
|4382
|164
Report
AI Summary
This report delves into the crucial aspects of business decision-making, employing a case study approach centered around a restaurant, 'Food for Friends.' The report begins with an exploration of data collection methods, distinguishing between primary and secondary sources, alongside an examination of survey methodologies and the construction of questionnaires. It then proceeds to the analysis and interpretation of collected data, utilizing representative values and measures of dispersion to draw meaningful conclusions. The report further incorporates the creation of graphs and trend lines for forecasting business information. Finally, it addresses the application of information processing and financial tools to enhance the decision-making process, providing a comprehensive overview of the key elements involved in making informed business choices. The report uses financial data and survey results to derive conclusions and recommendations for the case study.

Business decision making
Paraphrase This Document
Need a fresh take? Get an instant paraphrase of this document with our AI Paraphraser
Table of Contents
INTRODUCTION...........................................................................................................................1
TASK 1............................................................................................................................................1
1.1 Use of primary and secondary method of data collection.....................................................1
1.2 Survey methodology and sample framing.............................................................................2
1.3 Designing of questionnaire...................................................................................................3
TASK 2............................................................................................................................................5
2.1 Analysis of information for interpretation of data................................................................5
2.2 Evaluation of the results to draw important conclusion........................................................8
2.3 Evaluation of data using measures of dispersion..................................................................9
2.4 Use of quartiles, percentiles and correlation coefficient to draw important conclusions. . .10
TASK 3..........................................................................................................................................11
3.1 Creation of graphs based on the information derived.........................................................11
3.2 Creation of trend lines for forecasting business information..............................................15
3.3 Covered in PPT...................................................................................................................16
3.4 Formal business report........................................................................................................16
TASK 4..........................................................................................................................................17
4.1 use of information processing tools....................................................................................17
4.3 Use of financial tools for decision making.........................................................................18
REFERENCES..............................................................................................................................19
INTRODUCTION
Decision making is an important process which helps the managers and business
professionals to solve problems by analysing alternative choices and selection of the best route
which is beneficial for organisation. Business decision making is the primary function of
management which contributes in success of organisation in future. Research plays an important
role in improving the decision making power of managers. Survey methodologies help in the
collection of feedbacks from customers regarding their products and services. Food for Friends is
a restaurant which provides their services in the UK. Wide variety of food items are provided
like snacks, seafood, cheese, etc.
In the present report, primary and secondary methods of data collection, survey
methodologies and sample frame which is used to conduct research, preparation of questionnaire
and analysis of information to draw valid conclusion will be provided. Also, financial tools for
decision making and use of effective information processing tools will be discussed (Ariely and
Berns, 2010).
TASK 1
1.1 Use of primary and secondary method of data collection
Food for Friends is a restaurant which provides different kinds of food items in London
like snacks, seafood, cheese, etc. The main aim of restaurant is to open a new branch of their
restaurant in London. For this purpose, management has decided to research about the market
and customers to see that whether their move is viable or not in the future. Primary and
secondary method of data collection are those two methods which help in the collection of views
from customers. Both these methods are used by management of Food for Friends restaurant to
gain the views of customers regarding their move to open a new restaurant, quality of their food
items, price, preferences and tastes of customers, etc. This helps in taking effective decisions
regarding their investment in the future project.
Primary source: This is the most reliable source of data collection which provides
accurate views of respondents regarding different questions of management. There are many
methods which are included in primary source like survey, online, questionnaire, phone, etc.
Data collected from this source is the most reliable and accurate and helps management of Food
1
⊘ This is a preview!⊘
Do you want full access?
Subscribe today to unlock all pages.
Trusted by 1+ million students worldwide
for Friends regarding taking important decisions for the expansion of new restaurant in London.
Different uses of these methods are defined as below:
Survey: This includes getting the response of respondents regarding different questions.
This method helps in knowing the actual views of respondents in detail as it involves face
to face interaction of researcher with customers.
Questionnaire: This method includes preparation of research questions regarding their
problems. It provides opportunities in ascertaining feedbacks.
Online: This is the best time efficient method which helps in collection of information in
an appropriate manner.
Secondary source: This is another method of data collection which helps in saving the
time and cost of management of Food for Friends. This includes collection of information from
articles and magazines. This information is not very much accurate in comparison to primary
data (Casadesus-Masanell and Ricart, 2011).
1.2 Survey methodology and sample framing
Main aim behind the survey of market by Food for Friends is collection of information
regarding their existing services, preferences of customers, price and quality of their food items,
etc. This helps in determination of the important data which can be used to draw important
conclusion regarding opening of a new branch in London. This will enhance the decision making
power of management which contributes in solving problems, providence of guidance to their
staff members and provide important solutions. This helps in accomplishment of their objectives.
Survey methodologies: This includes about research of market to determine views of
customers regarding their services, food, price, ambience, expansion plans, etc. Two types of
methods are present in the collection of data which are primary and secondary. Food for Friends
decided to select primary method for determination of views of respondents regarding their
different questions because it helps in collection of reliable and accurate information. For this
purpose, Questionnaire is prepared which includes questions and problems for attaining the
views of customers.
Sample framework: This includes various methods of samples which help in collection
of information. These different methods which are available are cluster, random, stratified
sampling, etc. Random sampling method is used by the management of Food for friends for
selection of respondents from total population. This is the time efficient method which provides
2
Paraphrase This Document
Need a fresh take? Get an instant paraphrase of this document with our AI Paraphraser
opportunity regarding research of market in less period of time. Random sampling method is
effective because it helps in the selection of sample without any biasness. For the purpose of
conducting research, researcher of Food for Friends has selected 80 respondents from total
population (Chang, Van Witteloostuijn and Eden, 2010). The questions regarding which research
is conducted by management of restaurant are mentioned as below:
Price
Quality of food items
Viability of expansion plans
1.3 Designing of questionnaire
QUESTIONNAIRE
Name:
Age:
Gender:
Q1. Did you ever visit Food for Friends?
Yes
No
Q2. Do you think it is beneficial for Food for Friends to open a new branch in London?
Highly beneficial
Good
Moderate
Q3. What you like the most in Food for Friends?
Services
Variety of foods
Atmosphere
Q4. Do you think it is the right time for expansion of restaurant business in London?
Agree
Disagree
3
Q5. Are you satisfied with the pricing policy of Food for friends regarding their services and
food products?
Highly satisfied
Satisfied
Dissatisfied
Q6. What kind of food is the best in Food for Friends?
Seafood
Cheese
Snacks
Italian
Q7. At what location you want to start new branch of Food for Friends?
In city
Countryside
Q8. Are you satisfied with the quality of food items?
Highly satisfied
Satisfied
Dissatisfied
Q9. In what function you want change for Food for Friends?
Food products
Interior
Services
Ambience
Q10. What you recommend to Food for Friends regarding their expansion plan?
TASK 2
2.1 Analysis of information for interpretation of data
Q1. Did you ever visit Food for Friends?
4
⊘ This is a preview!⊘
Do you want full access?
Subscribe today to unlock all pages.
Trusted by 1+ million students worldwide
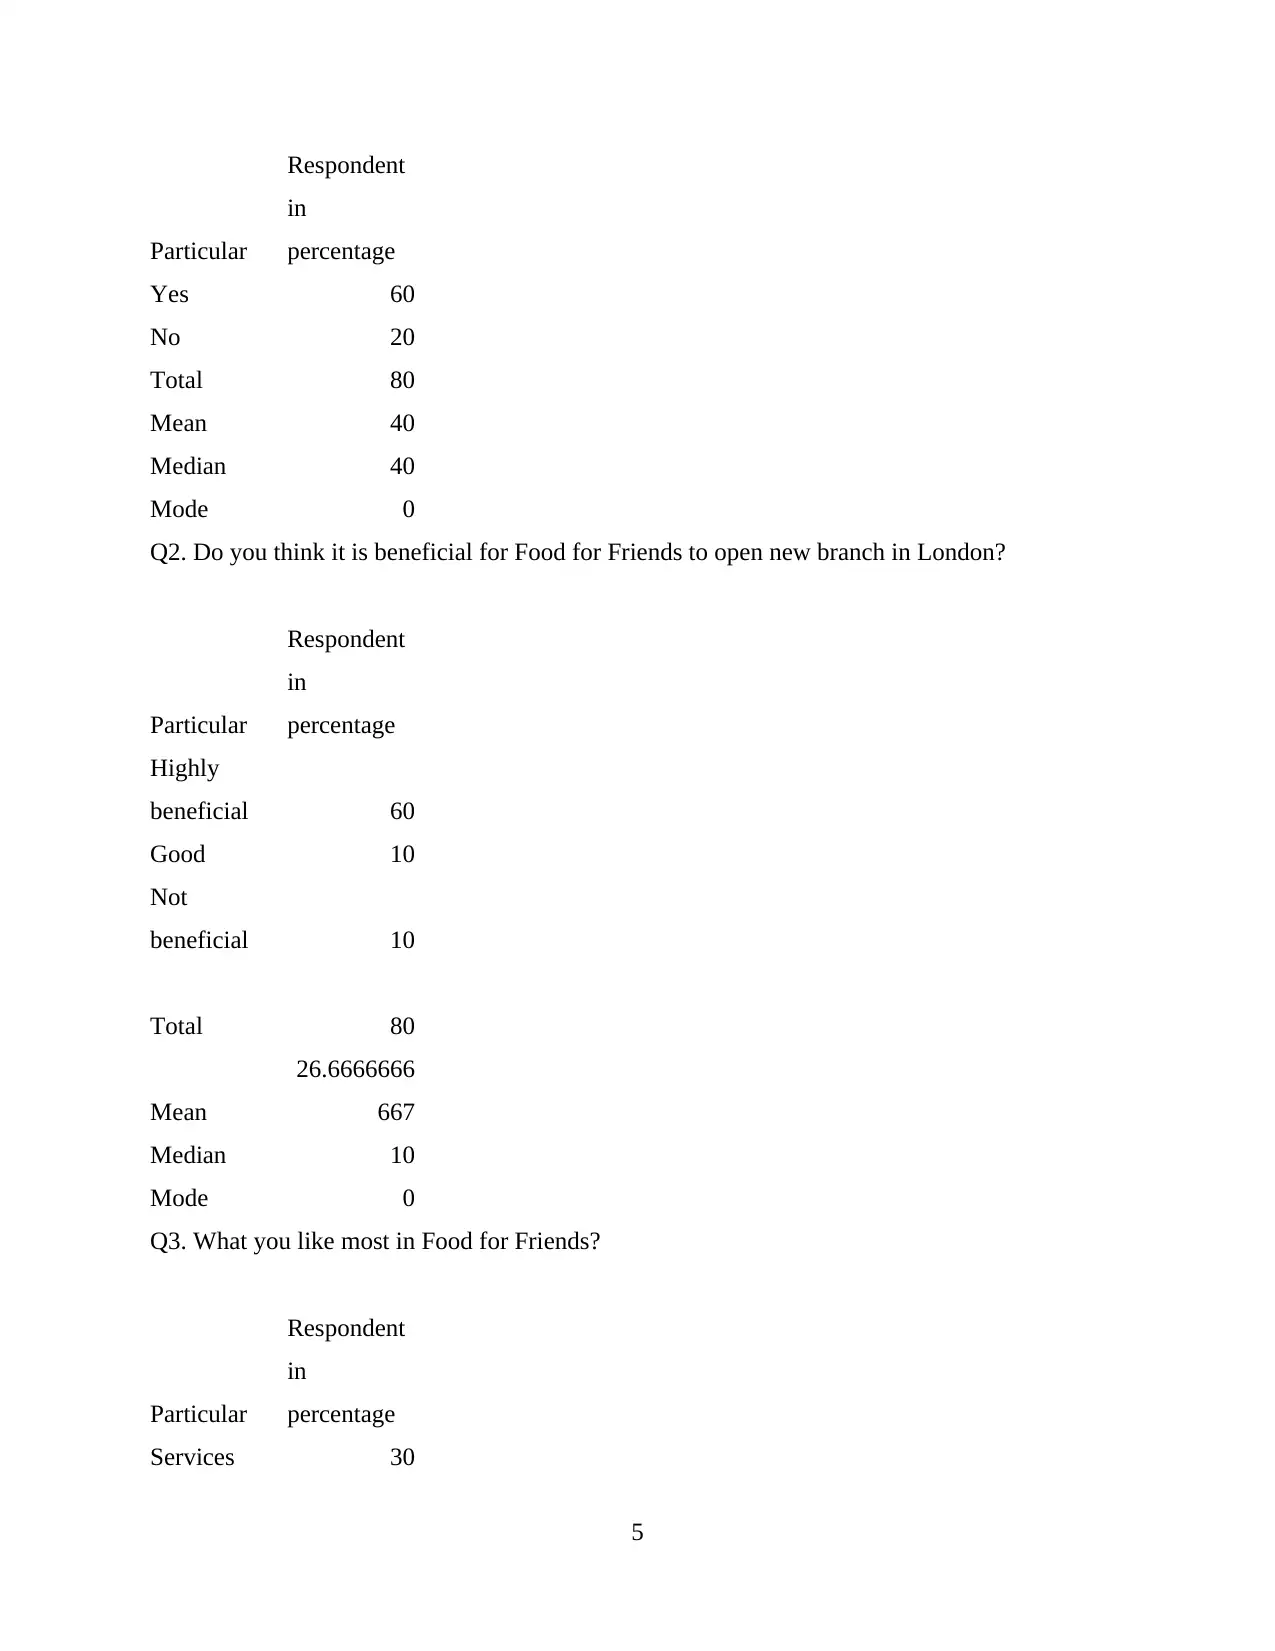
Particular
Respondent
in
percentage
Yes 60
No 20
Total 80
Mean 40
Median 40
Mode 0
Q2. Do you think it is beneficial for Food for Friends to open new branch in London?
Particular
Respondent
in
percentage
Highly
beneficial 60
Good 10
Not
beneficial 10
Total 80
Mean
26.6666666
667
Median 10
Mode 0
Q3. What you like most in Food for Friends?
Particular
Respondent
in
percentage
Services 30
5
Respondent
in
percentage
Yes 60
No 20
Total 80
Mean 40
Median 40
Mode 0
Q2. Do you think it is beneficial for Food for Friends to open new branch in London?
Particular
Respondent
in
percentage
Highly
beneficial 60
Good 10
Not
beneficial 10
Total 80
Mean
26.6666666
667
Median 10
Mode 0
Q3. What you like most in Food for Friends?
Particular
Respondent
in
percentage
Services 30
5
Paraphrase This Document
Need a fresh take? Get an instant paraphrase of this document with our AI Paraphraser
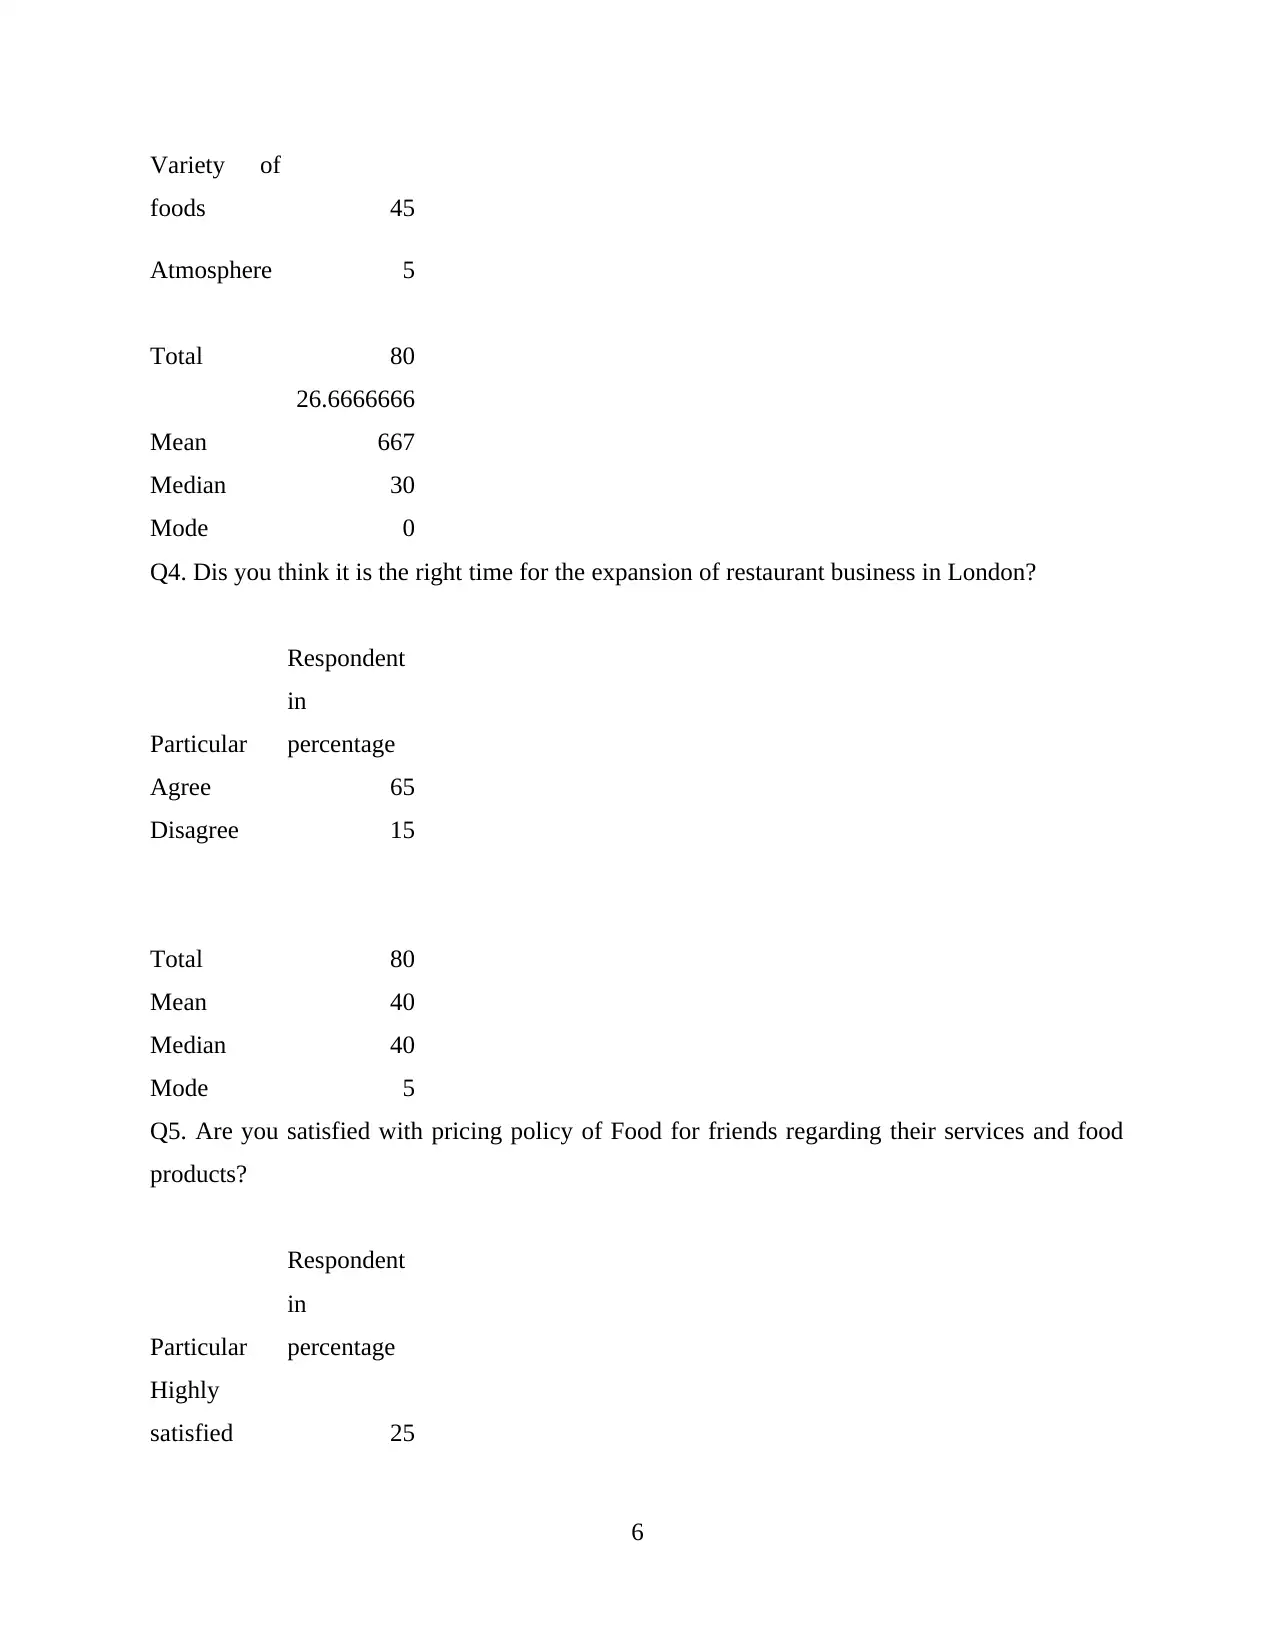
Variety of
foods 45
Atmosphere 5
Total 80
Mean
26.6666666
667
Median 30
Mode 0
Q4. Dis you think it is the right time for the expansion of restaurant business in London?
Particular
Respondent
in
percentage
Agree 65
Disagree 15
Total 80
Mean 40
Median 40
Mode 5
Q5. Are you satisfied with pricing policy of Food for friends regarding their services and food
products?
Particular
Respondent
in
percentage
Highly
satisfied 25
6
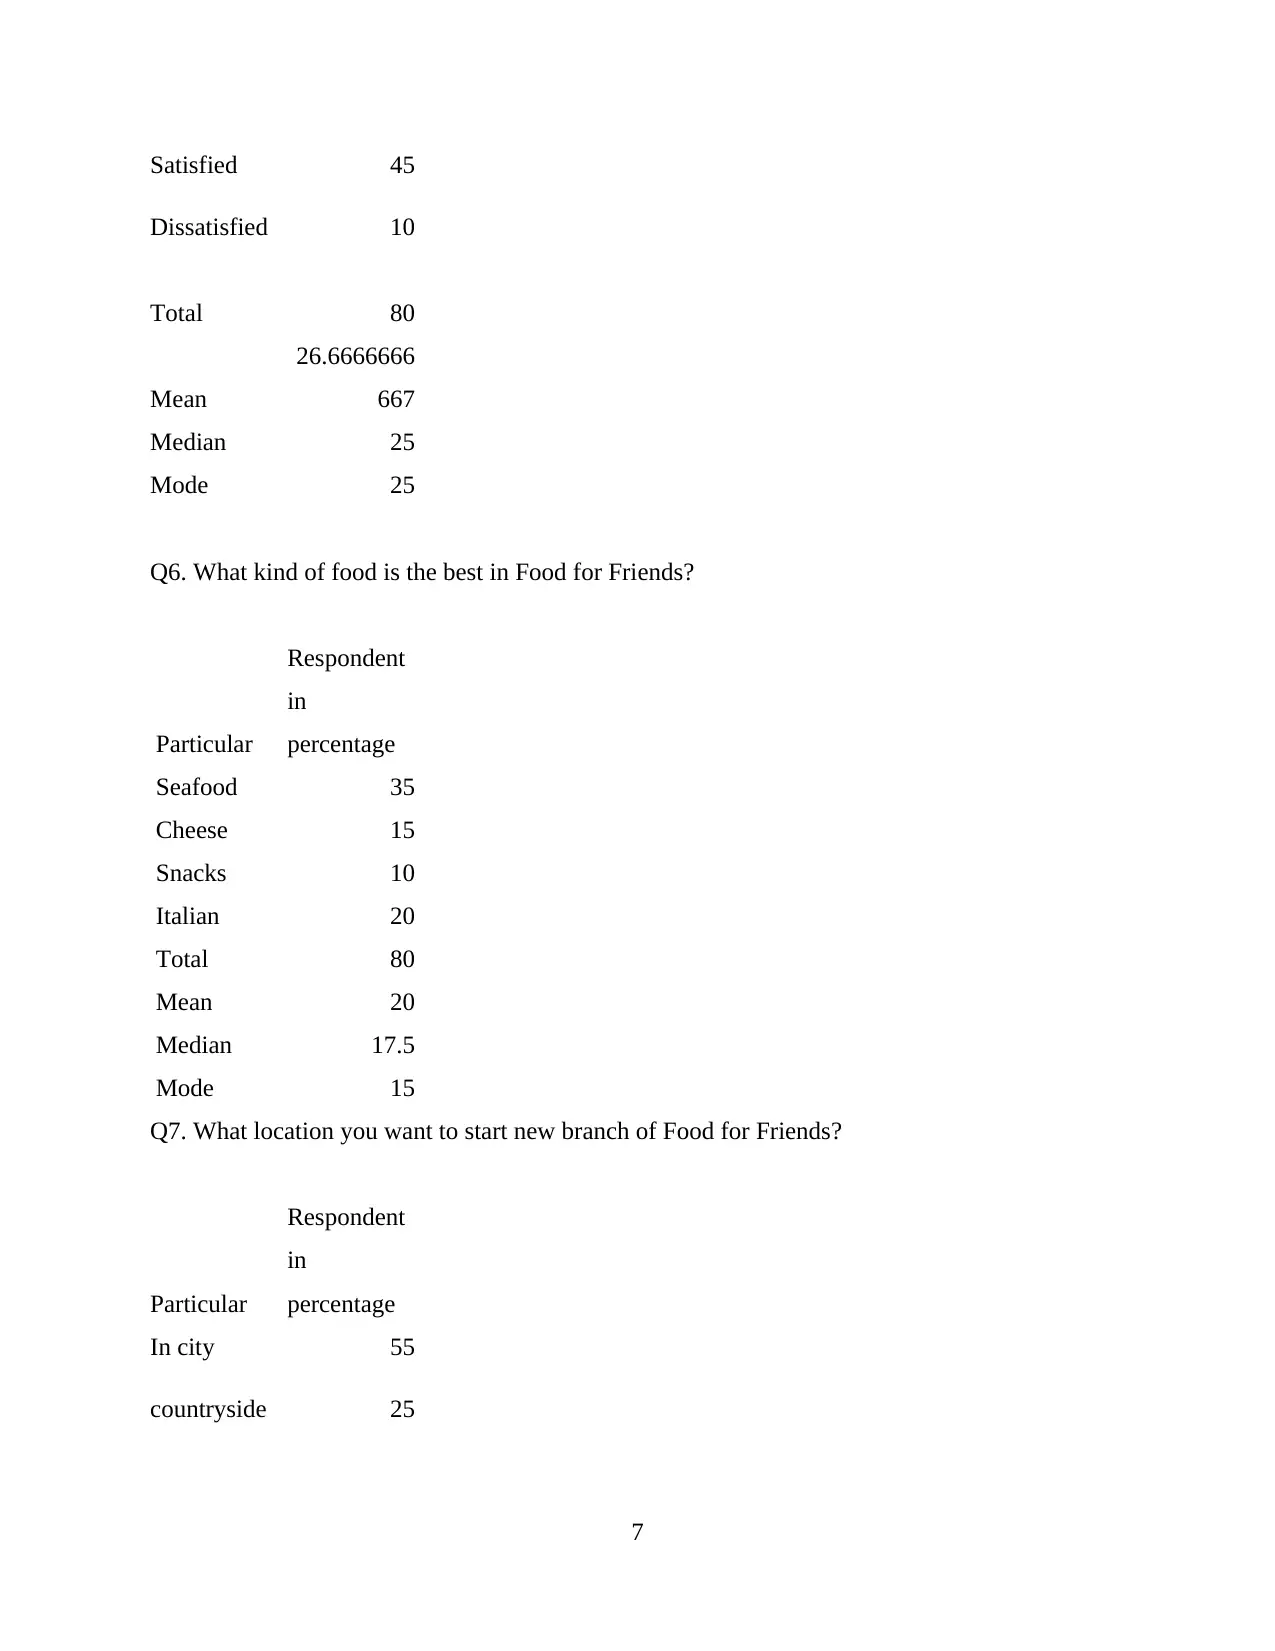
Satisfied 45
Dissatisfied 10
Total 80
Mean
26.6666666
667
Median 25
Mode 25
Q6. What kind of food is the best in Food for Friends?
Particular
Respondent
in
percentage
Seafood 35
Cheese 15
Snacks 10
Italian 20
Total 80
Mean 20
Median 17.5
Mode 15
Q7. What location you want to start new branch of Food for Friends?
Particular
Respondent
in
percentage
In city 55
countryside 25
7
⊘ This is a preview!⊘
Do you want full access?
Subscribe today to unlock all pages.
Trusted by 1+ million students worldwide
Total 80
Mean 40
Median 40
Mode 5
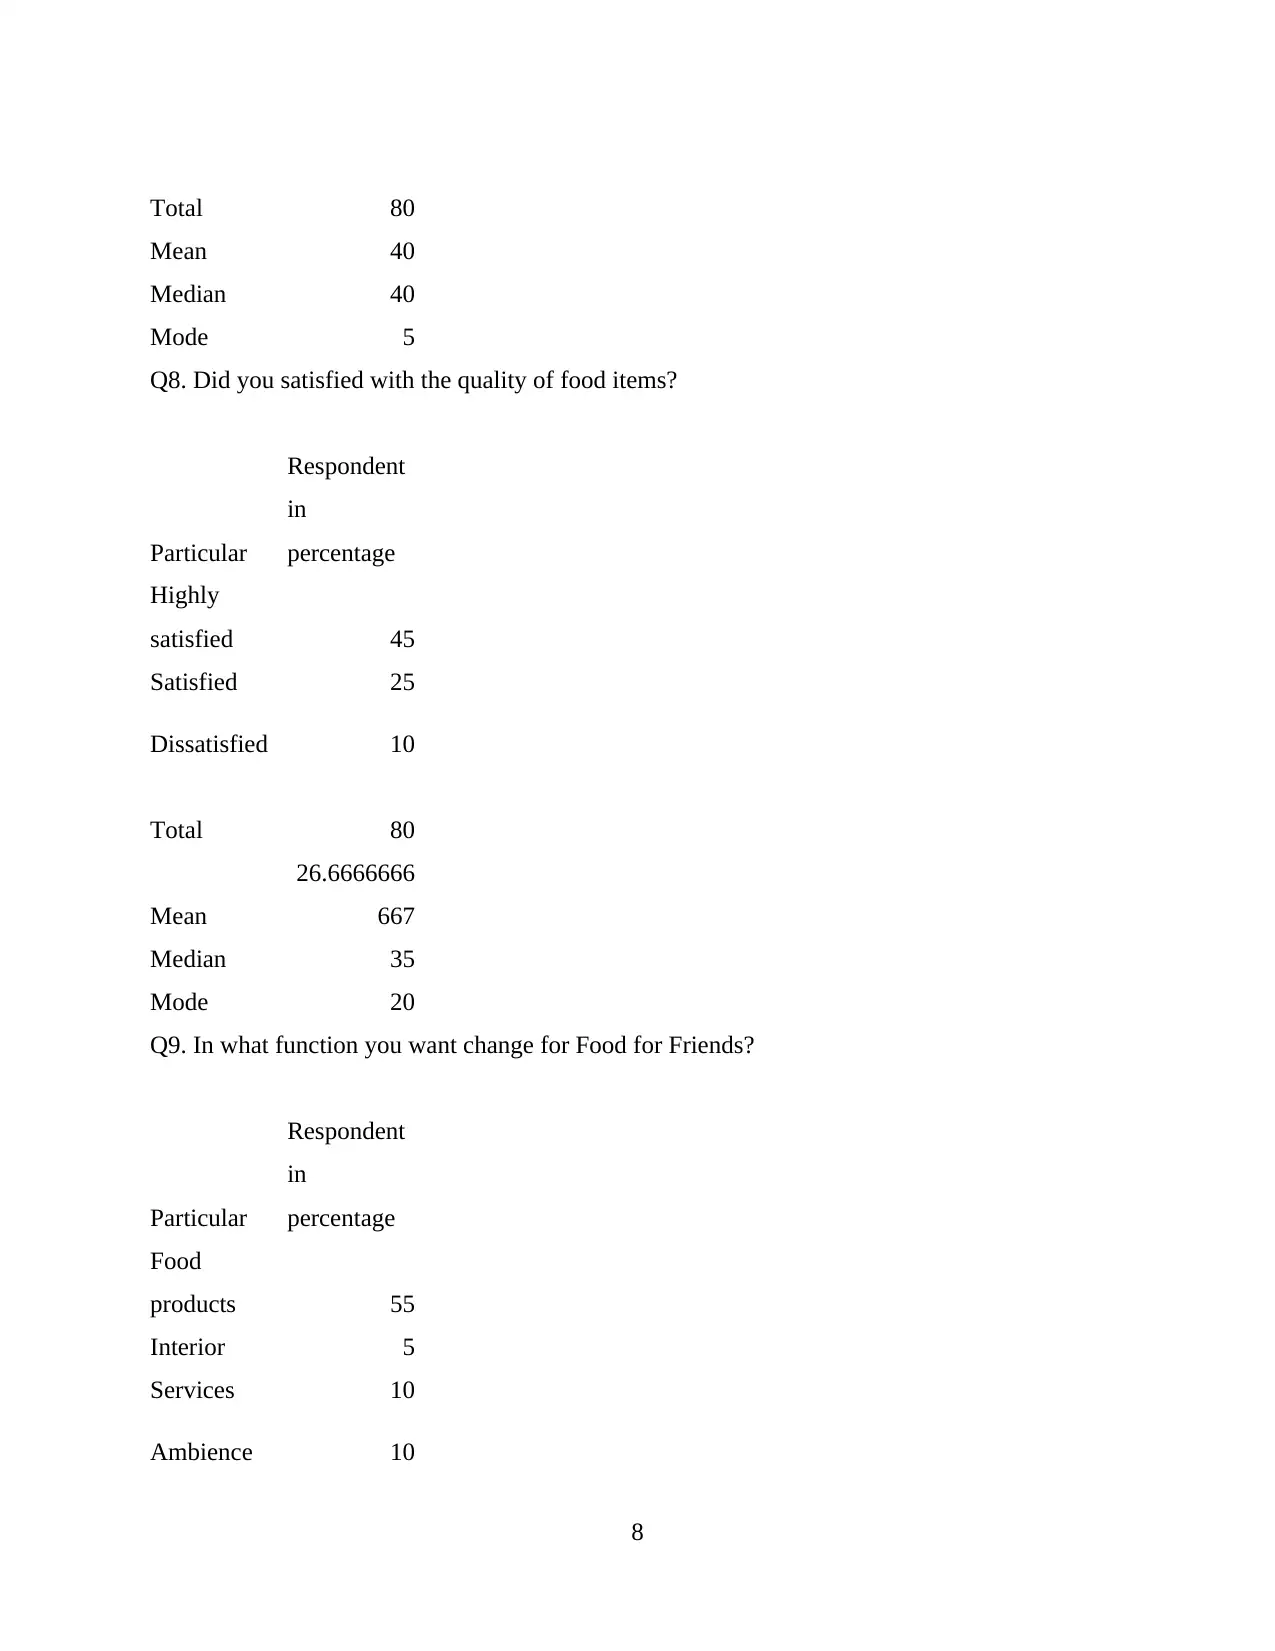
Q8. Did you satisfied with the quality of food items?
Particular
Respondent
in
percentage
Highly
satisfied 45
Satisfied 25
Dissatisfied 10
Total 80
Mean
26.6666666
667
Median 35
Mode 20
Q9. In what function you want change for Food for Friends?
Particular
Respondent
in
percentage
Food
products 55
Interior 5
Services 10
Ambience 10
8
Mean 40
Median 40
Mode 5
Q8. Did you satisfied with the quality of food items?
Particular
Respondent
in
percentage
Highly
satisfied 45
Satisfied 25
Dissatisfied 10
Total 80
Mean
26.6666666
667
Median 35
Mode 20
Q9. In what function you want change for Food for Friends?
Particular
Respondent
in
percentage
Food
products 55
Interior 5
Services 10
Ambience 10
8
Paraphrase This Document
Need a fresh take? Get an instant paraphrase of this document with our AI Paraphraser
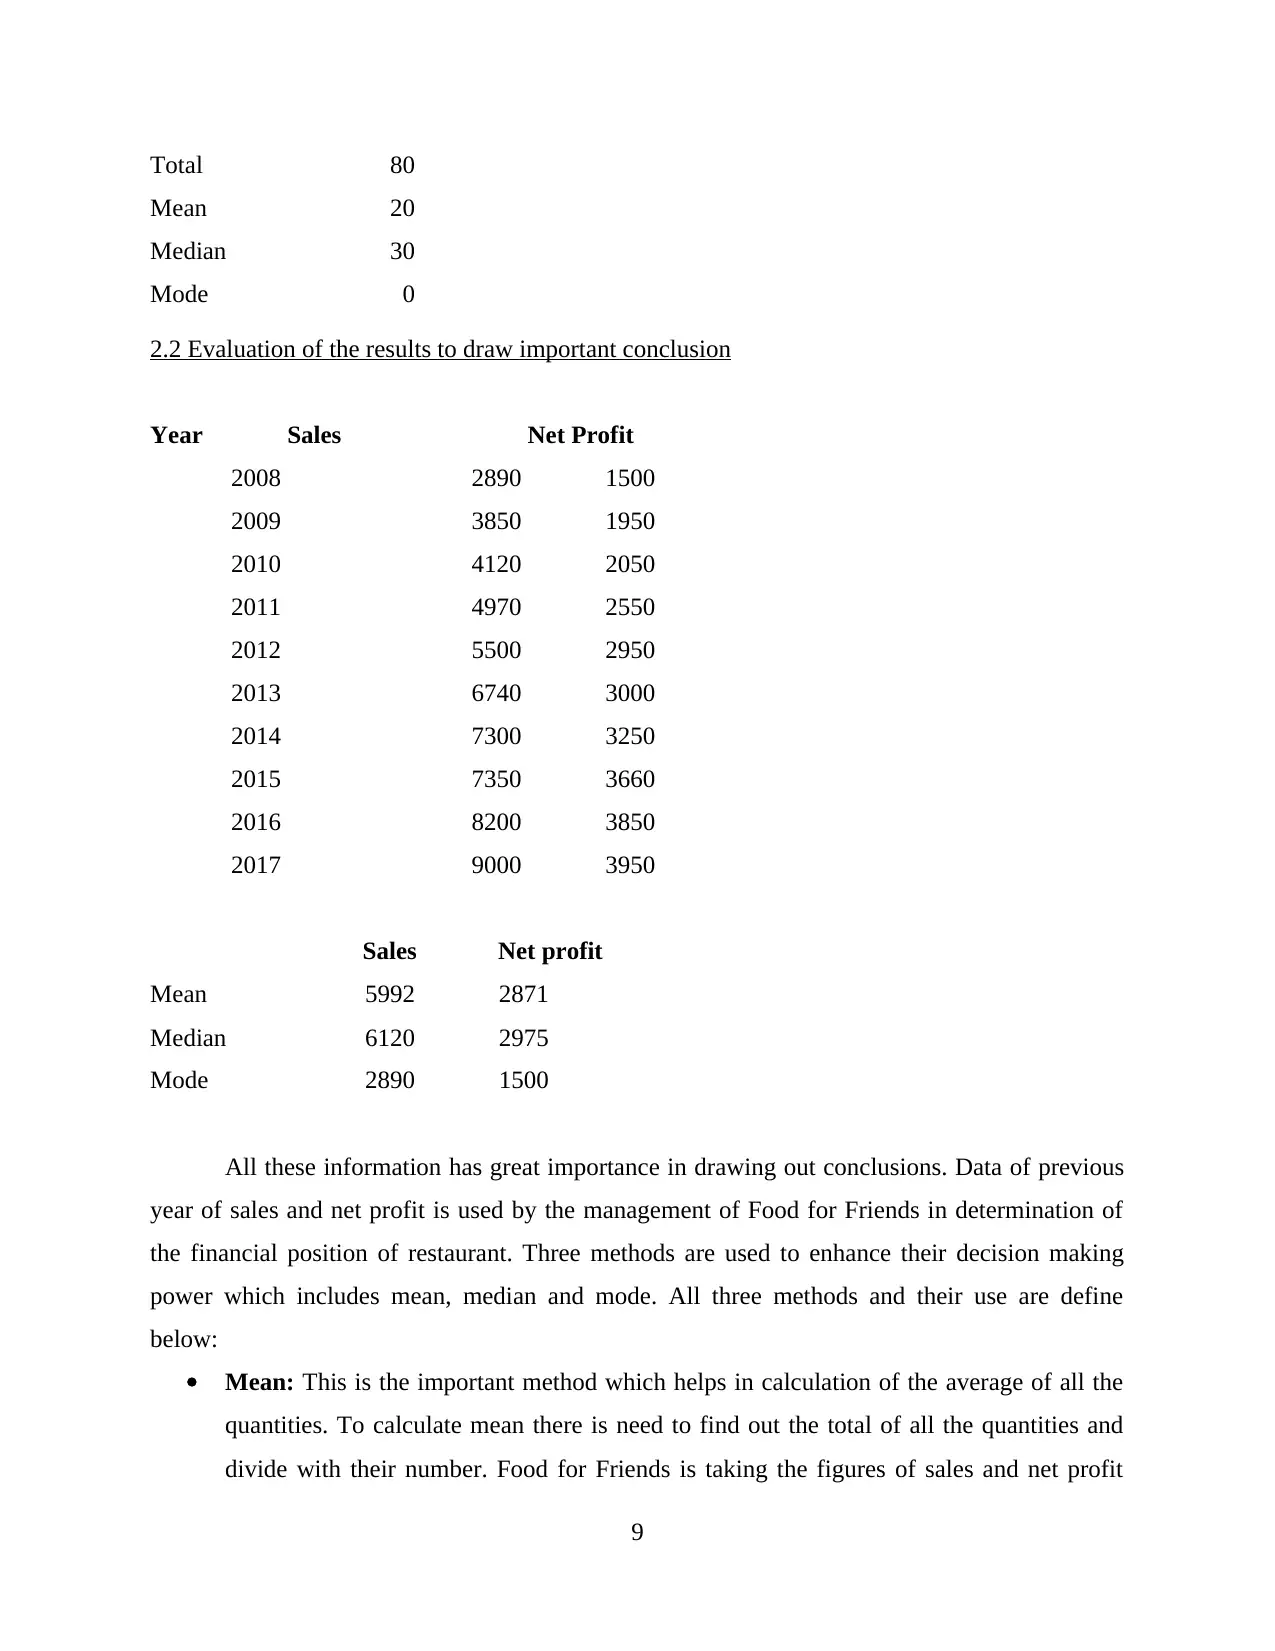
Total 80
Mean 20
Median 30
Mode 0
2.2 Evaluation of the results to draw important conclusion
Year Sales Net Profit
2008 2890 1500
2009 3850 1950
2010 4120 2050
2011 4970 2550
2012 5500 2950
2013 6740 3000
2014 7300 3250
2015 7350 3660
2016 8200 3850
2017 9000 3950
Sales Net profit
Mean 5992 2871
Median 6120 2975
Mode 2890 1500
All these information has great importance in drawing out conclusions. Data of previous
year of sales and net profit is used by the management of Food for Friends in determination of
the financial position of restaurant. Three methods are used to enhance their decision making
power which includes mean, median and mode. All three methods and their use are define
below:
Mean: This is the important method which helps in calculation of the average of all the
quantities. To calculate mean there is need to find out the total of all the quantities and
divide with their number. Food for Friends is taking the figures of sales and net profit
9
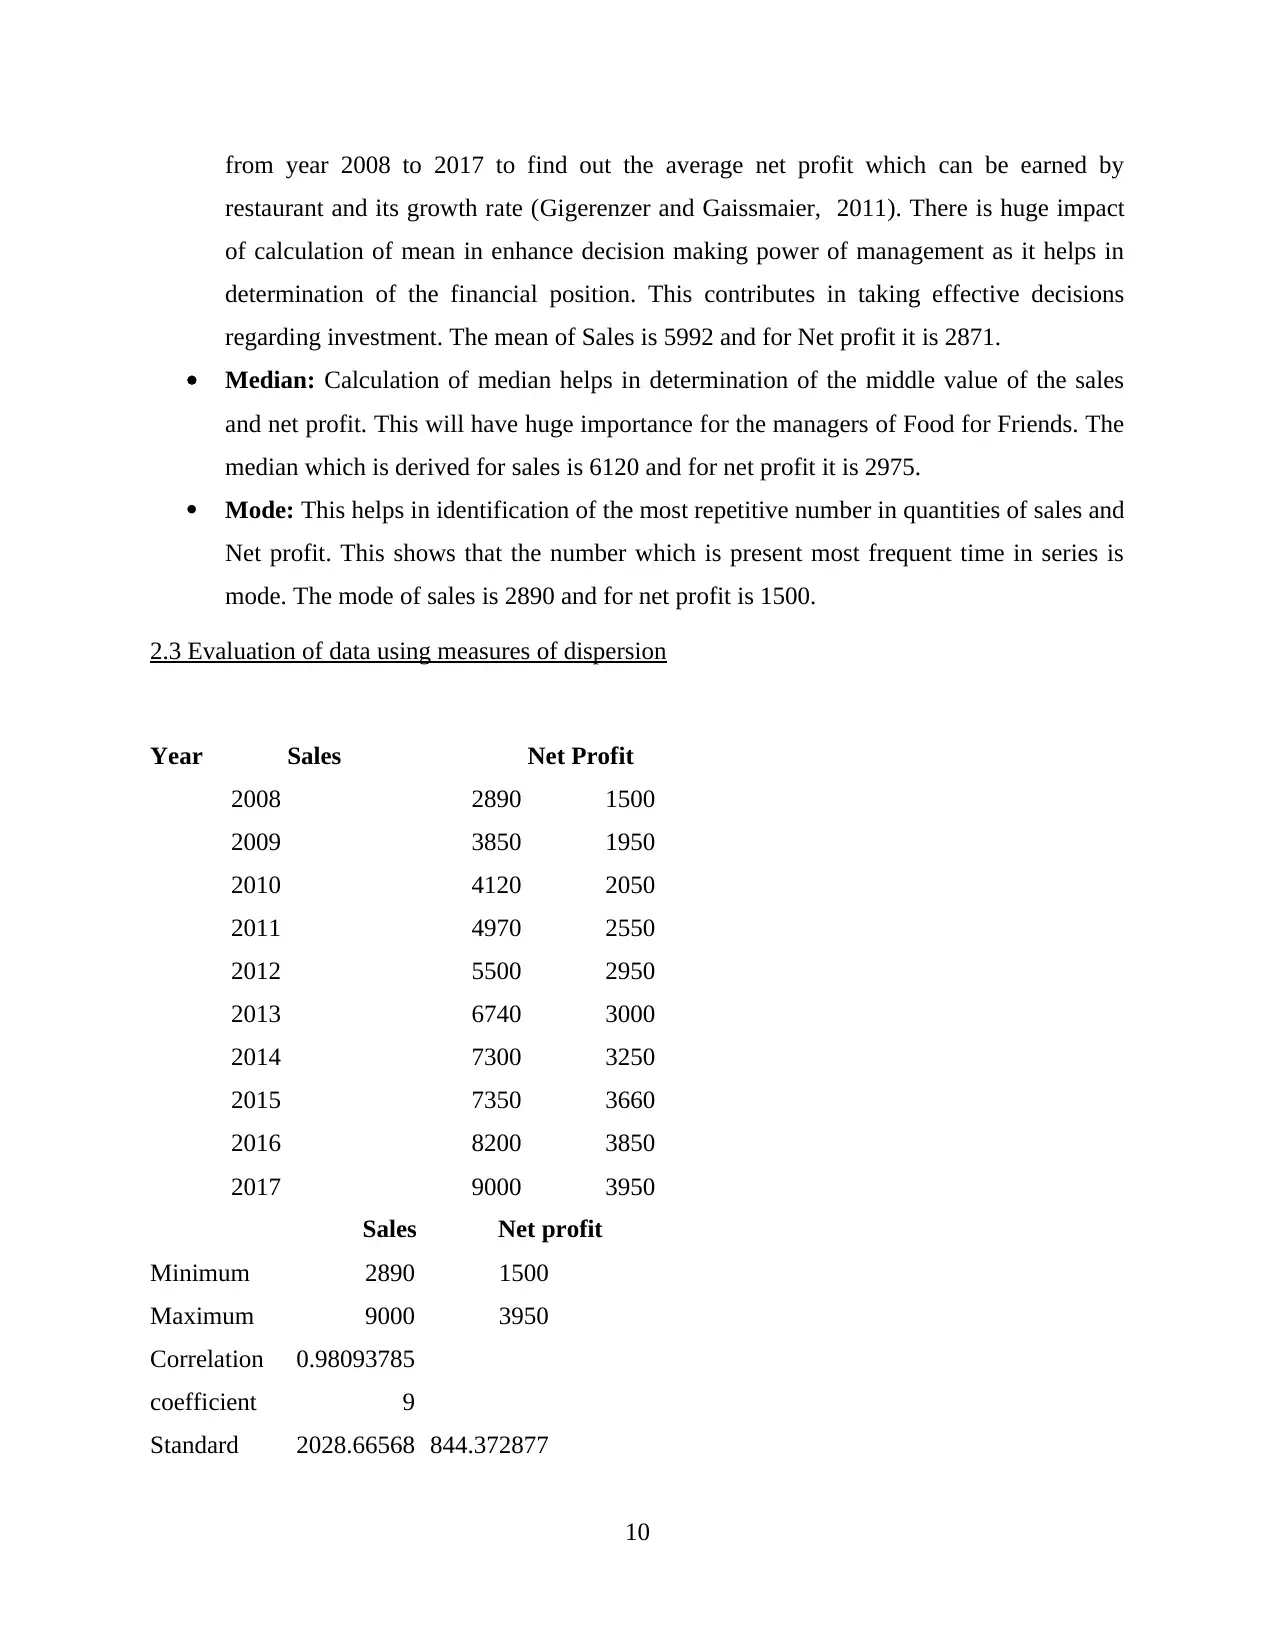
from year 2008 to 2017 to find out the average net profit which can be earned by
restaurant and its growth rate (Gigerenzer and Gaissmaier, 2011). There is huge impact
of calculation of mean in enhance decision making power of management as it helps in
determination of the financial position. This contributes in taking effective decisions
regarding investment. The mean of Sales is 5992 and for Net profit it is 2871.
Median: Calculation of median helps in determination of the middle value of the sales
and net profit. This will have huge importance for the managers of Food for Friends. The
median which is derived for sales is 6120 and for net profit it is 2975.
Mode: This helps in identification of the most repetitive number in quantities of sales and
Net profit. This shows that the number which is present most frequent time in series is
mode. The mode of sales is 2890 and for net profit is 1500.
2.3 Evaluation of data using measures of dispersion
Year Sales Net Profit
2008 2890 1500
2009 3850 1950
2010 4120 2050
2011 4970 2550
2012 5500 2950
2013 6740 3000
2014 7300 3250
2015 7350 3660
2016 8200 3850
2017 9000 3950
Sales Net profit
Minimum 2890 1500
Maximum 9000 3950
Correlation
coefficient
0.98093785
9
Standard 2028.66568 844.372877
10
⊘ This is a preview!⊘
Do you want full access?
Subscribe today to unlock all pages.
Trusted by 1+ million students worldwide
1 out of 22
Related Documents


Your All-in-One AI-Powered Toolkit for Academic Success.
+13062052269
info@desklib.com
Available 24*7 on WhatsApp / Email
![[object Object]](/_next/static/media/star-bottom.7253800d.svg)
Unlock your academic potential
Copyright © 2020–2026 A2Z Services. All Rights Reserved. Developed and managed by ZUCOL.