Business Data Research: Statistical Analysis of COVID-19 Price Changes

Verified

Added on  2023/06/15

|1
|256
|468
Presentation
AI Summary
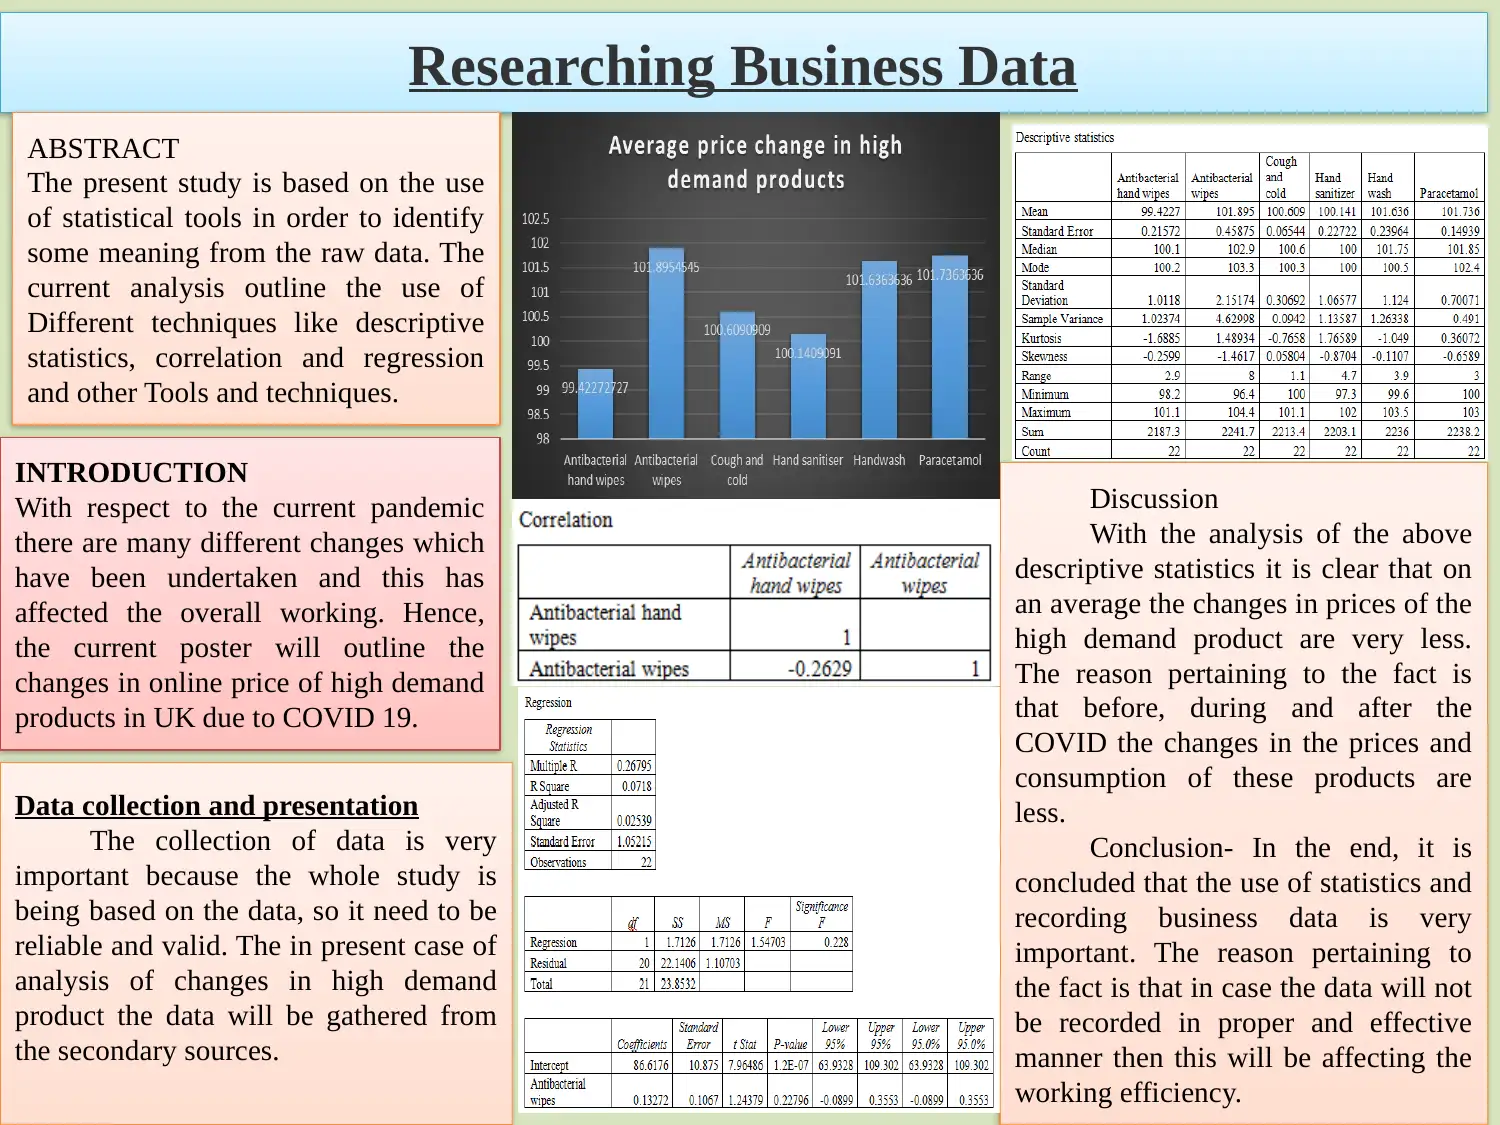
This presentation explores the use of statistical tools in business data research, focusing on the impact of COVID-19 on online prices of high-demand products in the UK. The study employs descriptive statistics, correlation, and regression analysis to interpret data collected from secondary sources. The analysis reveals that price changes in high-demand products were minimal during the pandemic, attributed to stable consumption patterns. The presentation emphasizes the importance of accurate data recording for effective business operations. Desklib provides access to similar solved assignments and past papers for students.
Document Page
Researching Business Data
INTRODUCTION
With respect to the current pandemic
there are many different changes which
have been undertaken and this has
affected the overall working. Hence,
the current poster will outline the
changes in online price of high demand
products in UK due to COVID 19.
Data collection and presentation
The collection of data is very
important because the whole study is
being based on the data, so it need to be
reliable and valid. The in present case of
analysis of changes in high demand
product the data will be gathered from
the secondary sources.
Discussion
With the analysis of the above
descriptive statistics it is clear that on
an average the changes in prices of the
high demand product are very less.
The reason pertaining to the fact is
that before, during and after the
COVID the changes in the prices and
consumption of these products are
less.
Conclusion- In the end, it is
concluded that the use of statistics and
recording business data is very
important. The reason pertaining to
the fact is that in case the data will not
be recorded in proper and effective
manner then this will be affecting the
working efficiency.
ABSTRACT
The present study is based on the use
of statistical tools in order to identify
some meaning from the raw data. The
current analysis outline the use of
Different techniques like descriptive
statistics, correlation and regression
and other Tools and techniques.
tabler-icon-diamond-filled.svg

Secure Best Marks with AI Grader

Need help grading? Try our AI Grader for instant feedback on your assignments.
chevron_up_icon
1 out of 1
circle_padding
hide_on_mobile
zoom_out_icon
[object Object]