ECOM 500: Enhancing Business with Data Visualization and GIS Solutions
VerifiedAdded on 2022/09/06
|9
|1772
|18
Report
AI Summary
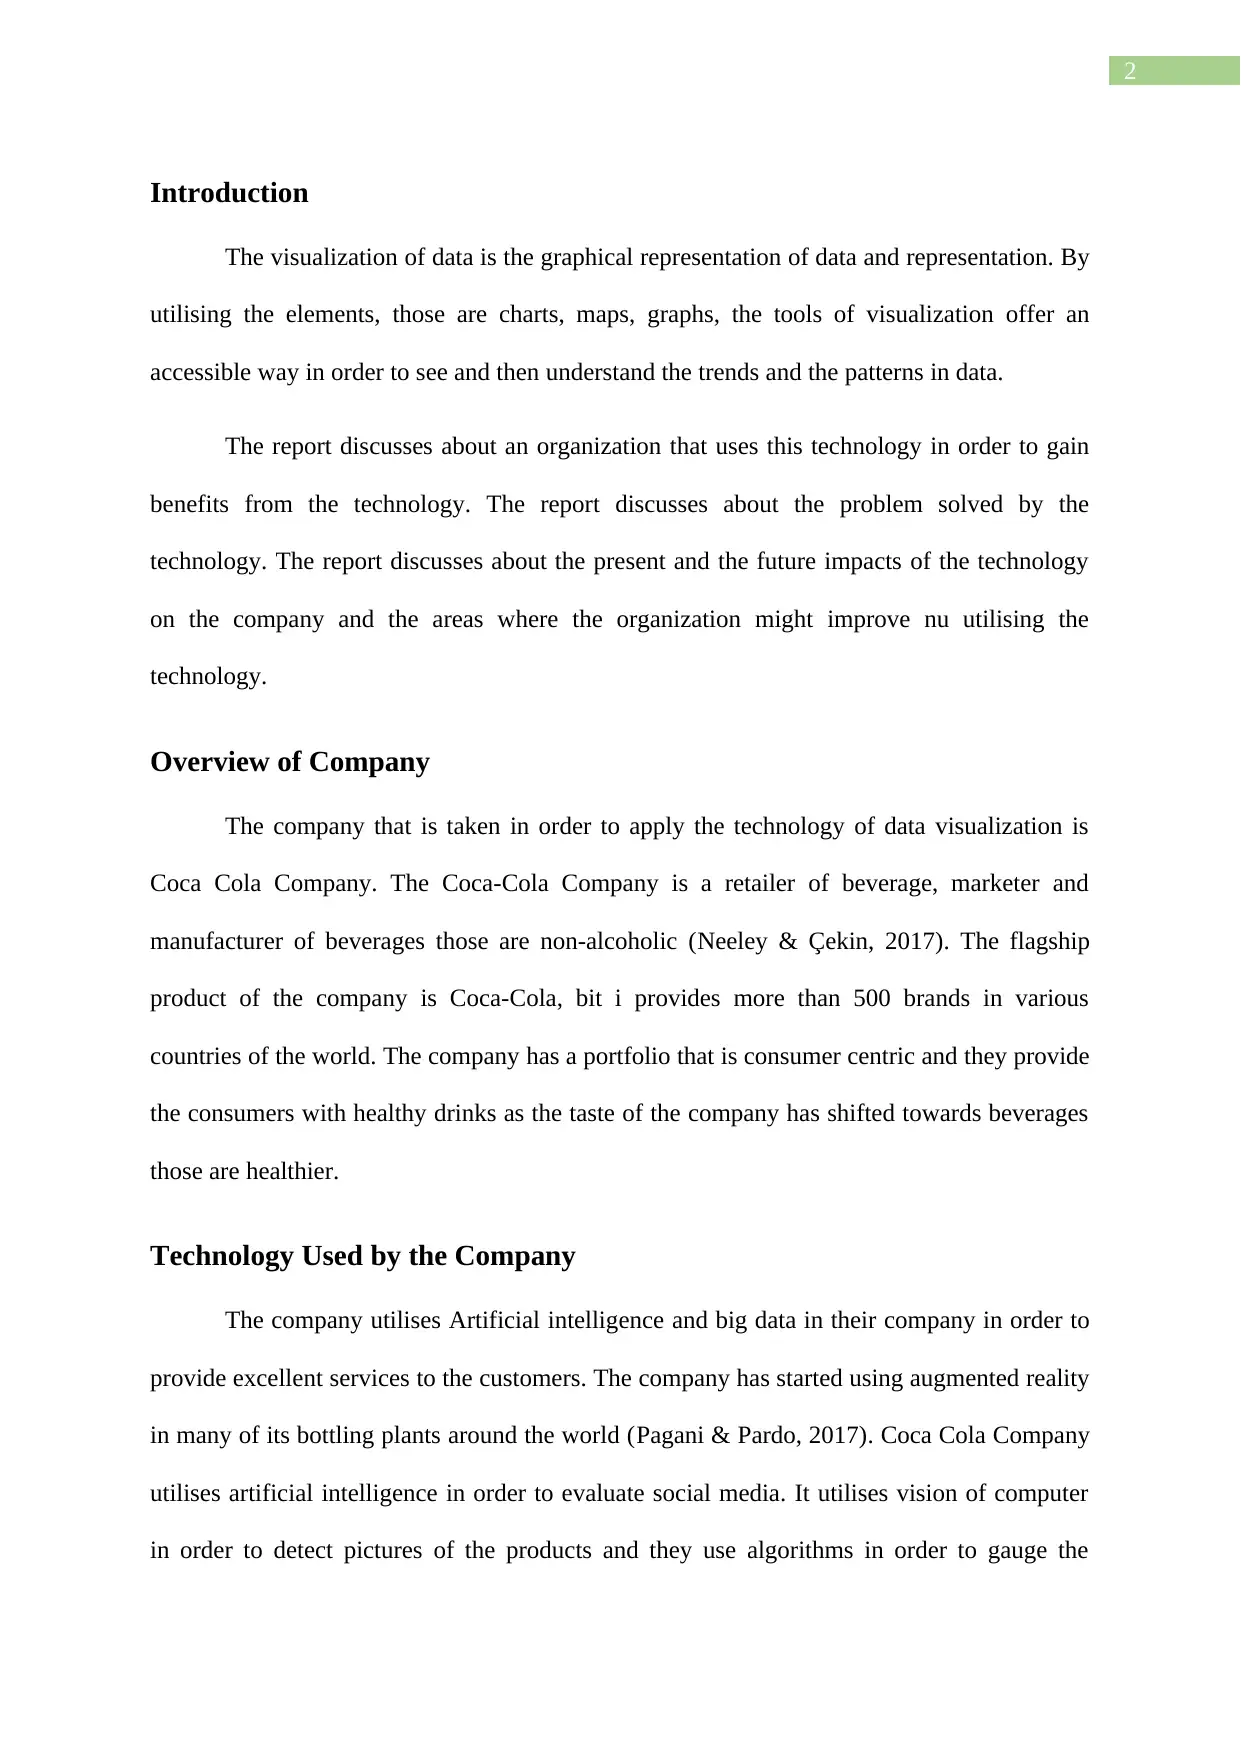
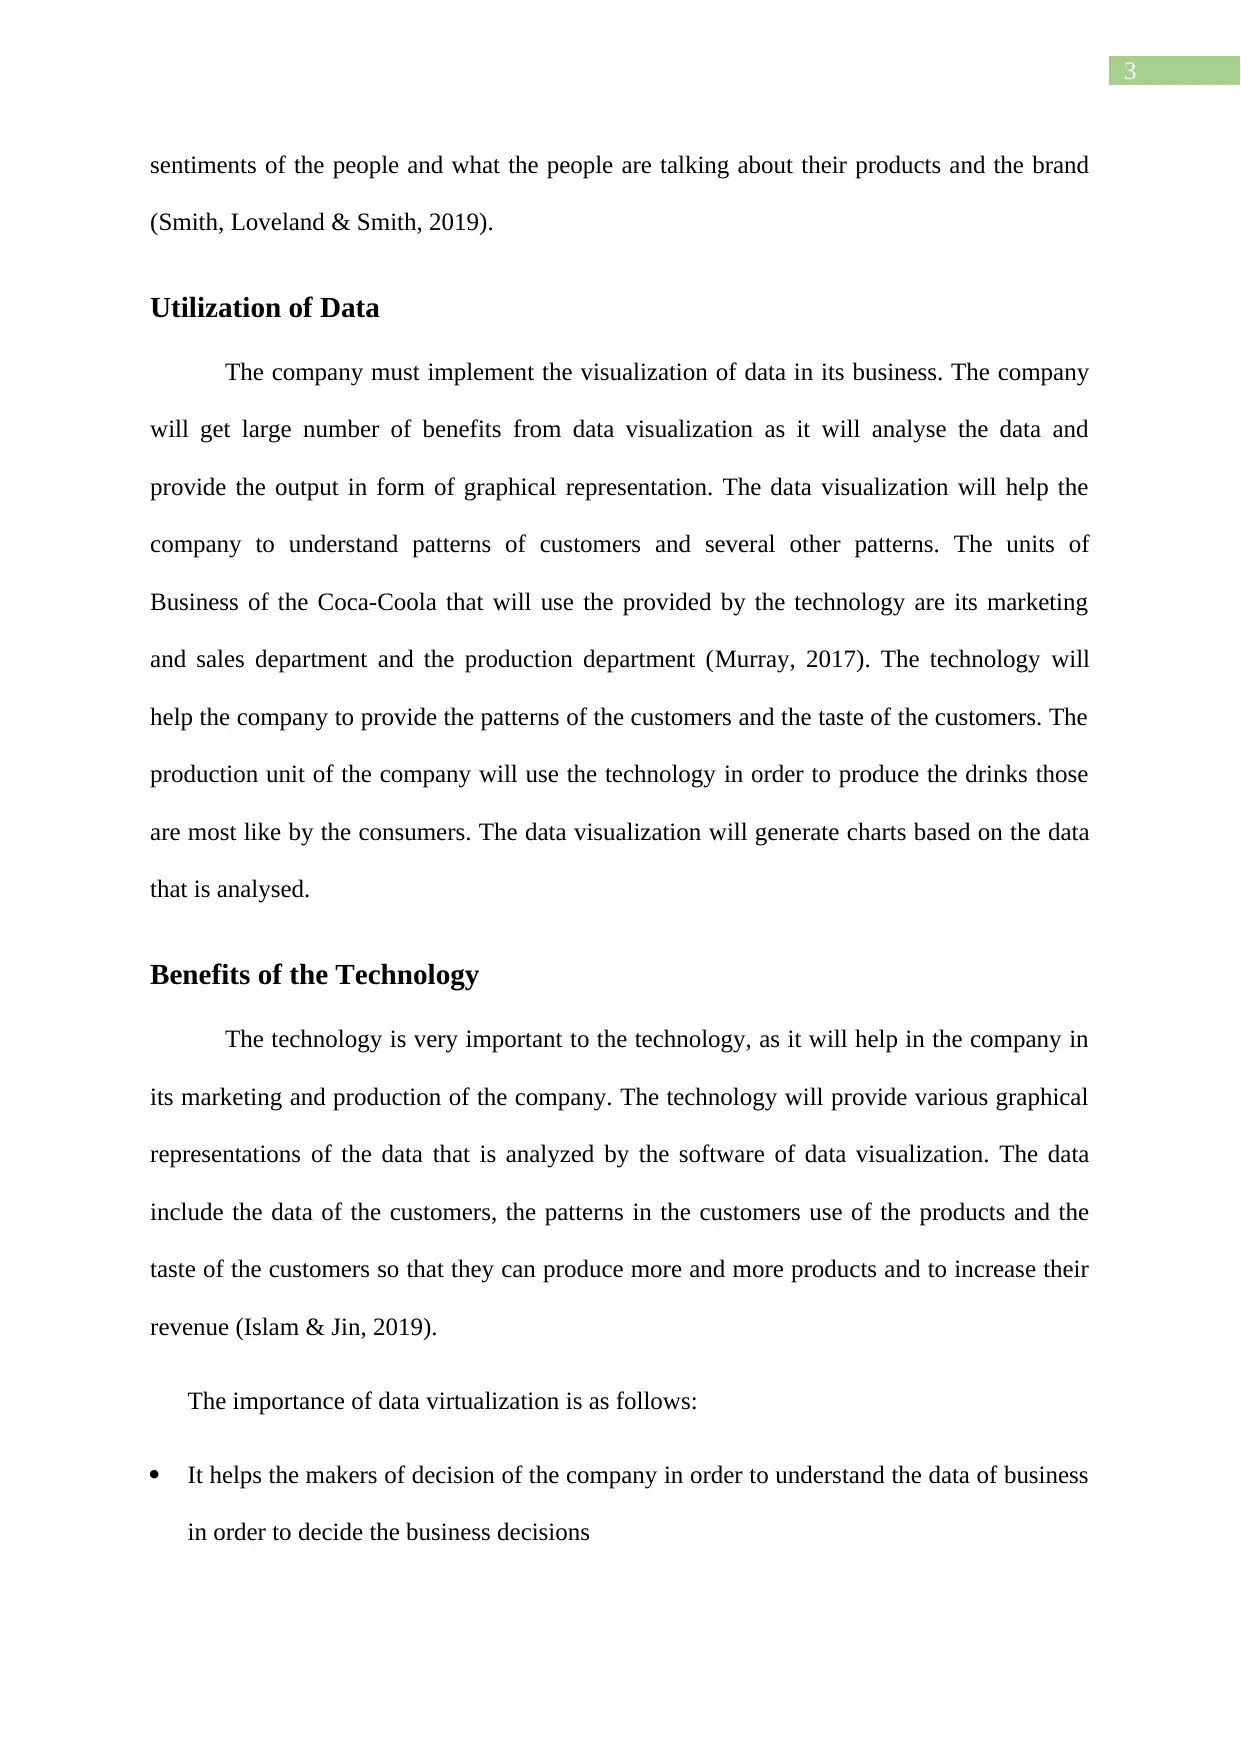
This report examines the application of data visualization and Geographic Information Systems (GIS) solutions within a business context, focusing on the Coca-Cola Company. It identifies the technologies employed by Coca-Cola, such as artificial intelligence and augmented reality, and proposes the integration of data visualization to enhance decision-making across marketing, sales, and production units. The report highlights the benefits of data visualization, including improved data analysis, pattern identification, and error detection, leading to better business insights and strategic decision-making. It also suggests areas for improvement within Coca-Cola, such as leveraging data visualization for better customer understanding and targeted marketing efforts to increase productivity and profitability. The report concludes that implementing data visualization technologies can significantly enhance Coca-Cola's operational efficiency and customer engagement.

Running head: DATA VISUALIZATION AND GIS SOLUTIONS
DATA VISUALIZATION AND GIS SOLUTIONS
Name of the Student
Name of the University
Author Note
DATA VISUALIZATION AND GIS SOLUTIONS
Name of the Student
Name of the University
Author Note
Paraphrase This Document
Need a fresh take? Get an instant paraphrase of this document with our AI Paraphraser

1
Table of Contents
Introduction................................................................................................................................2
Overview of Company...............................................................................................................2
Technology Used by the Company............................................................................................2
Utilization of Data......................................................................................................................3
Benefits of the Technology........................................................................................................3
Areas to Improve........................................................................................................................5
Conclusion..................................................................................................................................5
References..................................................................................................................................7

2
Introduction
The visualization of data is the graphical representation of data and representation. By
utilising the elements, those are charts, maps, graphs, the tools of visualization offer an
accessible way in order to see and then understand the trends and the patterns in data.
The report discusses about an organization that uses this technology in order to gain
benefits from the technology. The report discusses about the problem solved by the
technology. The report discusses about the present and the future impacts of the technology
on the company and the areas where the organization might improve nu utilising the
technology.
Overview of Company
The company that is taken in order to apply the technology of data visualization is
Coca Cola Company. The Coca-Cola Company is a retailer of beverage, marketer and
manufacturer of beverages those are non-alcoholic (Neeley & Çekin, 2017). The flagship
product of the company is Coca-Cola, bit i provides more than 500 brands in various
countries of the world. The company has a portfolio that is consumer centric and they provide
the consumers with healthy drinks as the taste of the company has shifted towards beverages
those are healthier.
Technology Used by the Company
The company utilises Artificial intelligence and big data in their company in order to
provide excellent services to the customers. The company has started using augmented reality
in many of its bottling plants around the world (Pagani & Pardo, 2017). Coca Cola Company
utilises artificial intelligence in order to evaluate social media. It utilises vision of computer
in order to detect pictures of the products and they use algorithms in order to gauge the
⊘ This is a preview!⊘
Do you want full access?
Subscribe today to unlock all pages.

Trusted by 1+ million students worldwide

3
sentiments of the people and what the people are talking about their products and the brand
(Smith, Loveland & Smith, 2019).
Utilization of Data
The company must implement the visualization of data in its business. The company
will get large number of benefits from data visualization as it will analyse the data and
provide the output in form of graphical representation. The data visualization will help the
company to understand patterns of customers and several other patterns. The units of
Business of the Coca-Coola that will use the provided by the technology are its marketing
and sales department and the production department (Murray, 2017). The technology will
help the company to provide the patterns of the customers and the taste of the customers. The
production unit of the company will use the technology in order to produce the drinks those
are most like by the consumers. The data visualization will generate charts based on the data
that is analysed.
Benefits of the Technology
The technology is very important to the technology, as it will help in the company in
its marketing and production of the company. The technology will provide various graphical
representations of the data that is analyzed by the software of data visualization. The data
include the data of the customers, the patterns in the customers use of the products and the
taste of the customers so that they can produce more and more products and to increase their
revenue (Islam & Jin, 2019).
The importance of data virtualization is as follows:
It helps the makers of decision of the company in order to understand the data of business
in order to decide the business decisions
Paraphrase This Document
Need a fresh take? Get an instant paraphrase of this document with our AI Paraphraser

4
Handling huge amounts of data in the format of picture in order to provide a good
summary of the unseen data patterns thereby revealing the insights and story that is
behind the data in order to develop goals of business.
When considering the strategies and goals of business, the visualization of data provides
advantages to the makers of in various ways in order to upgrade the insights of data (Shukla
& Dhir, 2016). The benefit that will be provided by data visualization to the company
include:
Better analysis of data
Quick action on the basis of data analysis
Identification of patterns based on analysis of data
Finding errors in the business procedures and providing solutions to the same
It will explore the business insights of a company
Helps to grasp the latest trends
There can be various problems in a company and these must be solved in order to
increase it production and provide good services to the people.
The abilities of data visualization can strengthen the making of decisions by enabling the
leaders of operations and business to recognise the nature of the problem. In the Coca-Cola
Company, data visualization will be immense use. The company has started using artificial
intelligence. Data visualization will help the company to solve the problems of marketing and
sales (Gutiérrez & Pérez, 2016). The data visualization software will collect the data of the
customers about their taste and it will analyse the data and provide reports to the company.
The company will use the reports to see the patterns and make proper decisions in order to
reach the customer. These will result in huge sales of the company and it will increase the
revenue of the company. Data visualization will help the problem of production of the

5
company. The software of data visualization will analyse the data of the customers about the
products those are more liked by the customers and it will generate reports based on that. The
reports will consist of pictorial representation such as bar graphs and line graphs (Tam &
Song, 2016). The managers of the company will analyse the reports and based on the reports
they make decisions about the production of the products those are more liked by the
company and then help it to reach the customers.
Areas to Improve
The visualization of data assist the company in order to evaluate the various processes
so that the management of the company can focus on the areas that can be improved in order
to generate more revenue and upgrade the productivity. The technology brings business
intelligence to life. It applies an approach that is creative in order to understand the hidden
data in the data of business. The areas that can be improved by the Coca-Cola Company are
its production units and marketing units. The research and development of the company is
great (Kokina, Pachamanova & Corbett, 2017). The company can implement the technology
of data visualization other than artificial intelligence and augmented reality. The data
visualization will help the company to collect the data of the customers and analyse the data
based on several metrics. The software of data visualization will then generate reports based
on the data those are analysed. The reports will consist of pictorial representation and then
can make decisions based on the reports.
The company should do it in order to reach the customers through marketing and then
ensure that their sales are high. It will help them to increase their productivity and in turn,
they will have increased profits. The company can also provide excellent services to the
customers (Wexler, Shaffer & Cotgreave, 2017).
⊘ This is a preview!⊘
Do you want full access?
Subscribe today to unlock all pages.

Trusted by 1+ million students worldwide

6
Conclusion
From the report, it can be inferred that Coca-Cola Company is one of the largest
retailer of beverages and it uses various technologies in its company for better productions
and customer services. The company should implement the technology of data visualization
in the company so that they can increase their productivity and make proper decisions. It will
upgrade the marketing and sales unit of the company and the production unit of the company.
The company must implement the technology, as it as several benefits and it will help them
to reach the customers.
Paraphrase This Document
Need a fresh take? Get an instant paraphrase of this document with our AI Paraphraser

7
References
Gutiérrez, A., & Pérez, C. B. (2016). Data visualization process through storytelling
technique in Business Intelligence. Avances en Interacción Humano-Computadora,
(1), 49-52.
Islam, M., & Jin, S. (2019, November). An Overview of Data Visualization. In 2019
International Conference on Information Science and Communications Technologies
(ICISCT) (pp. 1-7). IEEE.
Kokina, J., Pachamanova, D., & Corbett, A. (2017). The role of data visualization and
analytics in performance management: Guiding entrepreneurial growth
decisions. Journal of Accounting Education, 38, 50-62.
Murray, S. (2017). Interactive data visualization for the web: an introduction to designing
with. " O'Reilly Media, Inc.".
Neeley, T., & Çekin, E. (2017). Global Leadership in a Dynamic and Evolving Region:
Molinas@ The Coca-Cola Company (A).
Pagani, M., & Pardo, C. (2017). The impact of digital technology on relationships in a
business network. Industrial Marketing Management, 67, 185-192.
Shukla, A., & Dhir, S. (2016). Tools for data visualization in business intelligence: case study
using the tool Qlikview. In Information Systems Design and Intelligent
Applications (pp. 319-326). Springer, New Delhi.
Smith, K. T., Loveland, K. A., & Smith, L. M. (2019). SOCIAL MEDIA USAGE AND
RELATIONSHIP TO REVENUE AMONG TECHNOLOGY FIRMS. GLOBAL
JOURNAL OF ACCOUNTING AND FINANCE, 3(1), 93.

8
Tam, N. T., & Song, I. (2016). Big data visualization. In Information Science and
Applications (ICISA) 2016 (pp. 399-408). Springer, Singapore.
Wexler, S., Shaffer, J., & Cotgreave, A. (2017). The big book of dashboards: visualizing your
data using real-world business scenarios. John Wiley & Sons.
Tam, N. T., & Song, I. (2016). Big data visualization. In Information Science and
Applications (ICISA) 2016 (pp. 399-408). Springer, Singapore.
Wexler, S., Shaffer, J., & Cotgreave, A. (2017). The big book of dashboards: visualizing your
data using real-world business scenarios. John Wiley & Sons.
⊘ This is a preview!⊘
Do you want full access?
Subscribe today to unlock all pages.

Trusted by 1+ million students worldwide
1 out of 9
Related Documents
Your All-in-One AI-Powered Toolkit for Academic Success.
+13062052269
info@desklib.com
Available 24*7 on WhatsApp / Email
Unlock your academic potential
Copyright © 2020–2026 A2Z Services. All Rights Reserved. Developed and managed by ZUCOL.


