Business Decision Making Report: Data Presentation & Investment
VerifiedAdded on 2020/06/03
|19
|4317
|304
Report
AI Summary
This report provides a comprehensive analysis of business decision-making processes, encompassing various crucial aspects. It begins with an introduction to the significance of informed decision-making, followed by a detailed discussion on data collection methods, including primary and secondary data. The report delves into diverse survey methodologies and sampling techniques, assessing their strengths and weaknesses. Data representation methods such as bar charts, pie charts, and scatter diagrams are explored to present information in a comprehensible manner. Furthermore, the report examines measures of dispersion, average marks, and their interpretations. Capital budgeting techniques, including Net Present Value (NPV) and Internal Rate of Return (IRR), are computed and analyzed, providing insights into investment appraisal. The report concludes with a project plan and calculations, offering a holistic view of the decision-making process. This report is designed to help students understand the complexities of business decision-making.

BUSINESS
DECISION MAKING
DECISION MAKING
Paraphrase This Document
Need a fresh take? Get an instant paraphrase of this document with our AI Paraphraser
Table of Contents
INTRODUCTION...........................................................................................................................1
TASK 1............................................................................................................................................1
1.1 Plan for collection of primary and secondary data................................................................1
1.2 Survey methodologies and sampling methods......................................................................1
1.3 Questionnaire to collect data from prospective parents.........................................................4
TASK 2............................................................................................................................................5
2.1 Presentation of data in comprehensible manner....................................................................5
2.2 and 2.3 Measures of dispersion and Average marks.............................................................6
2.4 Interpretation and explanation to answers.............................................................................6
TASK 3............................................................................................................................................7
3.1 Data presentation through bar and pie chart..........................................................................7
3.2 Scatter diagram presentation..................................................................................................9
3.3 Computation of average weight of children and line of best fit..........................................10
TASK 4..........................................................................................................................................11
4.1 Various methods of investment appraisal and its merits and demerits................................11
4.2 Preparation of project plan...................................................................................................13
4.3 Calculation of Net Present Value (NPV) and Internal Rate of Return (IRR)......................15
CONCLUSION..............................................................................................................................16
REFERENCES..............................................................................................................................17
INTRODUCTION
TASK 1
It is important for businesses to consider all the necessary aspects before taking any
decisions so that the objectives can be fulfilled in a well defined manner. The report makes
comprehensive discussion on various sampling methods, such as, stratified, simple random,
systematic etc. It helps in ascertaining various strengths and weakness of different sampling
methods. The report further will discuss various data representation methods such as, bar chart,
pie chart, scatter diagram etc. The report will then focus on different capital budgeting
techniques and there calculation as well. These techniques include, Net present Value, Payback
Period, Average rate of Return, Internal Rate of Return etc.
1.1 Plan for collection of primary and secondary data
The data for school can be collected in the following manner:
Primary data: It is the first hand data collected for the specific study in order to serve its
purpose. In the given scenario, the data will be collected to make an assessment for the school
and ascertain that whether the new branch will prove to be beneficial for the successful for
overall development of school or not. Hence, in order to serve this purpose survey will be
conducted among the parents to ascertain that what all facilities they see in the school before
admitting their children into it (Zsambok, 2014). Moreover, it will also help in assessing the
requirement level of the school in that area as well.
Secondary data: It is the second hand data which has already been collected by any other
researcher. It can be taken as a base while conducting any study of similar nature. Data can be in
the form of census, information being collected by public or government department,
organizational record, etc. In the given case, data of school that are currently present in the area
can be gathered through local publications. Further, data regarding basic amenities to be present
in the school can also be gathered from secondary sources. Hence, secondary source of data will
prove to be beneficial for the school which is planning to set up its branch in Surrey.
1.2 Survey methodologies and sampling methods
There are various methods that are present n case of survey. However, in order t find out
the suitable method for the same, Excellent School plc is required to analyse the survey methods
that can help in appropriate decision making. Therefore, in order to serve this purpose, it is
important to analyse the strength and weakness of all the survey methodologies.
1
⊘ This is a preview!⊘
Do you want full access?
Subscribe today to unlock all pages.
Trusted by 1+ million students worldwide
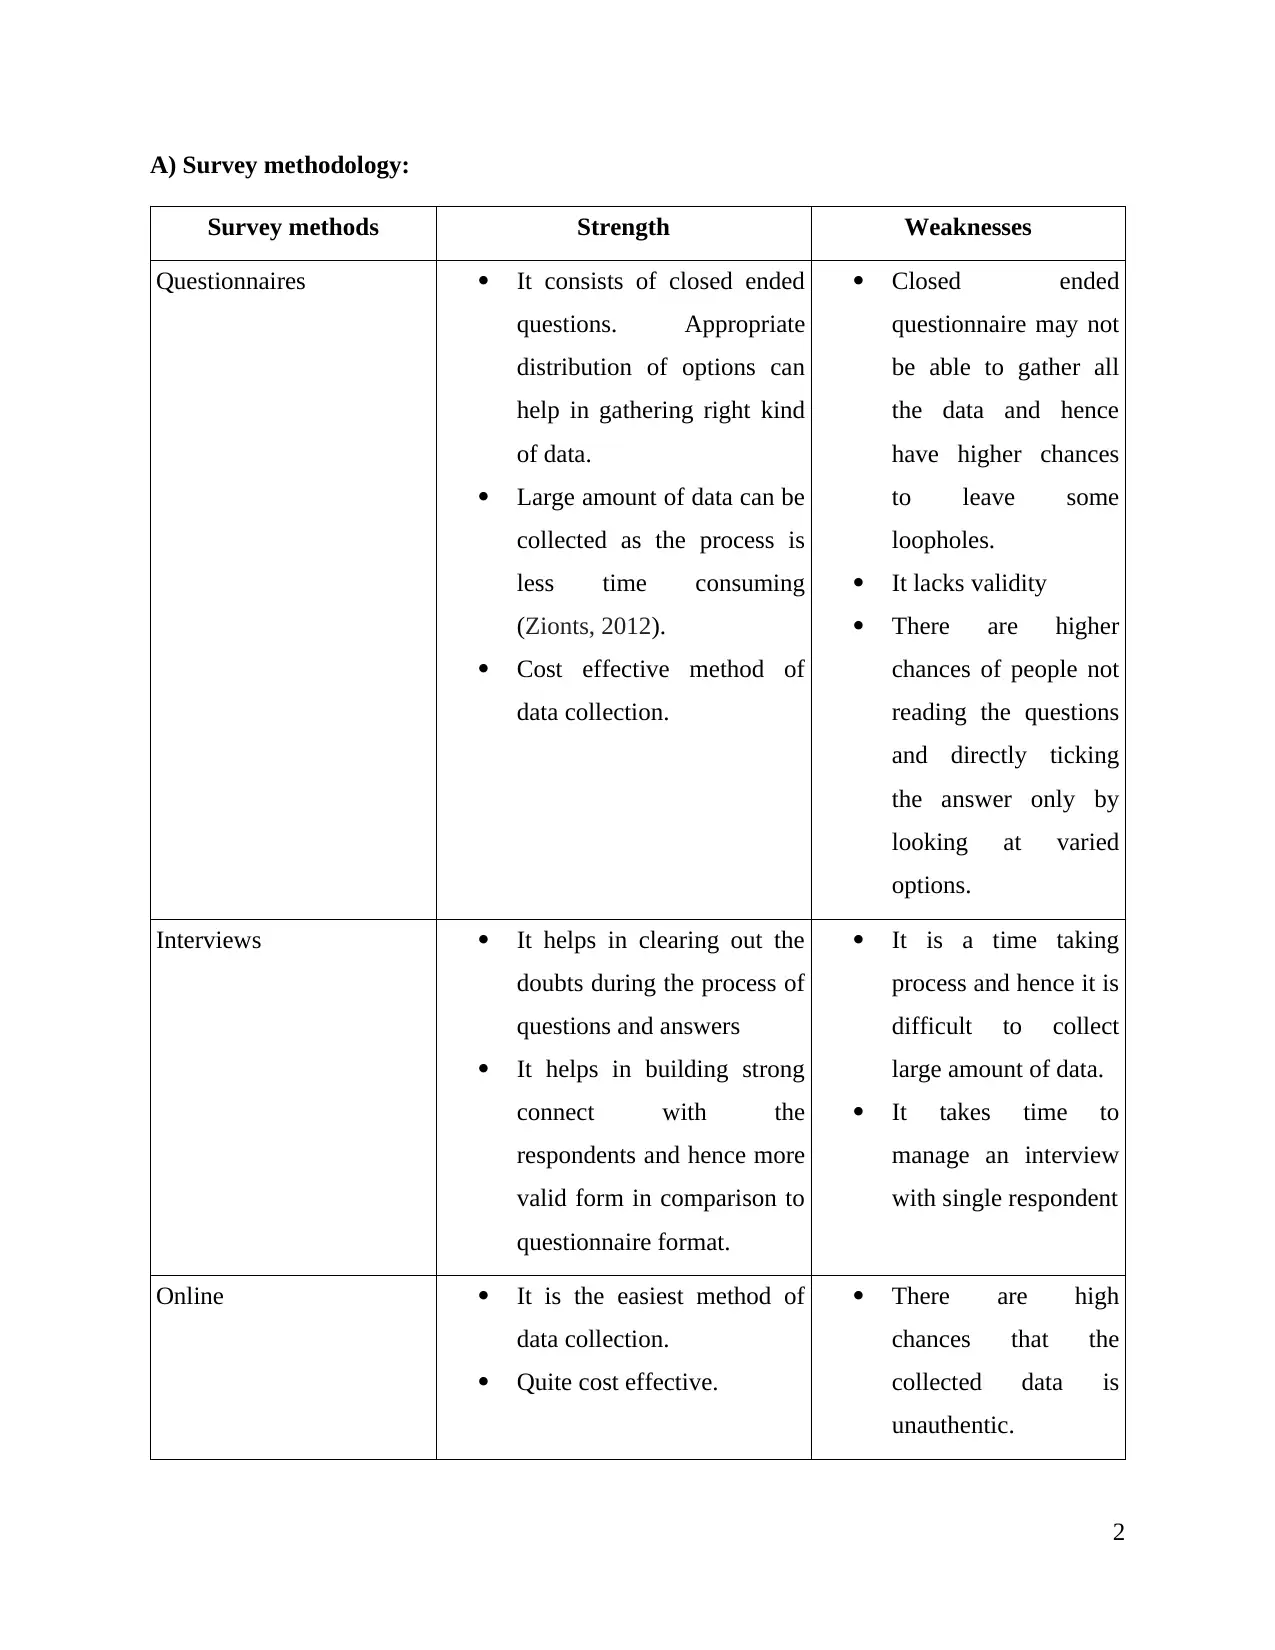
A) Survey methodology:
Survey methods Strength Weaknesses
Questionnaires It consists of closed ended
questions. Appropriate
distribution of options can
help in gathering right kind
of data.
Large amount of data can be
collected as the process is
less time consuming
(Zionts, 2012).
Cost effective method of
data collection.
Closed ended
questionnaire may not
be able to gather all
the data and hence
have higher chances
to leave some
loopholes.
It lacks validity
There are higher
chances of people not
reading the questions
and directly ticking
the answer only by
looking at varied
options.
Interviews It helps in clearing out the
doubts during the process of
questions and answers
It helps in building strong
connect with the
respondents and hence more
valid form in comparison to
questionnaire format.
It is a time taking
process and hence it is
difficult to collect
large amount of data.
It takes time to
manage an interview
with single respondent
Online It is the easiest method of
data collection.
Quite cost effective.
There are high
chances that the
collected data is
unauthentic.
2
Paraphrase This Document
Need a fresh take? Get an instant paraphrase of this document with our AI Paraphraser
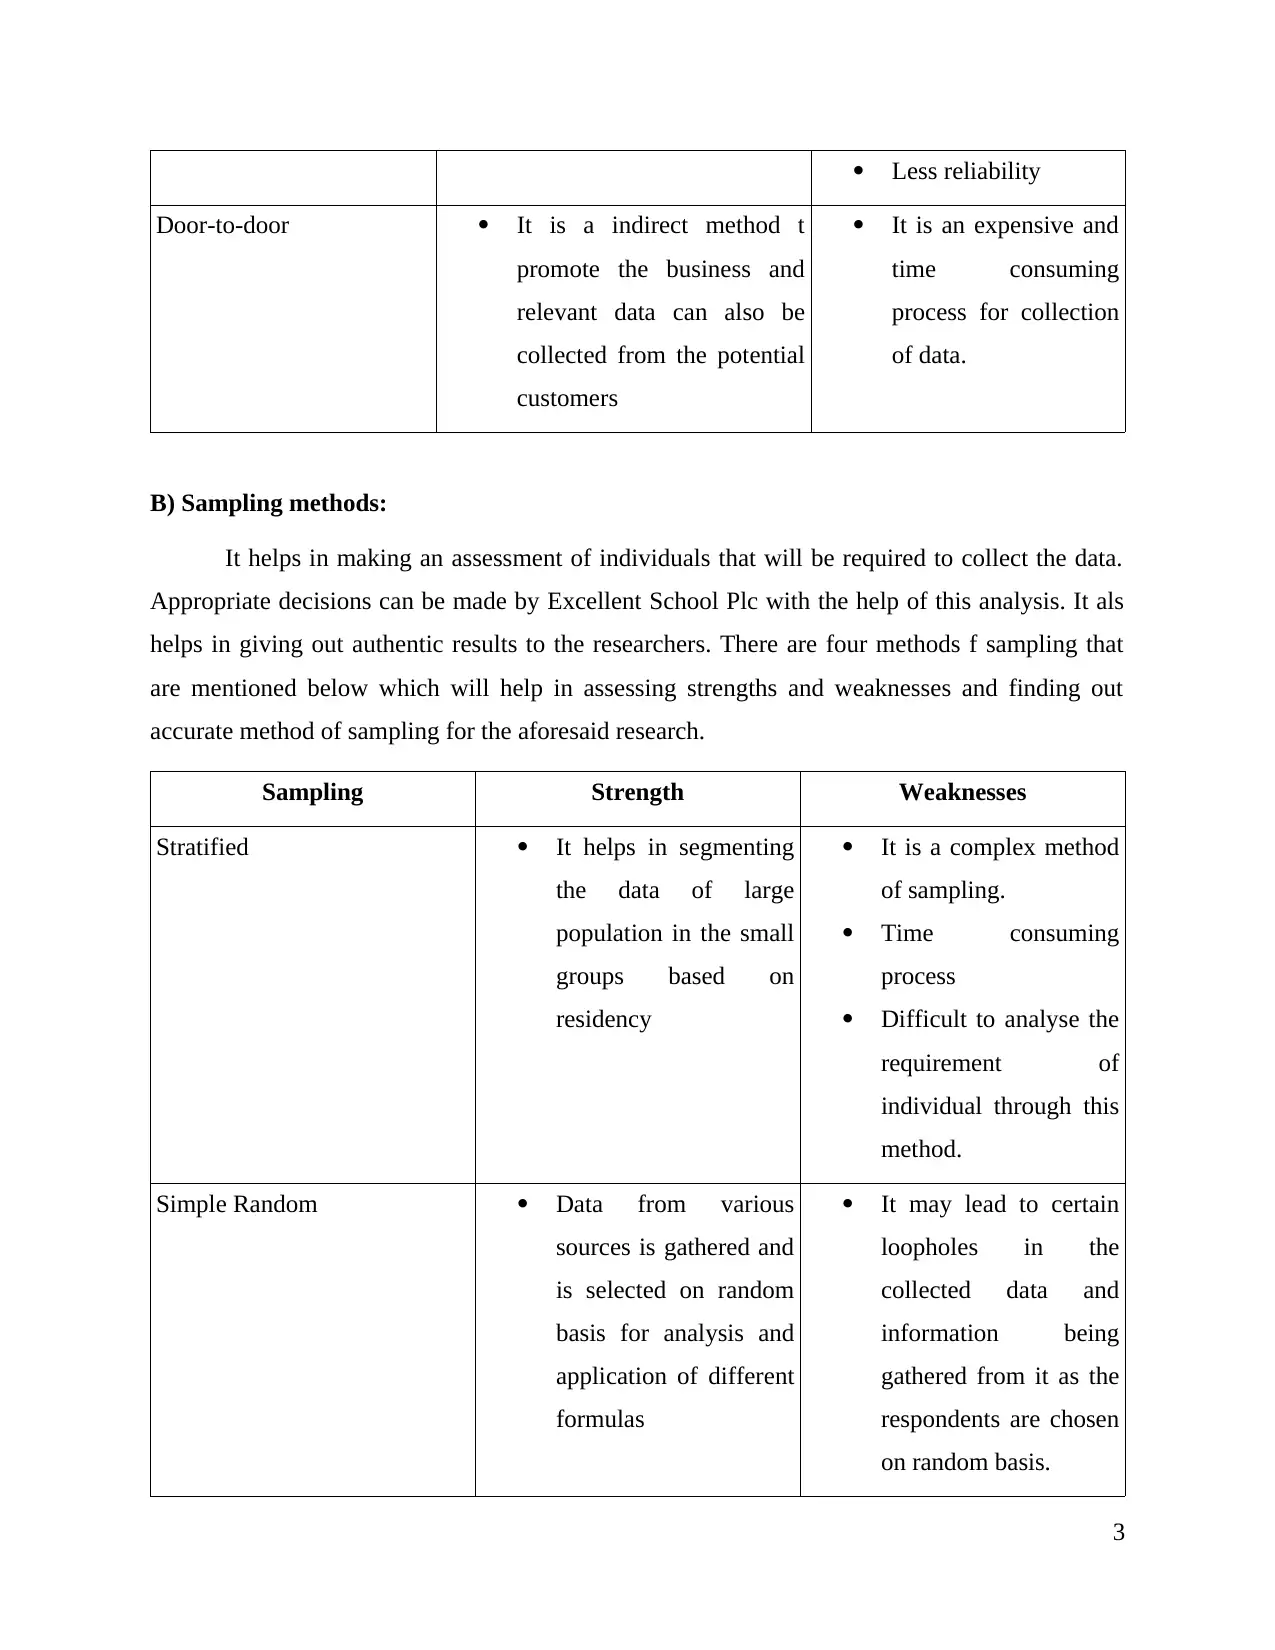
Less reliability
Door-to-door It is a indirect method t
promote the business and
relevant data can also be
collected from the potential
customers
It is an expensive and
time consuming
process for collection
of data.
B) Sampling methods:
It helps in making an assessment of individuals that will be required to collect the data.
Appropriate decisions can be made by Excellent School Plc with the help of this analysis. It als
helps in giving out authentic results to the researchers. There are four methods f sampling that
are mentioned below which will help in assessing strengths and weaknesses and finding out
accurate method of sampling for the aforesaid research.
Sampling Strength Weaknesses
Stratified It helps in segmenting
the data of large
population in the small
groups based on
residency
It is a complex method
of sampling.
Time consuming
process
Difficult to analyse the
requirement of
individual through this
method.
Simple Random Data from various
sources is gathered and
is selected on random
basis for analysis and
application of different
formulas
It may lead to certain
loopholes in the
collected data and
information being
gathered from it as the
respondents are chosen
on random basis.
3
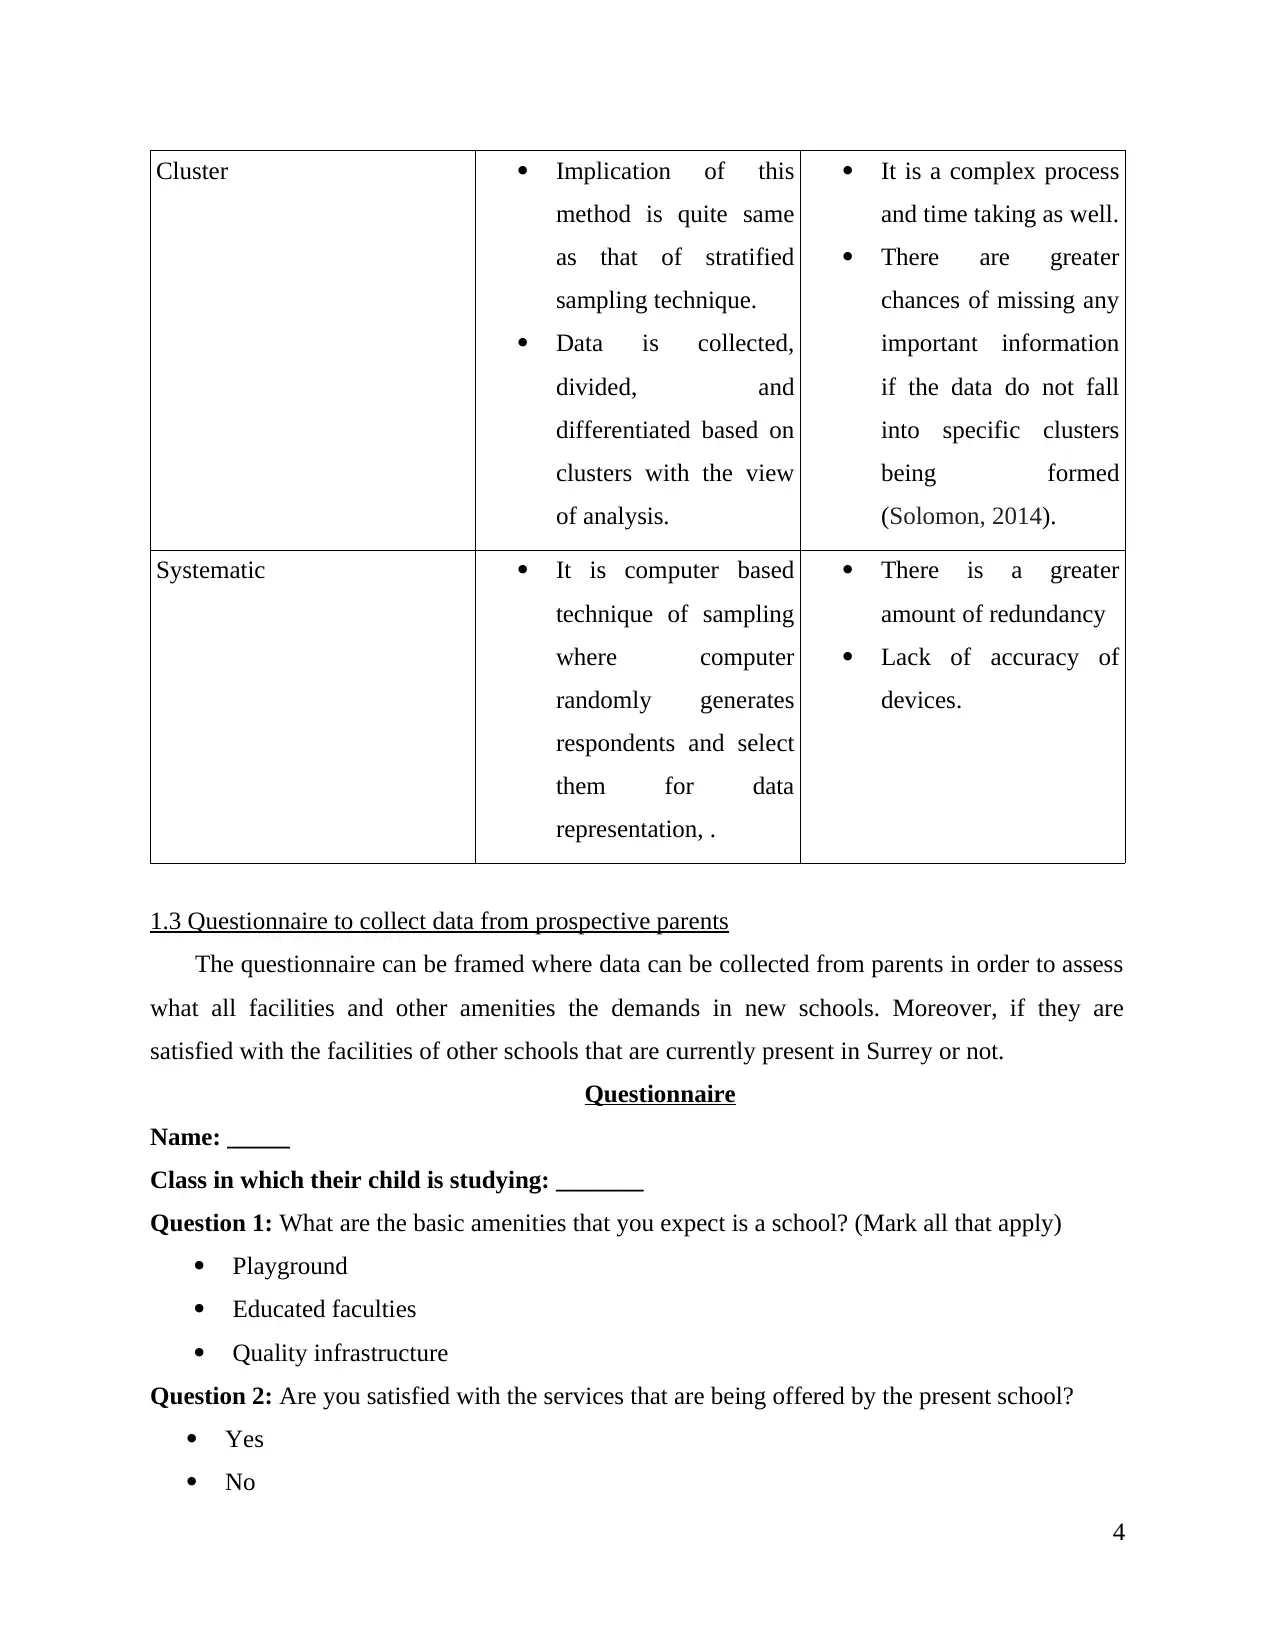
Cluster Implication of this
method is quite same
as that of stratified
sampling technique.
Data is collected,
divided, and
differentiated based on
clusters with the view
of analysis.
It is a complex process
and time taking as well.
There are greater
chances of missing any
important information
if the data do not fall
into specific clusters
being formed
(Solomon, 2014).
Systematic It is computer based
technique of sampling
where computer
randomly generates
respondents and select
them for data
representation, .
There is a greater
amount of redundancy
Lack of accuracy of
devices.
1.3 Questionnaire to collect data from prospective parents
The questionnaire can be framed where data can be collected from parents in order to assess
what all facilities and other amenities the demands in new schools. Moreover, if they are
satisfied with the facilities of other schools that are currently present in Surrey or not.
Questionnaire
Name: _____
Class in which their child is studying: _______
Question 1: What are the basic amenities that you expect is a school? (Mark all that apply)
Playground
Educated faculties
Quality infrastructure
Question 2: Are you satisfied with the services that are being offered by the present school?
Yes
No
4
⊘ This is a preview!⊘
Do you want full access?
Subscribe today to unlock all pages.
Trusted by 1+ million students worldwide
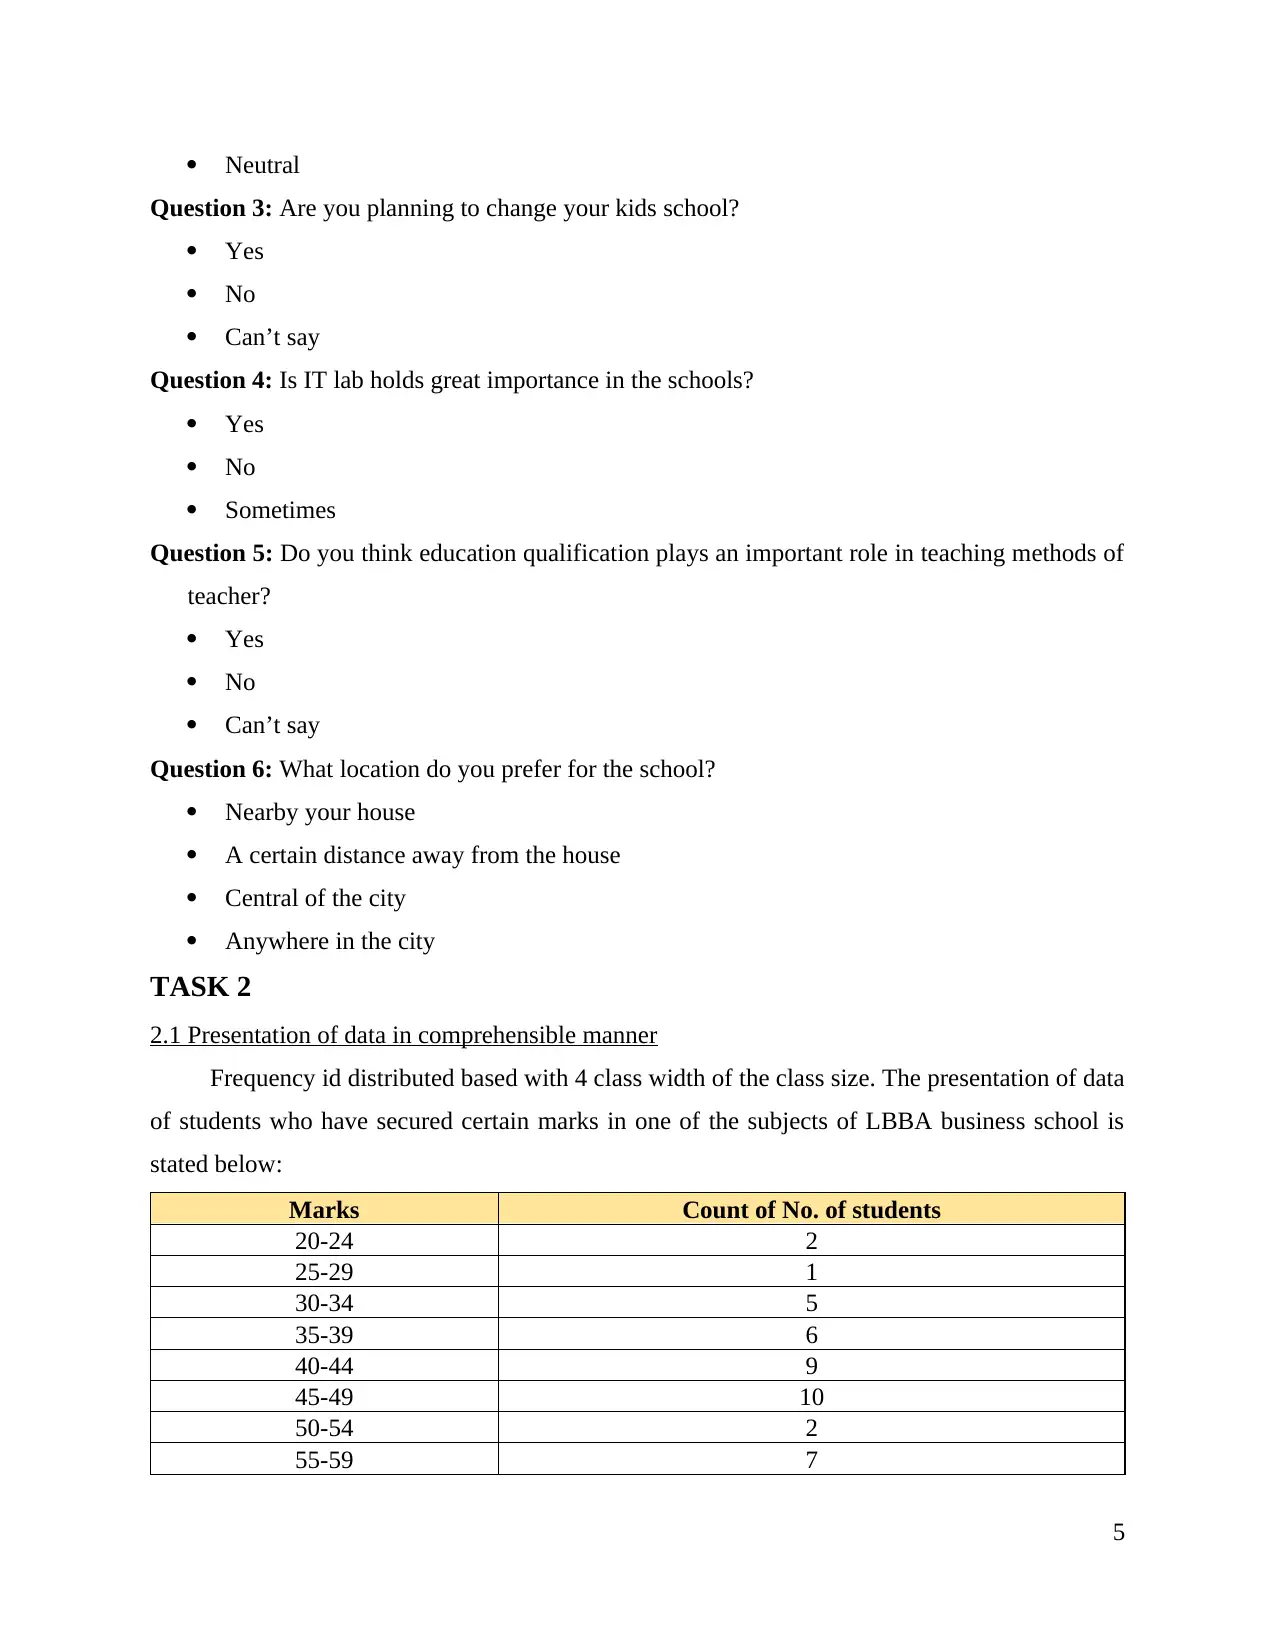
Neutral
Question 3: Are you planning to change your kids school?
Yes
No
Can’t say
Question 4: Is IT lab holds great importance in the schools?
Yes
No
Sometimes
Question 5: Do you think education qualification plays an important role in teaching methods of
teacher?
Yes
No
Can’t say
Question 6: What location do you prefer for the school?
Nearby your house
A certain distance away from the house
Central of the city
Anywhere in the city
TASK 2
2.1 Presentation of data in comprehensible manner
Frequency id distributed based with 4 class width of the class size. The presentation of data
of students who have secured certain marks in one of the subjects of LBBA business school is
stated below:
Marks Count of No. of students
20-24 2
25-29 1
30-34 5
35-39 6
40-44 9
45-49 10
50-54 2
55-59 7
5
Paraphrase This Document
Need a fresh take? Get an instant paraphrase of this document with our AI Paraphraser
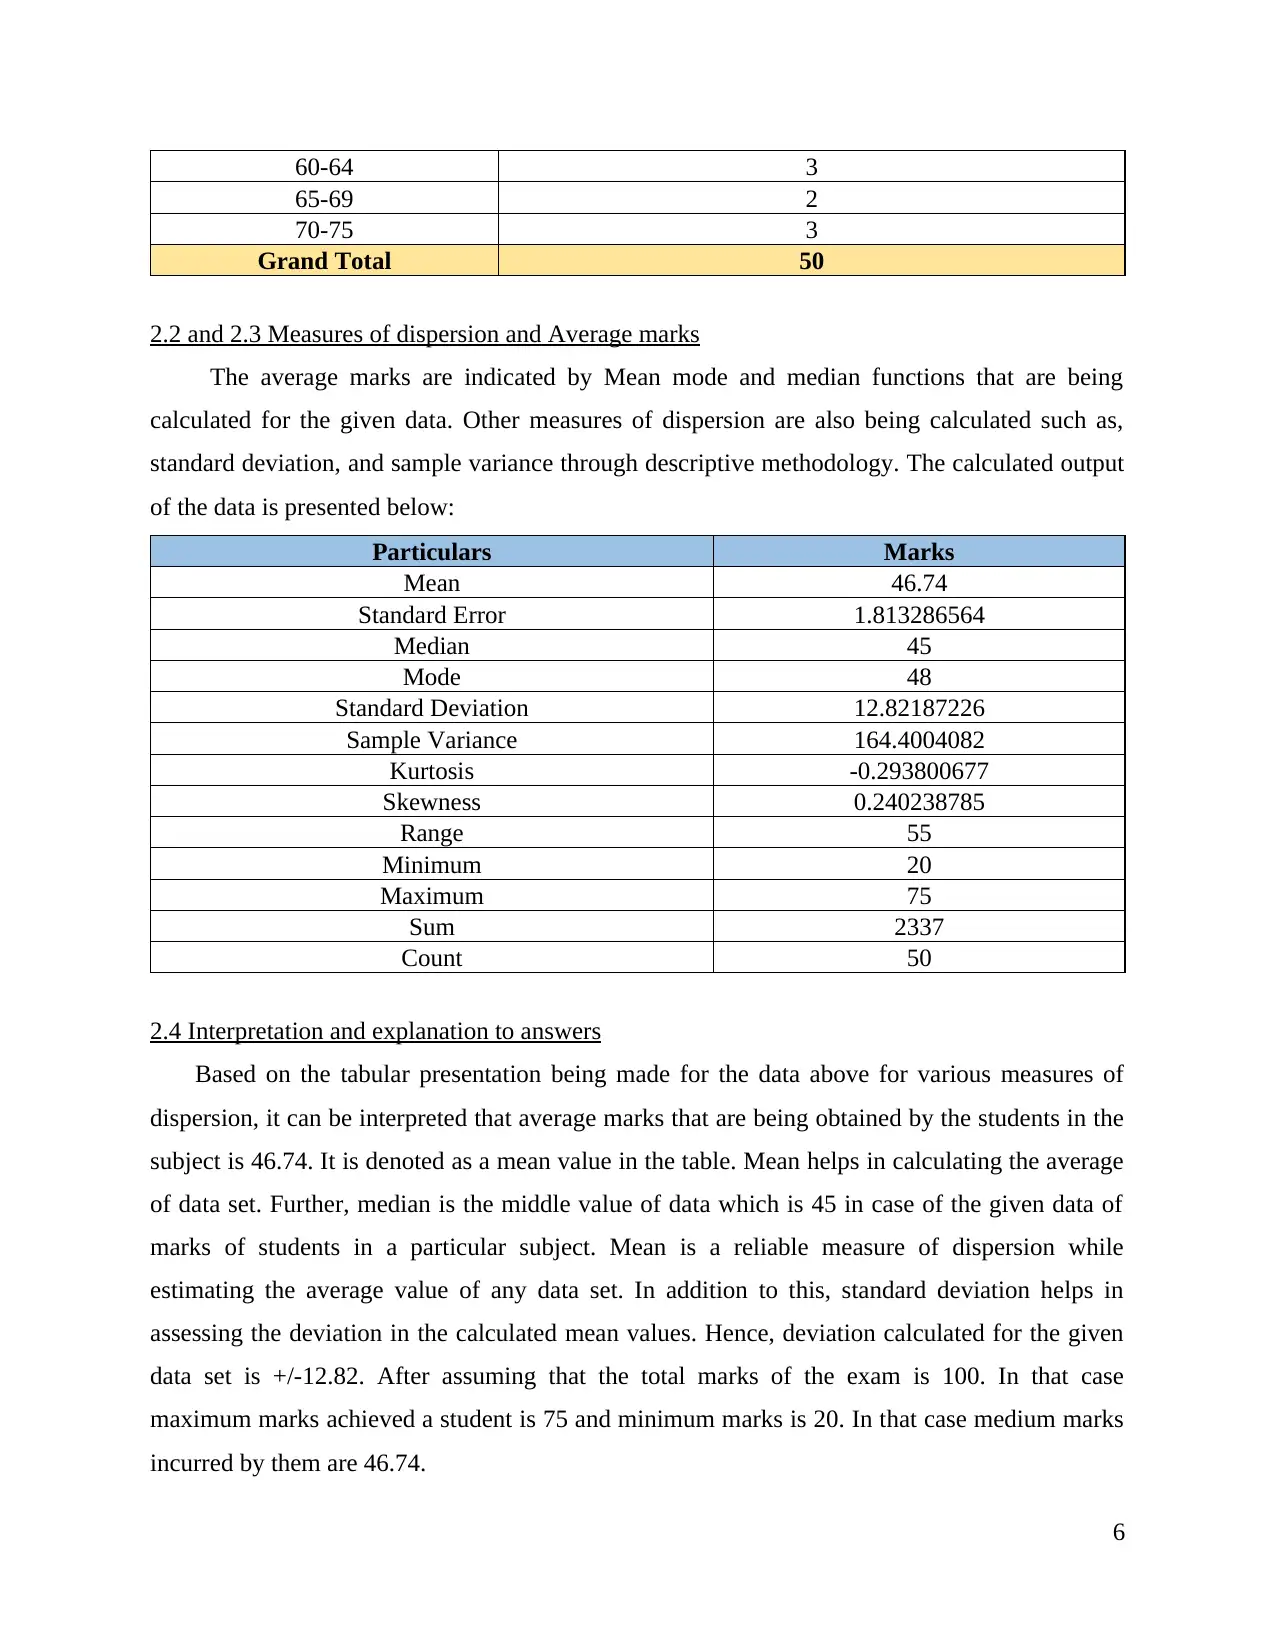
60-64 3
65-69 2
70-75 3
Grand Total 50
2.2 and 2.3 Measures of dispersion and Average marks
The average marks are indicated by Mean mode and median functions that are being
calculated for the given data. Other measures of dispersion are also being calculated such as,
standard deviation, and sample variance through descriptive methodology. The calculated output
of the data is presented below:
Particulars Marks
Mean 46.74
Standard Error 1.813286564
Median 45
Mode 48
Standard Deviation 12.82187226
Sample Variance 164.4004082
Kurtosis -0.293800677
Skewness 0.240238785
Range 55
Minimum 20
Maximum 75
Sum 2337
Count 50
2.4 Interpretation and explanation to answers
Based on the tabular presentation being made for the data above for various measures of
dispersion, it can be interpreted that average marks that are being obtained by the students in the
subject is 46.74. It is denoted as a mean value in the table. Mean helps in calculating the average
of data set. Further, median is the middle value of data which is 45 in case of the given data of
marks of students in a particular subject. Mean is a reliable measure of dispersion while
estimating the average value of any data set. In addition to this, standard deviation helps in
assessing the deviation in the calculated mean values. Hence, deviation calculated for the given
data set is +/-12.82. After assuming that the total marks of the exam is 100. In that case
maximum marks achieved a student is 75 and minimum marks is 20. In that case medium marks
incurred by them are 46.74.
6
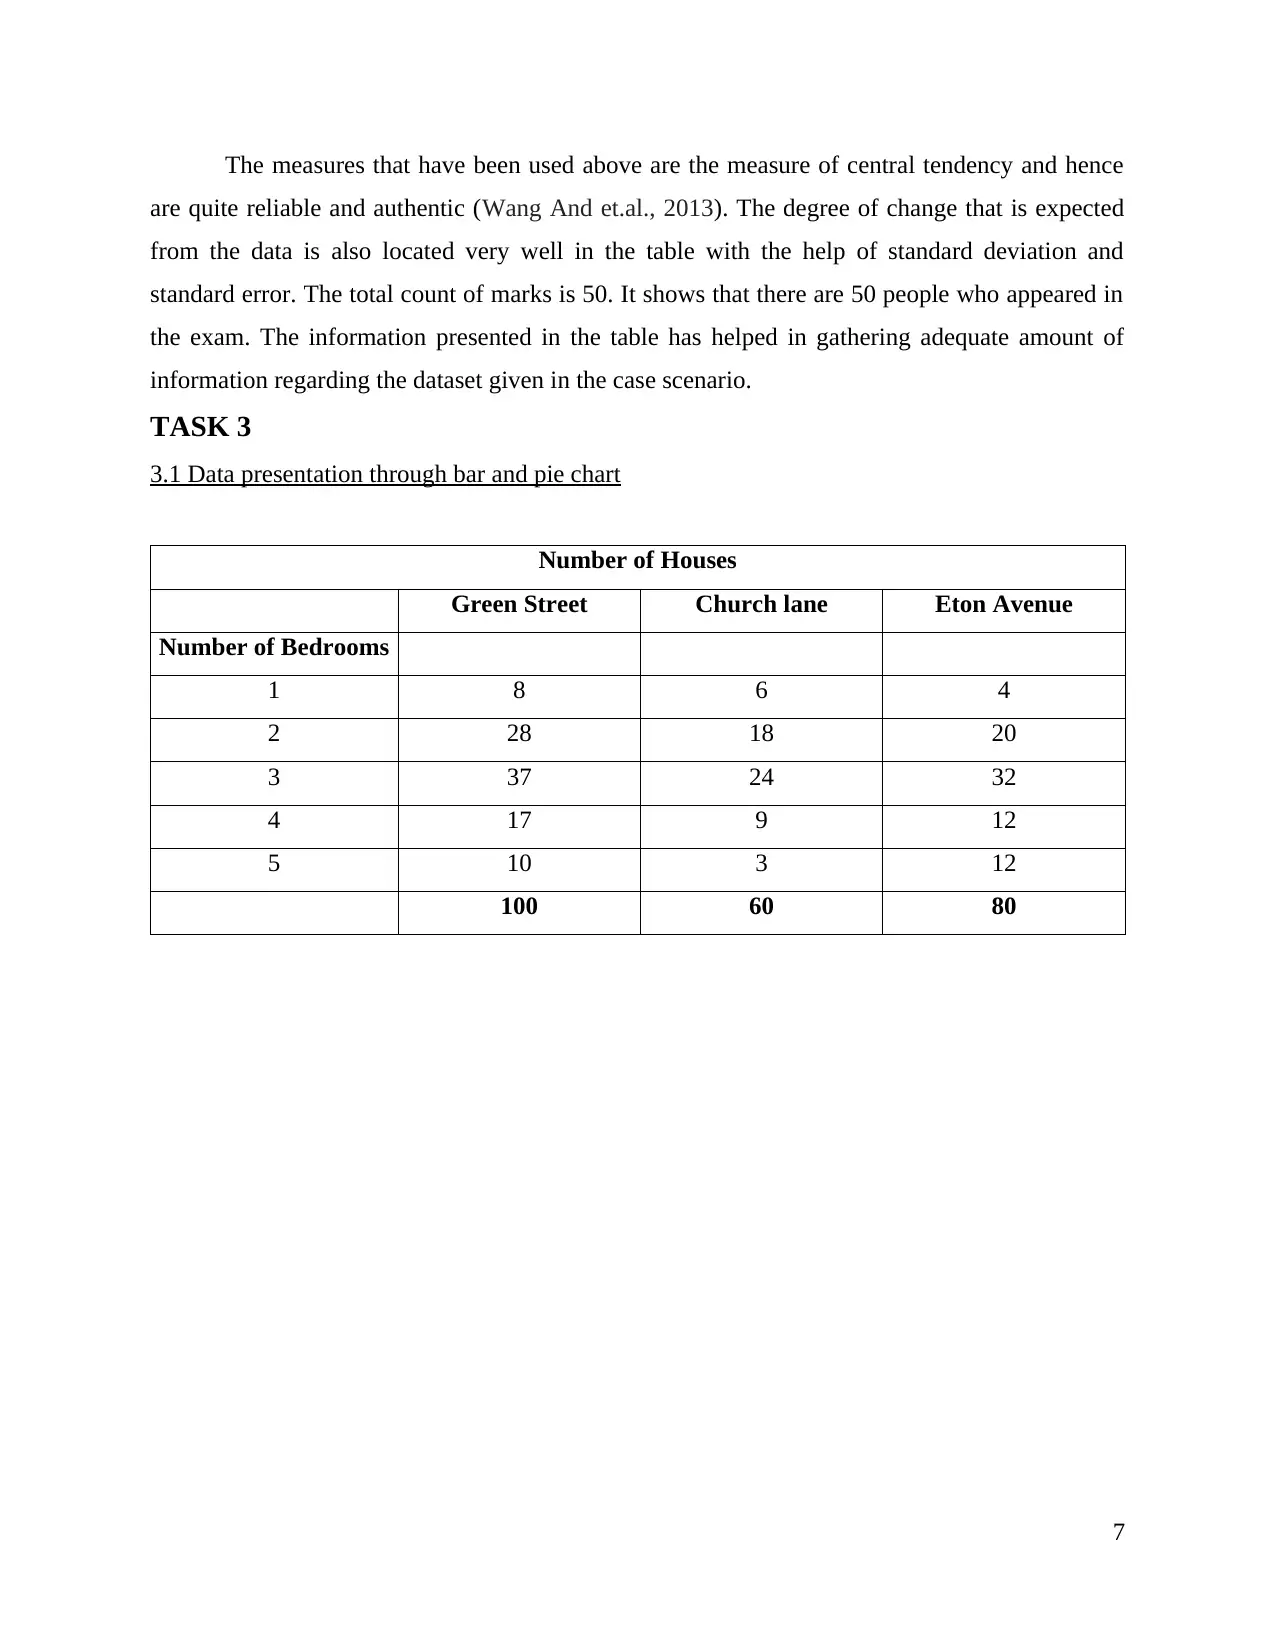
The measures that have been used above are the measure of central tendency and hence
are quite reliable and authentic (Wang And et.al., 2013). The degree of change that is expected
from the data is also located very well in the table with the help of standard deviation and
standard error. The total count of marks is 50. It shows that there are 50 people who appeared in
the exam. The information presented in the table has helped in gathering adequate amount of
information regarding the dataset given in the case scenario.
TASK 3
3.1 Data presentation through bar and pie chart
Number of Houses
Green Street Church lane Eton Avenue
Number of Bedrooms
1 8 6 4
2 28 18 20
3 37 24 32
4 17 9 12
5 10 3 12
100 60 80
7
⊘ This is a preview!⊘
Do you want full access?
Subscribe today to unlock all pages.
Trusted by 1+ million students worldwide
Number of
Bedrooms 1 2 3 4 5
0
5
10
15
20
25
30
35
40
Green Street
Church lane
Eton Avenue
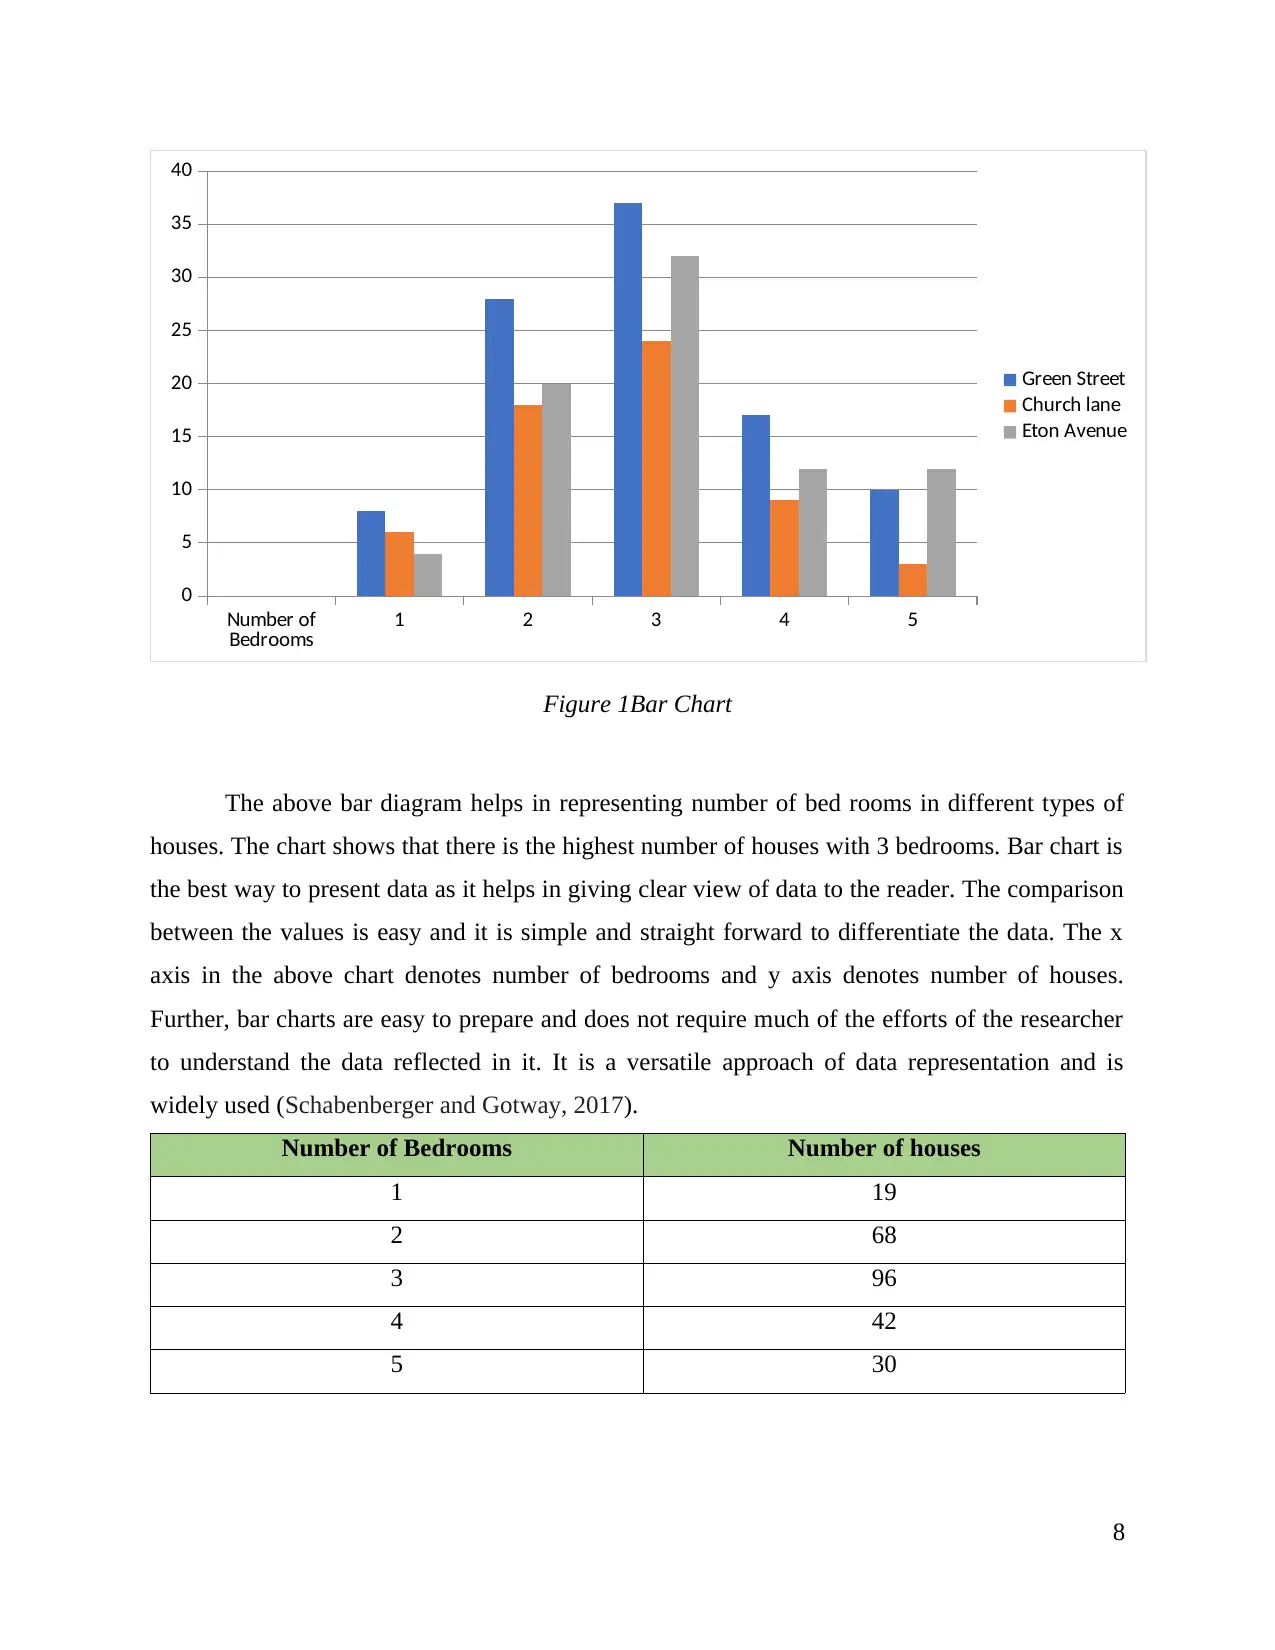
Figure 1Bar Chart
The above bar diagram helps in representing number of bed rooms in different types of
houses. The chart shows that there is the highest number of houses with 3 bedrooms. Bar chart is
the best way to present data as it helps in giving clear view of data to the reader. The comparison
between the values is easy and it is simple and straight forward to differentiate the data. The x
axis in the above chart denotes number of bedrooms and y axis denotes number of houses.
Further, bar charts are easy to prepare and does not require much of the efforts of the researcher
to understand the data reflected in it. It is a versatile approach of data representation and is
widely used (Schabenberger and Gotway, 2017).
Number of Bedrooms Number of houses
1 19
2 68
3 96
4 42
5 30
8
Bedrooms 1 2 3 4 5
0
5
10
15
20
25
30
35
40
Green Street
Church lane
Eton Avenue
Figure 1Bar Chart
The above bar diagram helps in representing number of bed rooms in different types of
houses. The chart shows that there is the highest number of houses with 3 bedrooms. Bar chart is
the best way to present data as it helps in giving clear view of data to the reader. The comparison
between the values is easy and it is simple and straight forward to differentiate the data. The x
axis in the above chart denotes number of bedrooms and y axis denotes number of houses.
Further, bar charts are easy to prepare and does not require much of the efforts of the researcher
to understand the data reflected in it. It is a versatile approach of data representation and is
widely used (Schabenberger and Gotway, 2017).
Number of Bedrooms Number of houses
1 19
2 68
3 96
4 42
5 30
8
Paraphrase This Document
Need a fresh take? Get an instant paraphrase of this document with our AI Paraphraser
Number of Bedrooms
1
2
3
4
5
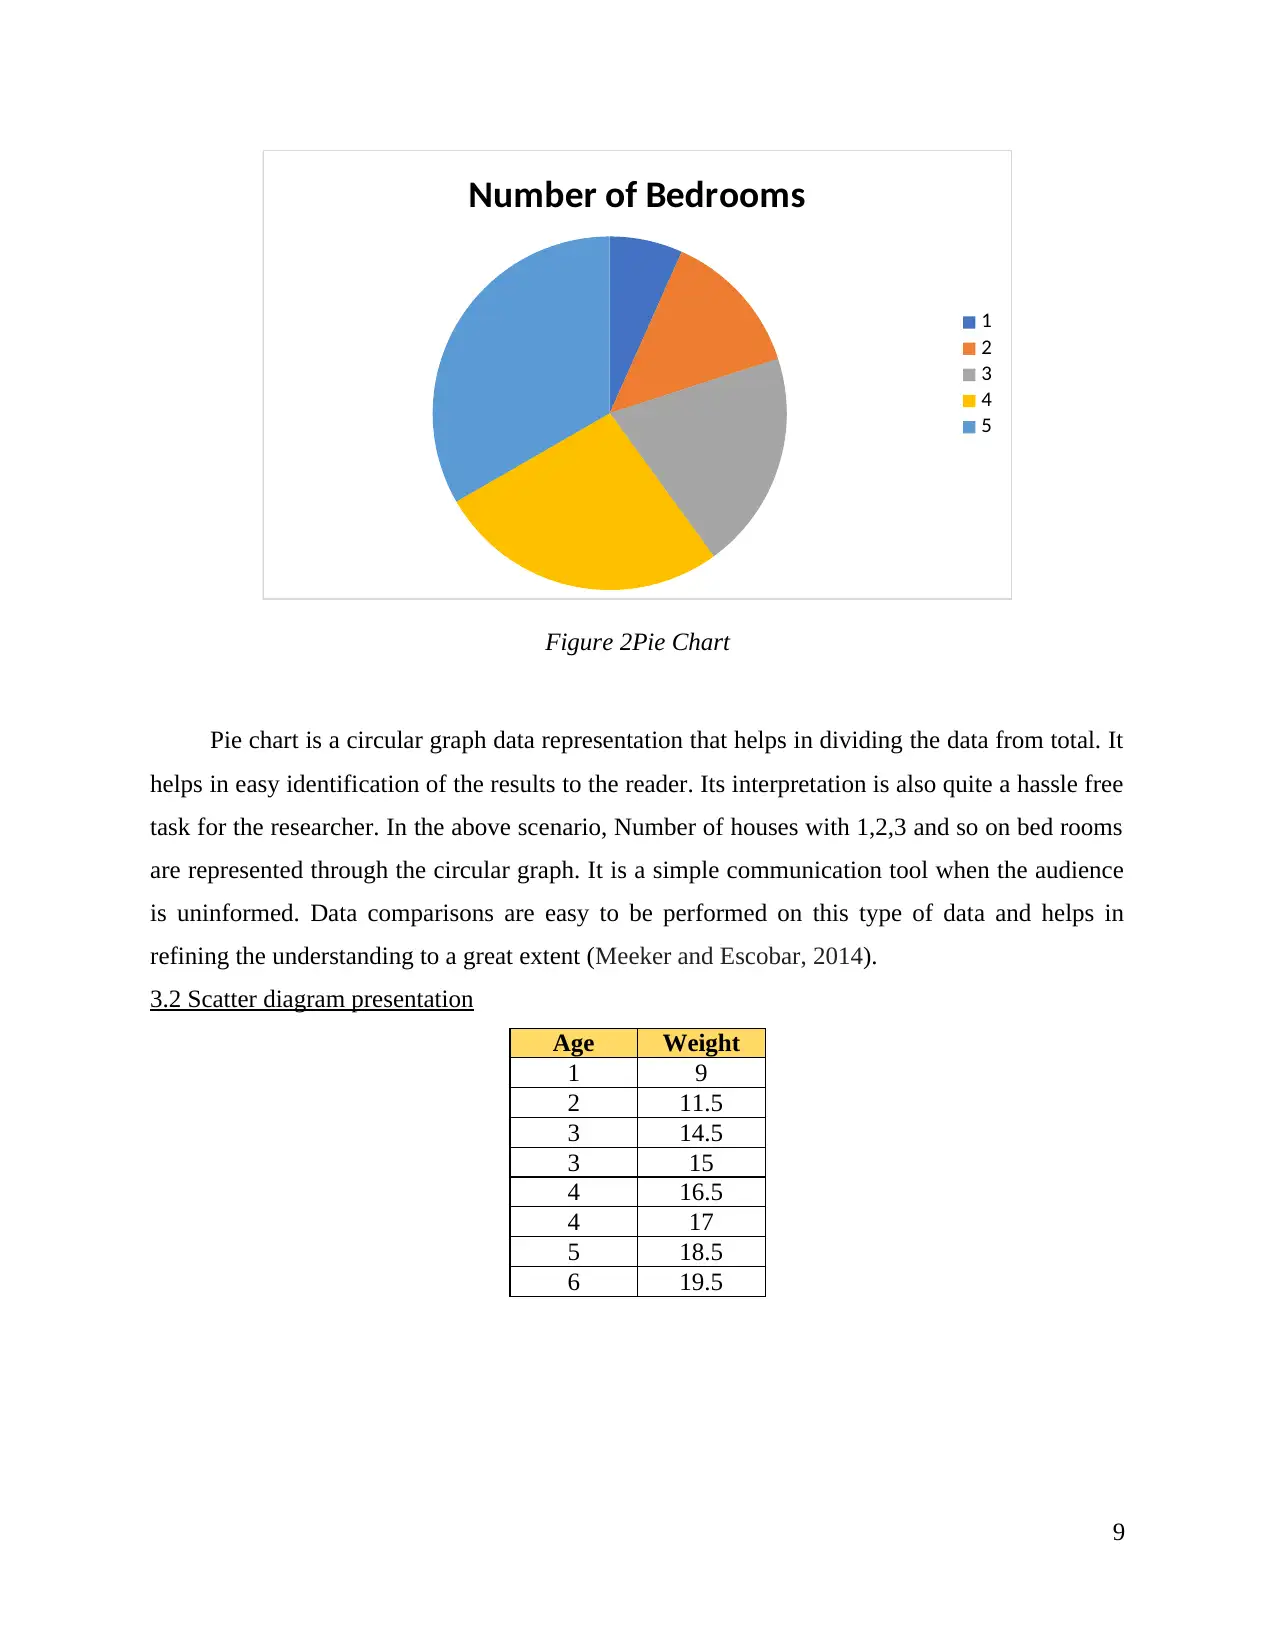
Figure 2Pie Chart
Pie chart is a circular graph data representation that helps in dividing the data from total. It
helps in easy identification of the results to the reader. Its interpretation is also quite a hassle free
task for the researcher. In the above scenario, Number of houses with 1,2,3 and so on bed rooms
are represented through the circular graph. It is a simple communication tool when the audience
is uninformed. Data comparisons are easy to be performed on this type of data and helps in
refining the understanding to a great extent (Meeker and Escobar, 2014).
3.2 Scatter diagram presentation
Age Weight
1 9
2 11.5
3 14.5
3 15
4 16.5
4 17
5 18.5
6 19.5
9
1
2
3
4
5
Figure 2Pie Chart
Pie chart is a circular graph data representation that helps in dividing the data from total. It
helps in easy identification of the results to the reader. Its interpretation is also quite a hassle free
task for the researcher. In the above scenario, Number of houses with 1,2,3 and so on bed rooms
are represented through the circular graph. It is a simple communication tool when the audience
is uninformed. Data comparisons are easy to be performed on this type of data and helps in
refining the understanding to a great extent (Meeker and Escobar, 2014).
3.2 Scatter diagram presentation
Age Weight
1 9
2 11.5
3 14.5
3 15
4 16.5
4 17
5 18.5
6 19.5
9
0 1 2 3 4 5 6 7
0
5
10
15
20
25
Weight
Weight
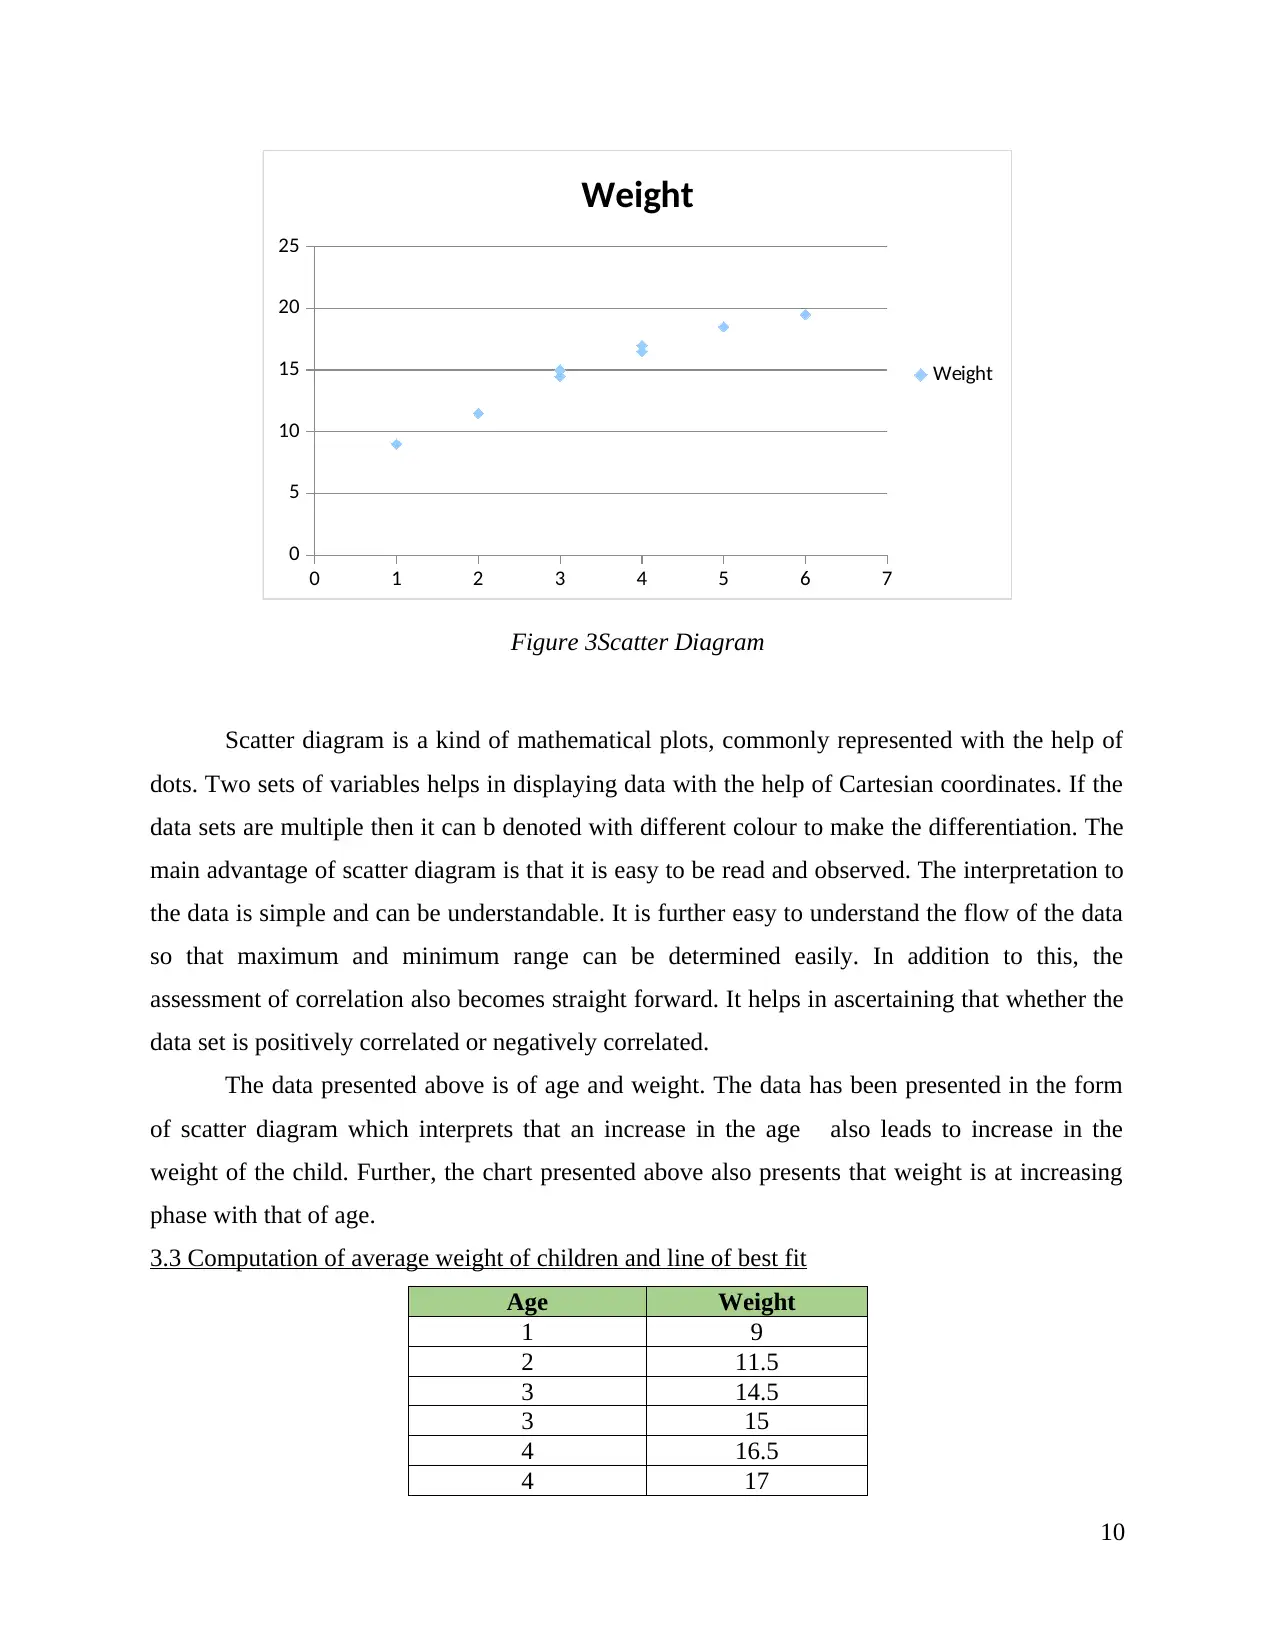
Figure 3Scatter Diagram
Scatter diagram is a kind of mathematical plots, commonly represented with the help of
dots. Two sets of variables helps in displaying data with the help of Cartesian coordinates. If the
data sets are multiple then it can b denoted with different colour to make the differentiation. The
main advantage of scatter diagram is that it is easy to be read and observed. The interpretation to
the data is simple and can be understandable. It is further easy to understand the flow of the data
so that maximum and minimum range can be determined easily. In addition to this, the
assessment of correlation also becomes straight forward. It helps in ascertaining that whether the
data set is positively correlated or negatively correlated.
The data presented above is of age and weight. The data has been presented in the form
of scatter diagram which interprets that an increase in the age also leads to increase in the
weight of the child. Further, the chart presented above also presents that weight is at increasing
phase with that of age.
3.3 Computation of average weight of children and line of best fit
Age Weight
1 9
2 11.5
3 14.5
3 15
4 16.5
4 17
10
0
5
10
15
20
25
Weight
Weight
Figure 3Scatter Diagram
Scatter diagram is a kind of mathematical plots, commonly represented with the help of
dots. Two sets of variables helps in displaying data with the help of Cartesian coordinates. If the
data sets are multiple then it can b denoted with different colour to make the differentiation. The
main advantage of scatter diagram is that it is easy to be read and observed. The interpretation to
the data is simple and can be understandable. It is further easy to understand the flow of the data
so that maximum and minimum range can be determined easily. In addition to this, the
assessment of correlation also becomes straight forward. It helps in ascertaining that whether the
data set is positively correlated or negatively correlated.
The data presented above is of age and weight. The data has been presented in the form
of scatter diagram which interprets that an increase in the age also leads to increase in the
weight of the child. Further, the chart presented above also presents that weight is at increasing
phase with that of age.
3.3 Computation of average weight of children and line of best fit
Age Weight
1 9
2 11.5
3 14.5
3 15
4 16.5
4 17
10
⊘ This is a preview!⊘
Do you want full access?
Subscribe today to unlock all pages.
Trusted by 1+ million students worldwide
1 out of 19
Related Documents


Your All-in-One AI-Powered Toolkit for Academic Success.
+13062052269
info@desklib.com
Available 24*7 on WhatsApp / Email
![[object Object]](/_next/static/media/star-bottom.7253800d.svg)
Unlock your academic potential
Copyright © 2020–2026 A2Z Services. All Rights Reserved. Developed and managed by ZUCOL.