HND Business: Statistics for Management Assignment 1 Analysis Report
VerifiedAdded on 2023/02/06
|14
|3156
|27
Report
AI Summary
This assignment report, prepared for a BTEC Level 5 HND Diploma in Business, Unit 42 (Statistics for Management), explores the nature and process of business and economic data. It defines data, information, and knowledge, examining how data transforms into information and knowledge from various sources. The report details data collection methods and transformation processes, including descriptive, exploratory, diagnostic, and confirmatory analytics. It evaluates data from diverse sources using different analytical methods, providing pros and cons for each technique. The analysis incorporates examples and theoretical frameworks to illustrate the application of statistical methods in management decision-making, offering a comprehensive overview of data analysis and its practical implications in a business context.
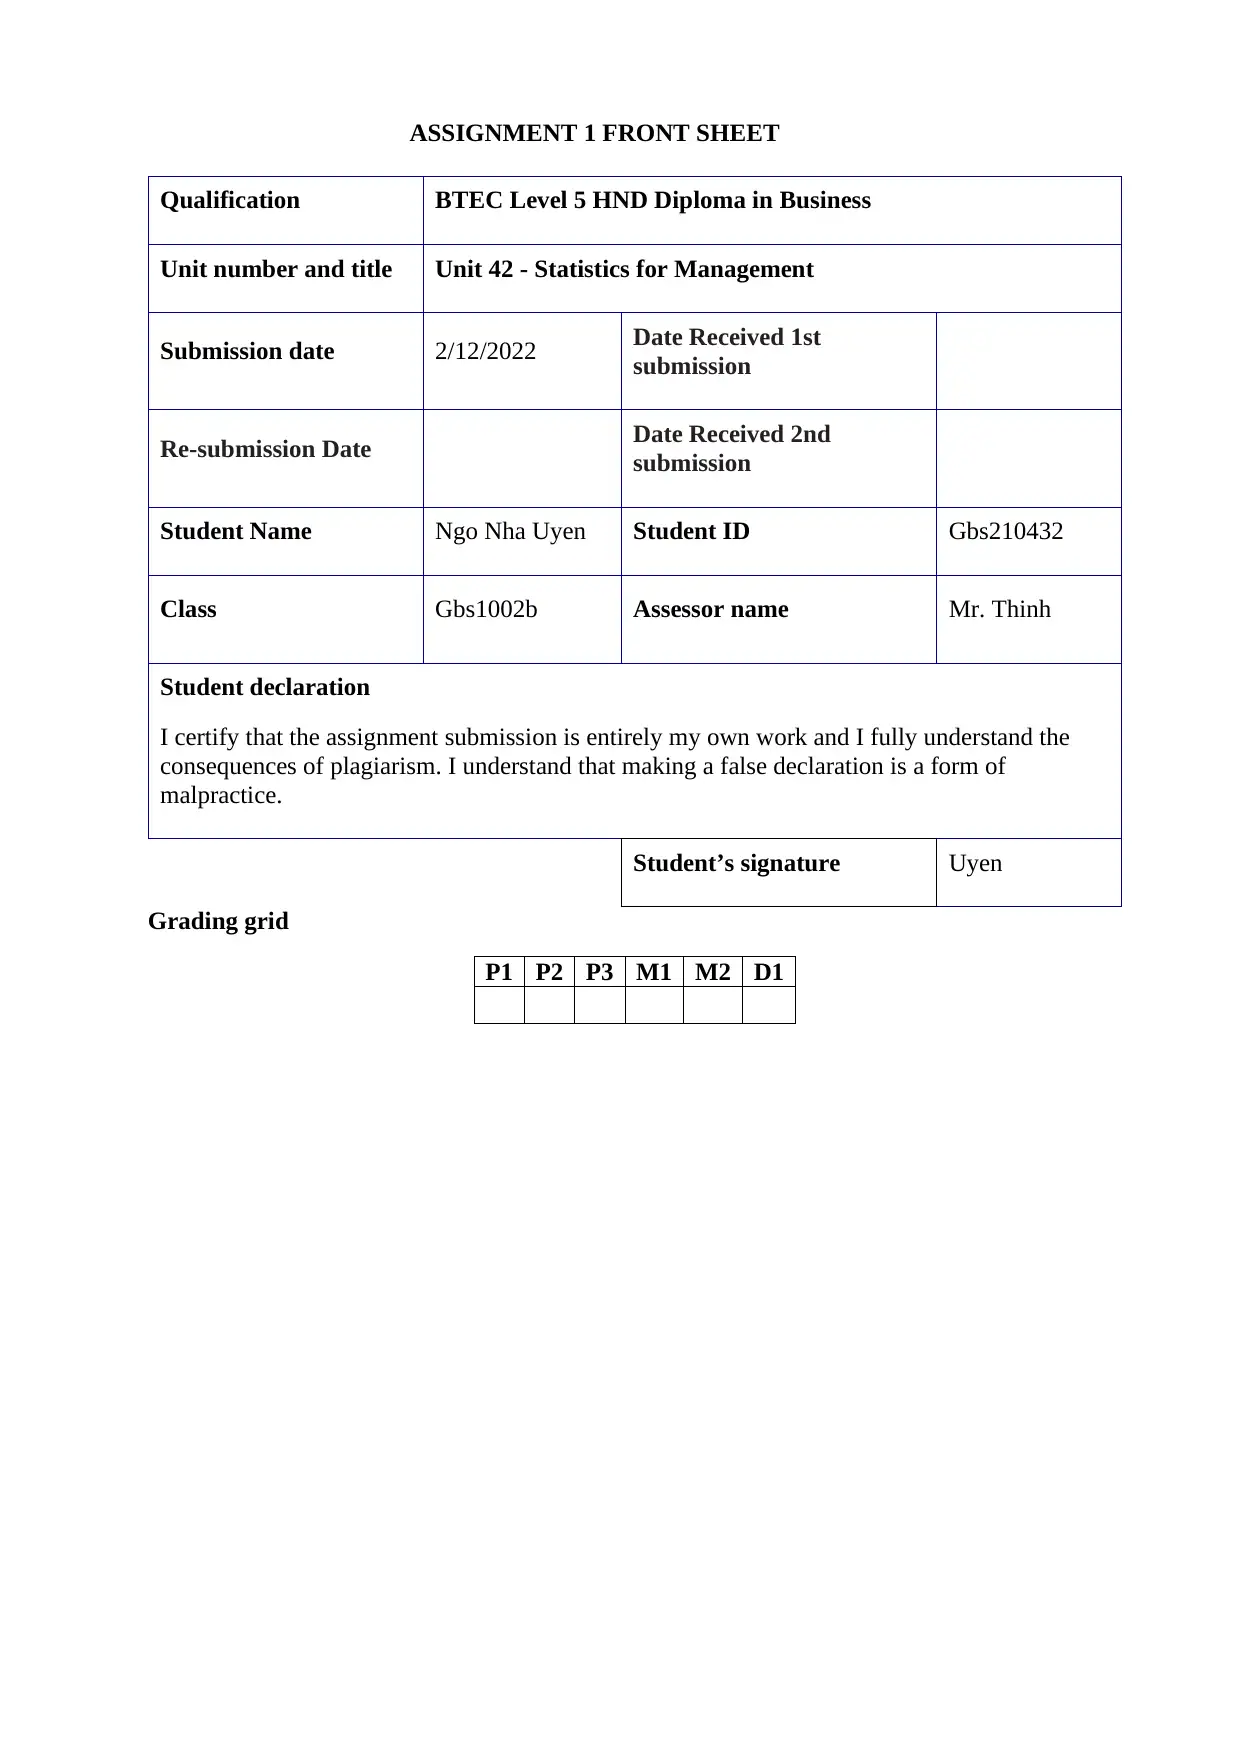
ASSIGNMENT 1 FRONT SHEET
Qualification BTEC Level 5 HND Diploma in Business
Unit number and title Unit 42 - Statistics for Management
Submission date 2/12/2022 Date Received 1st
submission
Re-submission Date Date Received 2nd
submission
Student Name Ngo Nha Uyen Student ID Gbs210432
Class Gbs1002b Assessor name Mr. Thinh
Student declaration
I certify that the assignment submission is entirely my own work and I fully understand the
consequences of plagiarism. I understand that making a false declaration is a form of
malpractice.
Student’s signature Uyen
Grading grid
P1 P2 P3 M1 M2 D1
Paraphrase This Document
Need a fresh take? Get an instant paraphrase of this document with our AI Paraphraser
❒ Summative Feedback: ❒ Resubmission
Feedback:
Grade: Assessor Signature: Date:
Internal Verifier’s Comments:
Signature & Date:
Feedback:
Grade: Assessor Signature: Date:
Internal Verifier’s Comments:
Signature & Date:
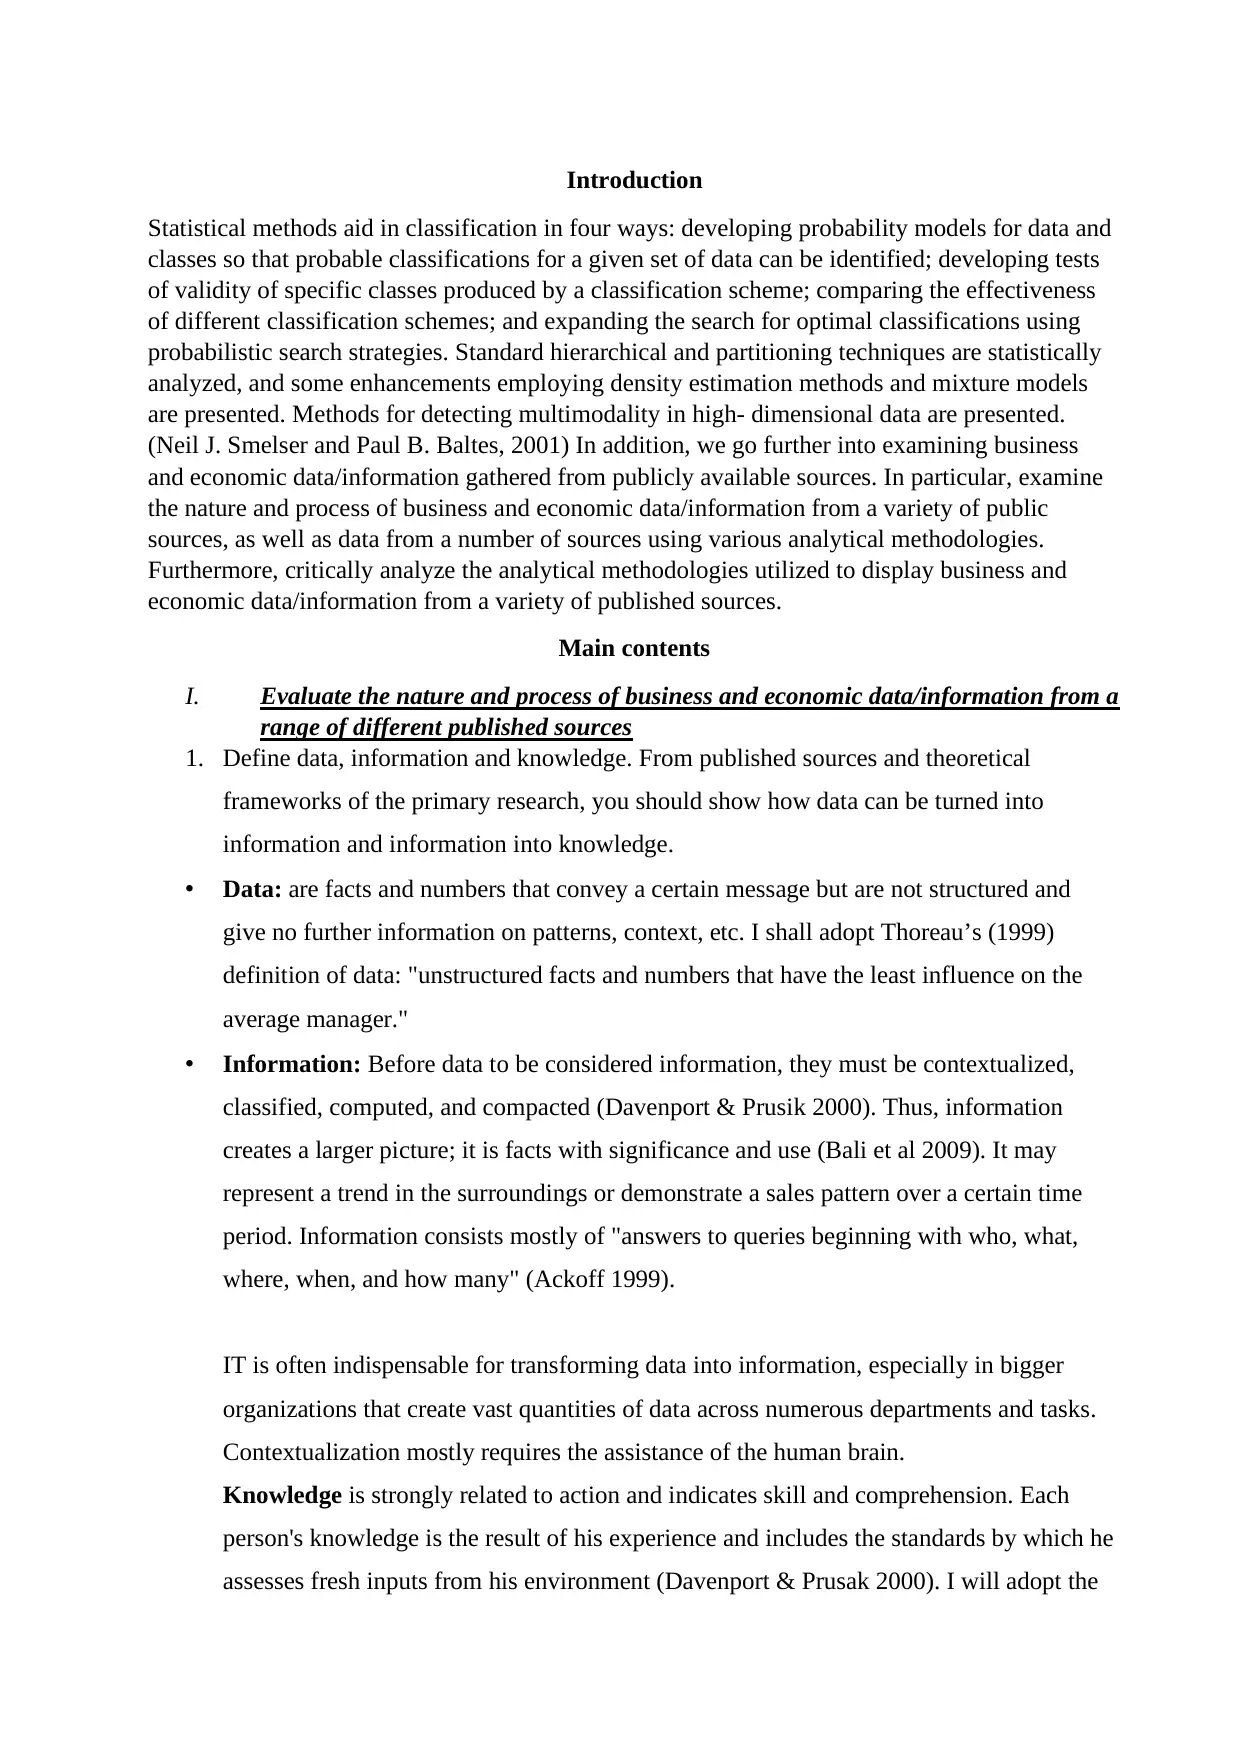
Introduction
Statistical methods aid in classification in four ways: developing probability models for data and
classes so that probable classifications for a given set of data can be identified; developing tests
of validity of specific classes produced by a classification scheme; comparing the effectiveness
of different classification schemes; and expanding the search for optimal classifications using
probabilistic search strategies. Standard hierarchical and partitioning techniques are statistically
analyzed, and some enhancements employing density estimation methods and mixture models
are presented. Methods for detecting multimodality in high- dimensional data are presented.
(Neil J. Smelser and Paul B. Baltes, 2001) In addition, we go further into examining business
and economic data/information gathered from publicly available sources. In particular, examine
the nature and process of business and economic data/information from a variety of public
sources, as well as data from a number of sources using various analytical methodologies.
Furthermore, critically analyze the analytical methodologies utilized to display business and
economic data/information from a variety of published sources.
Main contents
I. Evaluate the nature and process of business and economic data/information from a
range of different published sources
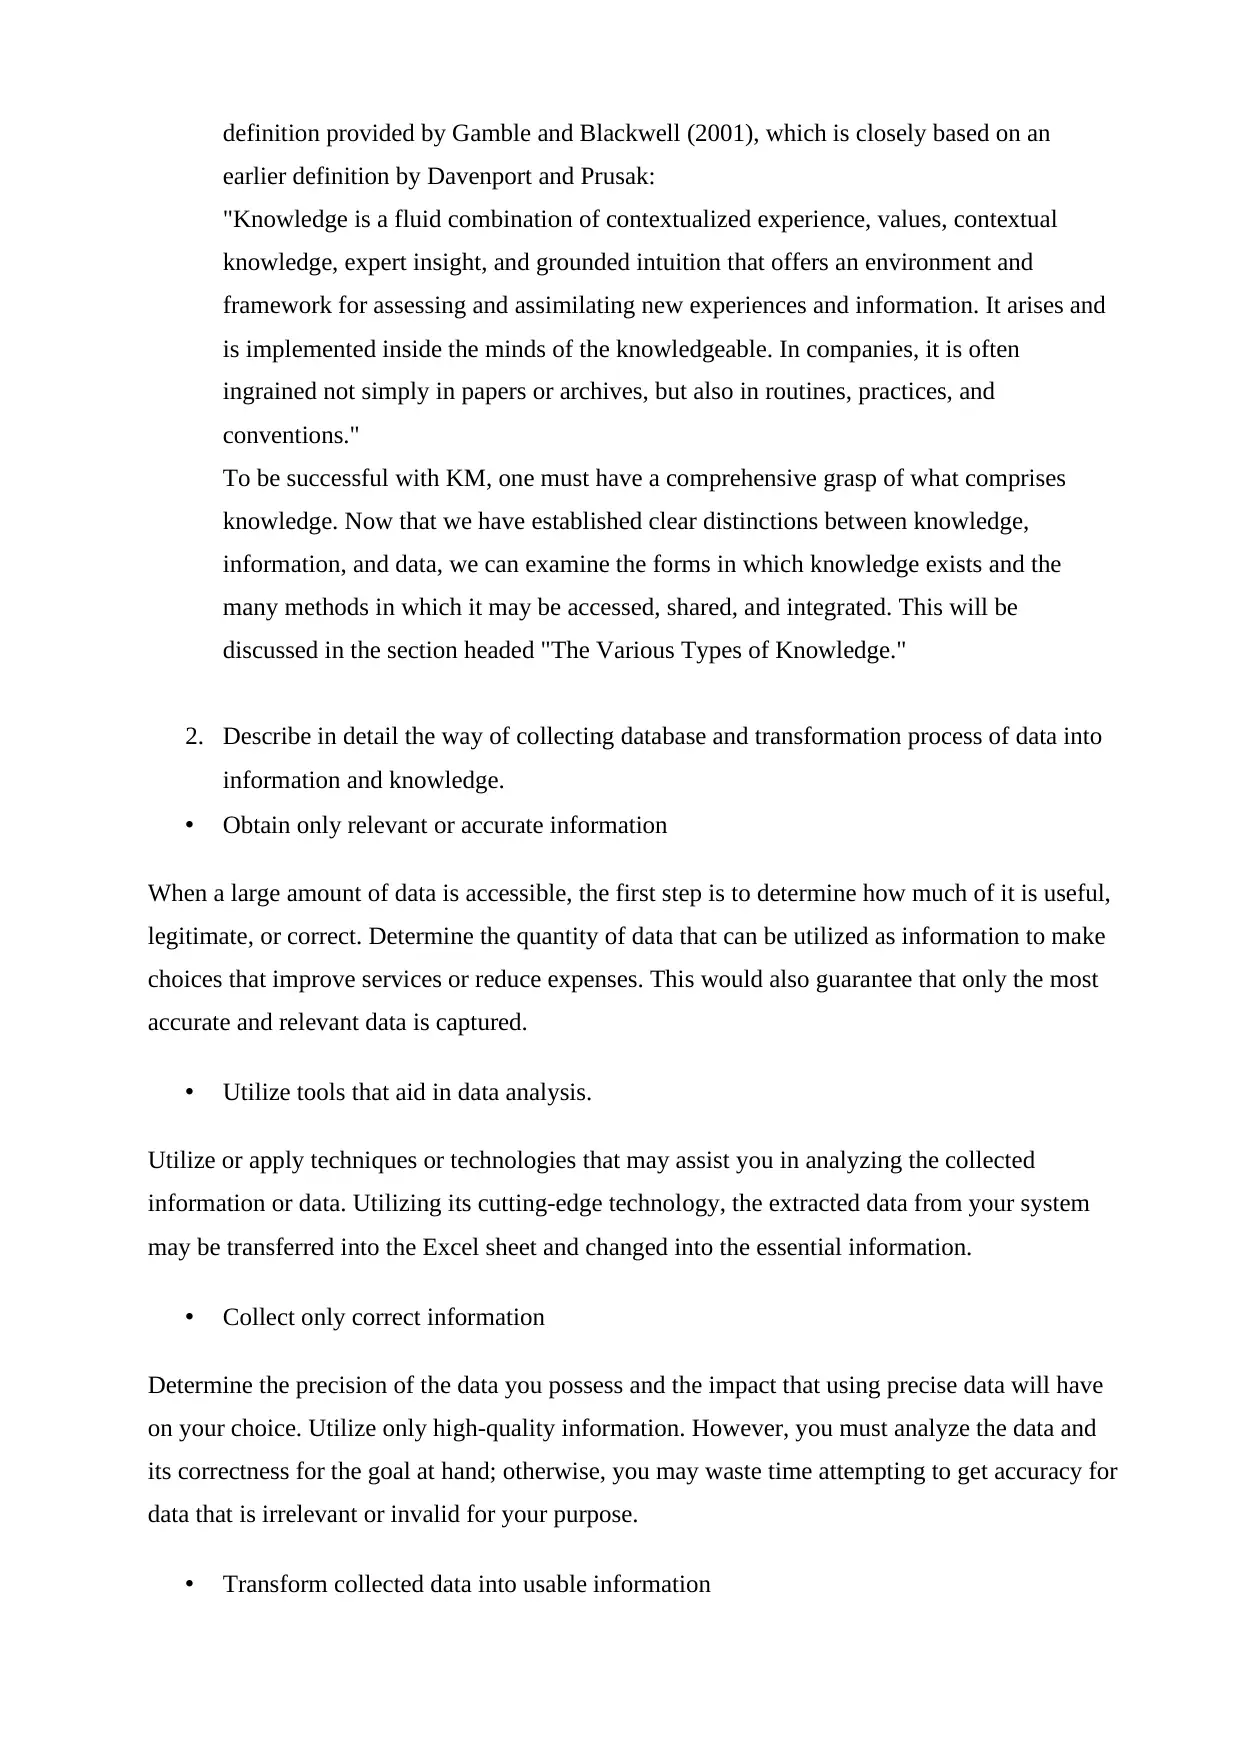
1. Define data, information and knowledge. From published sources and theoretical
frameworks of the primary research, you should show how data can be turned into
information and information into knowledge.
• Data: are facts and numbers that convey a certain message but are not structured and
give no further information on patterns, context, etc. I shall adopt Thoreau’s (1999)
definition of data: "unstructured facts and numbers that have the least influence on the
average manager."
• Information: Before data to be considered information, they must be contextualized,
classified, computed, and compacted (Davenport & Prusik 2000). Thus, information
creates a larger picture; it is facts with significance and use (Bali et al 2009). It may
represent a trend in the surroundings or demonstrate a sales pattern over a certain time
period. Information consists mostly of "answers to queries beginning with who, what,
where, when, and how many" (Ackoff 1999).
IT is often indispensable for transforming data into information, especially in bigger
organizations that create vast quantities of data across numerous departments and tasks.
Contextualization mostly requires the assistance of the human brain.
Knowledge is strongly related to action and indicates skill and comprehension. Each
person's knowledge is the result of his experience and includes the standards by which he
assesses fresh inputs from his environment (Davenport & Prusak 2000). I will adopt the
Statistical methods aid in classification in four ways: developing probability models for data and
classes so that probable classifications for a given set of data can be identified; developing tests
of validity of specific classes produced by a classification scheme; comparing the effectiveness
of different classification schemes; and expanding the search for optimal classifications using
probabilistic search strategies. Standard hierarchical and partitioning techniques are statistically
analyzed, and some enhancements employing density estimation methods and mixture models
are presented. Methods for detecting multimodality in high- dimensional data are presented.
(Neil J. Smelser and Paul B. Baltes, 2001) In addition, we go further into examining business
and economic data/information gathered from publicly available sources. In particular, examine
the nature and process of business and economic data/information from a variety of public
sources, as well as data from a number of sources using various analytical methodologies.
Furthermore, critically analyze the analytical methodologies utilized to display business and
economic data/information from a variety of published sources.
Main contents
I. Evaluate the nature and process of business and economic data/information from a
range of different published sources
1. Define data, information and knowledge. From published sources and theoretical
frameworks of the primary research, you should show how data can be turned into
information and information into knowledge.
• Data: are facts and numbers that convey a certain message but are not structured and
give no further information on patterns, context, etc. I shall adopt Thoreau’s (1999)
definition of data: "unstructured facts and numbers that have the least influence on the
average manager."
• Information: Before data to be considered information, they must be contextualized,
classified, computed, and compacted (Davenport & Prusik 2000). Thus, information
creates a larger picture; it is facts with significance and use (Bali et al 2009). It may
represent a trend in the surroundings or demonstrate a sales pattern over a certain time
period. Information consists mostly of "answers to queries beginning with who, what,
where, when, and how many" (Ackoff 1999).
IT is often indispensable for transforming data into information, especially in bigger
organizations that create vast quantities of data across numerous departments and tasks.
Contextualization mostly requires the assistance of the human brain.
Knowledge is strongly related to action and indicates skill and comprehension. Each
person's knowledge is the result of his experience and includes the standards by which he
assesses fresh inputs from his environment (Davenport & Prusak 2000). I will adopt the
⊘ This is a preview!⊘
Do you want full access?
Subscribe today to unlock all pages.
Trusted by 1+ million students worldwide
definition provided by Gamble and Blackwell (2001), which is closely based on an
earlier definition by Davenport and Prusak:
"Knowledge is a fluid combination of contextualized experience, values, contextual
knowledge, expert insight, and grounded intuition that offers an environment and
framework for assessing and assimilating new experiences and information. It arises and
is implemented inside the minds of the knowledgeable. In companies, it is often
ingrained not simply in papers or archives, but also in routines, practices, and
conventions."
To be successful with KM, one must have a comprehensive grasp of what comprises
knowledge. Now that we have established clear distinctions between knowledge,
information, and data, we can examine the forms in which knowledge exists and the
many methods in which it may be accessed, shared, and integrated. This will be
discussed in the section headed "The Various Types of Knowledge."
2. Describe in detail the way of collecting database and transformation process of data into
information and knowledge.
• Obtain only relevant or accurate information
When a large amount of data is accessible, the first step is to determine how much of it is useful,
legitimate, or correct. Determine the quantity of data that can be utilized as information to make
choices that improve services or reduce expenses. This would also guarantee that only the most
accurate and relevant data is captured.
• Utilize tools that aid in data analysis.
Utilize or apply techniques or technologies that may assist you in analyzing the collected
information or data. Utilizing its cutting-edge technology, the extracted data from your system
may be transferred into the Excel sheet and changed into the essential information.
• Collect only correct information
Determine the precision of the data you possess and the impact that using precise data will have
on your choice. Utilize only high-quality information. However, you must analyze the data and
its correctness for the goal at hand; otherwise, you may waste time attempting to get accuracy for
data that is irrelevant or invalid for your purpose.
• Transform collected data into usable information
Paraphrase This Document
Need a fresh take? Get an instant paraphrase of this document with our AI Paraphraser
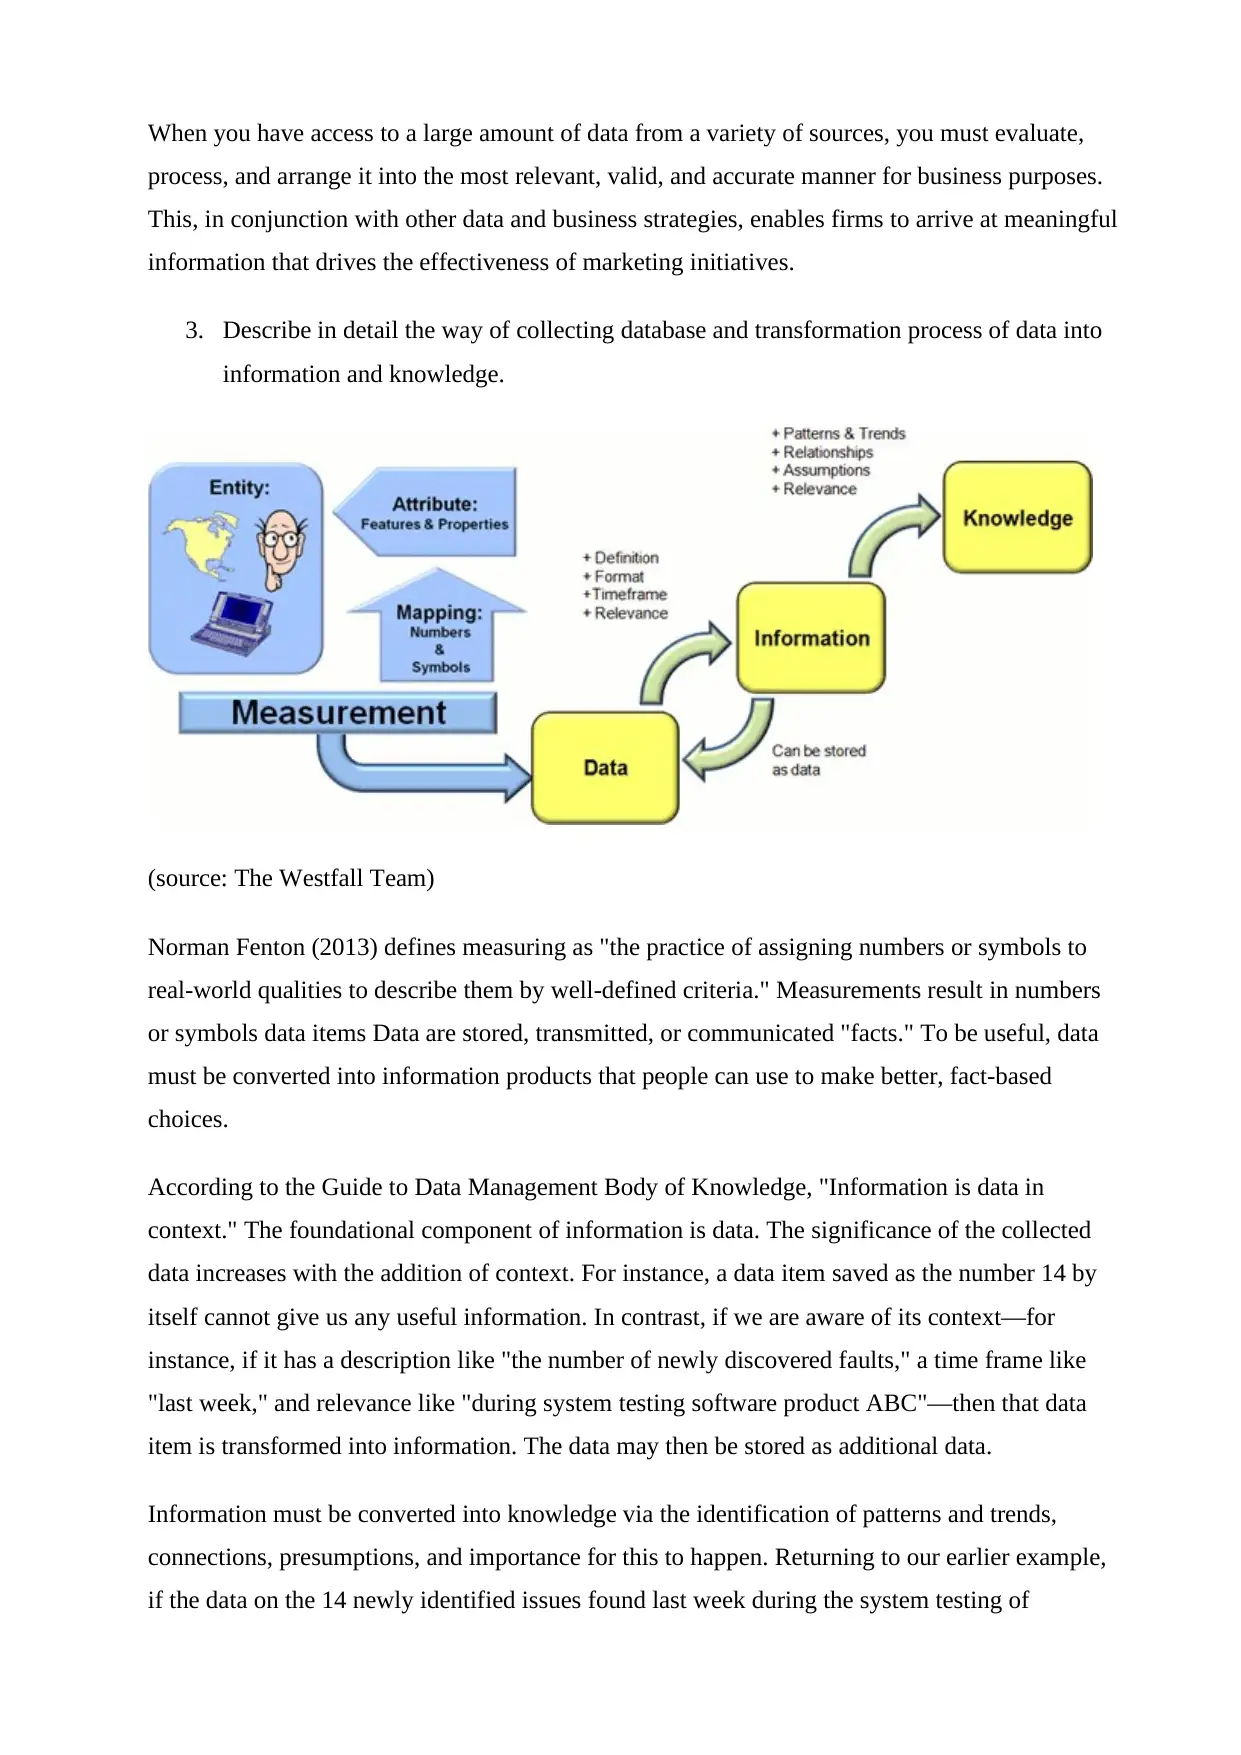
When you have access to a large amount of data from a variety of sources, you must evaluate,
process, and arrange it into the most relevant, valid, and accurate manner for business purposes.
This, in conjunction with other data and business strategies, enables firms to arrive at meaningful
information that drives the effectiveness of marketing initiatives.
3. Describe in detail the way of collecting database and transformation process of data into
information and knowledge.
(source: The Westfall Team)
Norman Fenton (2013) defines measuring as "the practice of assigning numbers or symbols to
real-world qualities to describe them by well-defined criteria." Measurements result in numbers
or symbols data items Data are stored, transmitted, or communicated "facts." To be useful, data
must be converted into information products that people can use to make better, fact-based
choices.
According to the Guide to Data Management Body of Knowledge, "Information is data in
context." The foundational component of information is data. The significance of the collected
data increases with the addition of context. For instance, a data item saved as the number 14 by
itself cannot give us any useful information. In contrast, if we are aware of its context—for
instance, if it has a description like "the number of newly discovered faults," a time frame like
"last week," and relevance like "during system testing software product ABC"—then that data
item is transformed into information. The data may then be stored as additional data.
Information must be converted into knowledge via the identification of patterns and trends,
connections, presumptions, and importance for this to happen. Returning to our earlier example,
if the data on the 14 newly identified issues found last week during the system testing of
software product ABC is just included in a report that no one reads or uses, the data will never be
converted into knowledge. However, information only becomes knowledge if the project
manager decides that this is a higher defect arrival rate trend than was observed in the previous
three weeks relationship, that corrective action is necessary assumption, and that this results in
the assignment of an additional software engineer to problem resolution. (Westfall, 2013)
II. Evaluate data from a variety of sources using different methods of analysis
1. Interpreting data from a variety of sources using different methods of analysis:
descriptive, exploratory and confirmatory.
a. Diagnostic analytics
Diagnostic analytics is a subset of analytics that seeks to answer the question, "What
happened?" Companies may acquire insights into the sources of trends in their data by
employing diagnostic analytics. Diagnostic analytics can employ a number of approaches, such
as data drilling and data mining. Companies may need to analyze various data sources, including
perhaps external data, to understand the fundamental cause of trends. (Holliday, 2021)
Every company may benefit from gaining a better understanding of its business performance in
order to replicate its success and rectify any concerns. Diagnostic analytics helps firms identify
the internal and external factors that impact their outcomes. It provides a more complete view of
each circumstance, allowing firms to make better judgments. For example, if the company
determines that a certain online marketing campaign is to blame for higher sales of a big product,
it may allocate greater resources to that campaign and develop comparable initiatives for other
commodities. (Holliday, 2021)
b. Exploratory data analysis
Data scientists utilize exploratory data analysis (EDA) to study and investigate data sets and
describe their essential properties, frequently using data visualization approaches. It assists in
deciding how to efficiently manipulate data sources to achieve the desired answers, making it
easier for data scientists to find patterns, spot anomalies, test hypotheses, and confirm
assumptions. (Education, 2020)
EDA is largely used to discover what data may disclose beyond the formal modeling or
hypothesis testing tasks, and it offers a deeper knowledge of data set variables and their
interactions. It can also assist you assess whether the statistical approaches you're thinking about
using for data analysis are acceptable. Developed in the 1970s by American mathematician John
⊘ This is a preview!⊘
Do you want full access?
Subscribe today to unlock all pages.
Trusted by 1+ million students worldwide
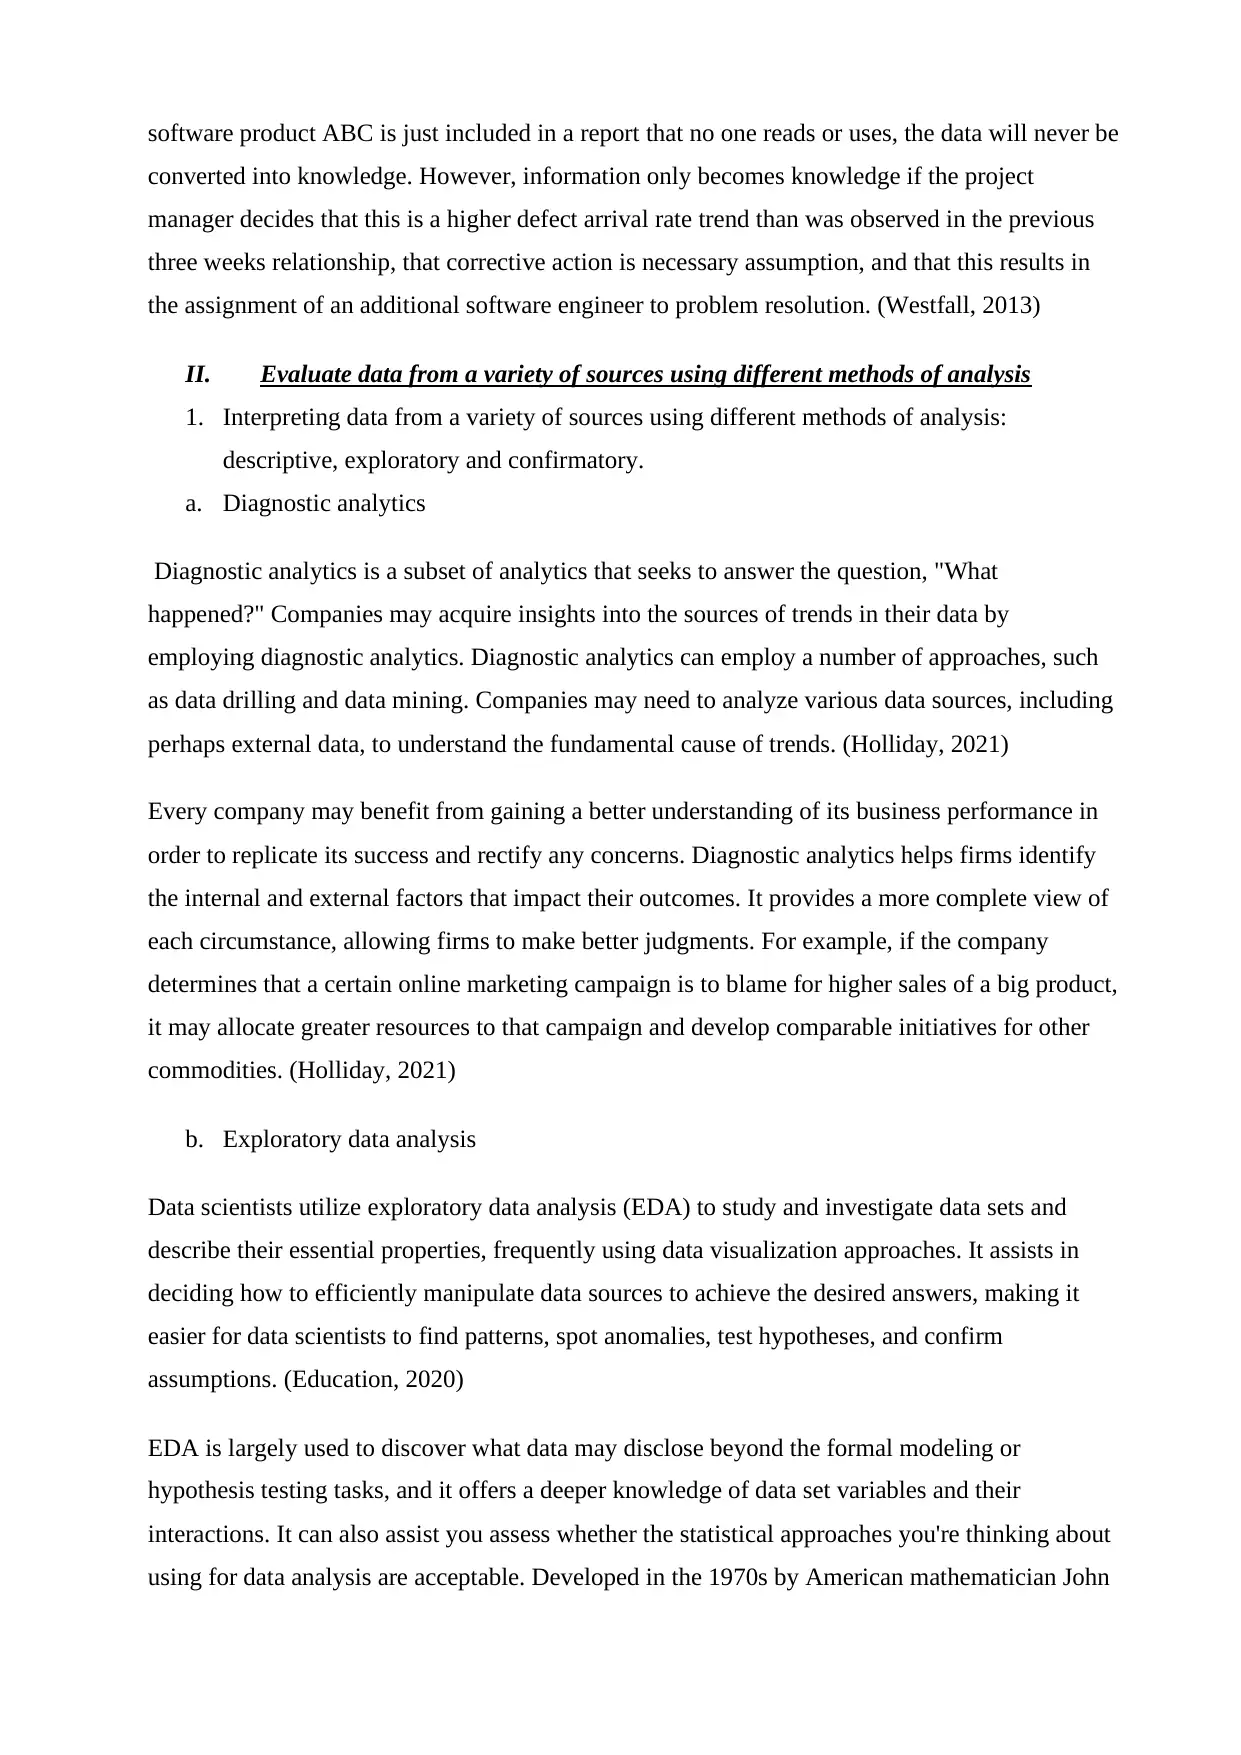
Tukey, EDA techniques are still commonly employed in the data discovery process today.
(Education, 2020)
So, in this retail case study, for example, an analyst may look at this image and notice an
intriguing discovery in the number of product categories purchased in one year. The number of
categories decreased as planned, but subsequently increased to 50 or more. Why? Further inquiry
found that other shops were purchasing and reselling their items from them. This may enable the
shop to construct a business-to-business sales strategy and establish partnerships with these
smaller merchants. (Education, 2020)
c. Descriptive analytics
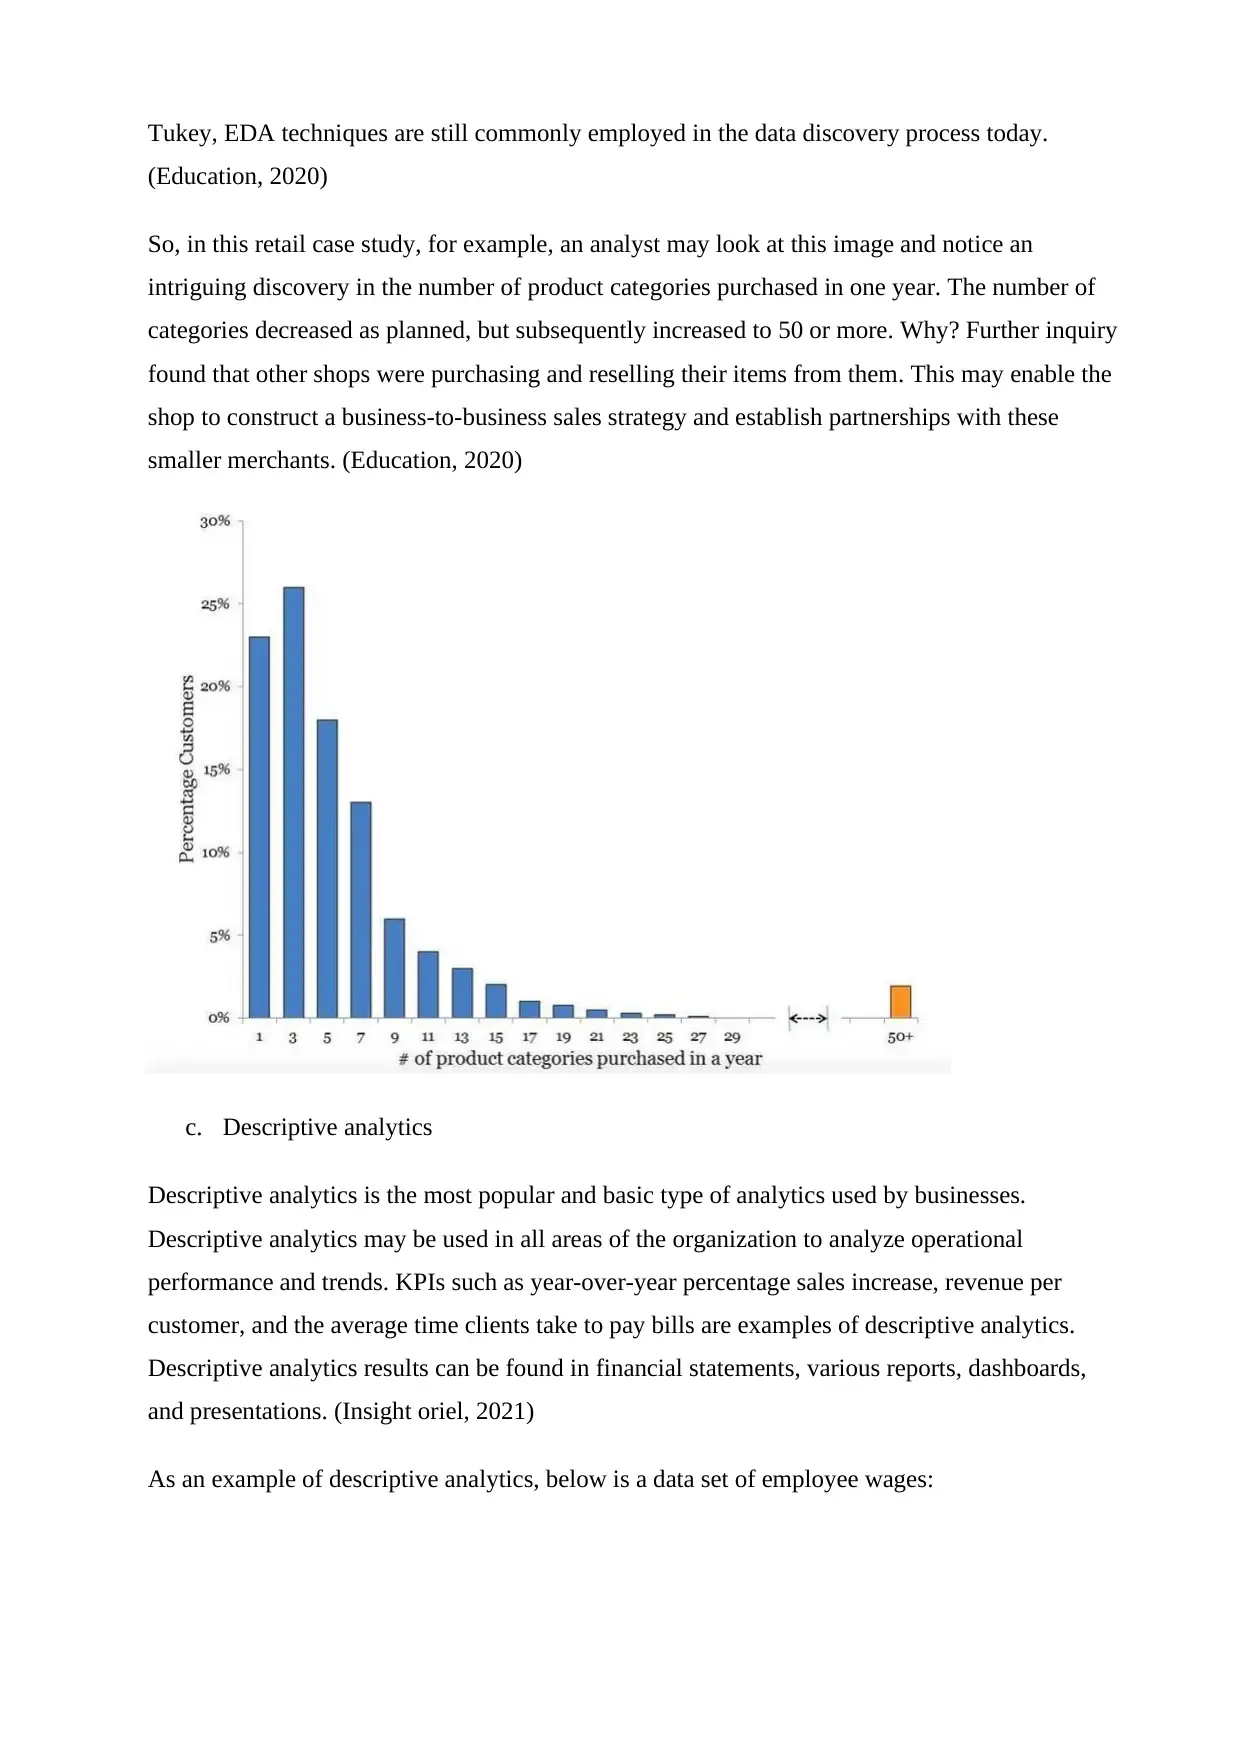
Descriptive analytics is the most popular and basic type of analytics used by businesses.
Descriptive analytics may be used in all areas of the organization to analyze operational
performance and trends. KPIs such as year-over-year percentage sales increase, revenue per
customer, and the average time clients take to pay bills are examples of descriptive analytics.
Descriptive analytics results can be found in financial statements, various reports, dashboards,
and presentations. (Insight oriel, 2021)
As an example of descriptive analytics, below is a data set of employee wages:
(Education, 2020)
So, in this retail case study, for example, an analyst may look at this image and notice an
intriguing discovery in the number of product categories purchased in one year. The number of
categories decreased as planned, but subsequently increased to 50 or more. Why? Further inquiry
found that other shops were purchasing and reselling their items from them. This may enable the
shop to construct a business-to-business sales strategy and establish partnerships with these
smaller merchants. (Education, 2020)
c. Descriptive analytics
Descriptive analytics is the most popular and basic type of analytics used by businesses.
Descriptive analytics may be used in all areas of the organization to analyze operational
performance and trends. KPIs such as year-over-year percentage sales increase, revenue per
customer, and the average time clients take to pay bills are examples of descriptive analytics.
Descriptive analytics results can be found in financial statements, various reports, dashboards,
and presentations. (Insight oriel, 2021)
As an example of descriptive analytics, below is a data set of employee wages:
Paraphrase This Document
Need a fresh take? Get an instant paraphrase of this document with our AI Paraphraser
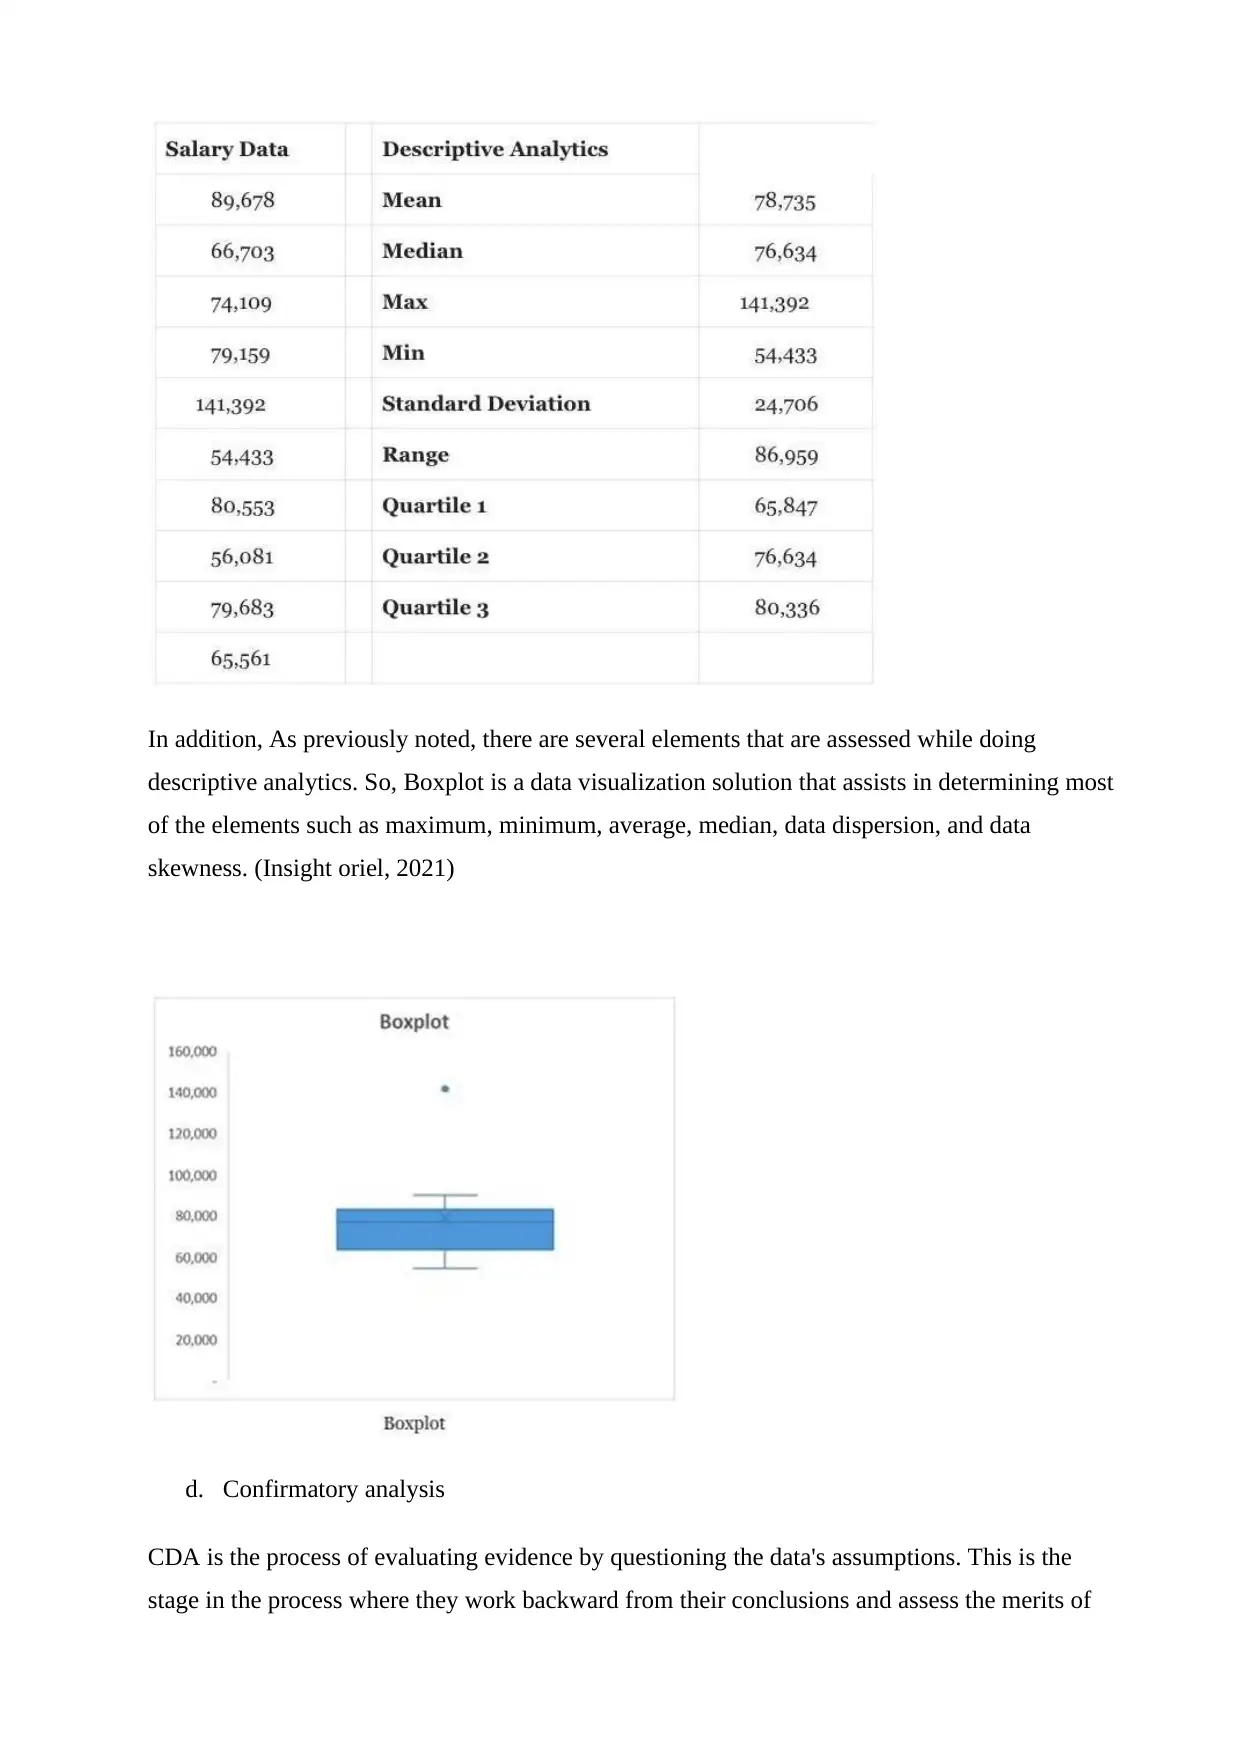
In addition, As previously noted, there are several elements that are assessed while doing
descriptive analytics. So, Boxplot is a data visualization solution that assists in determining most
of the elements such as maximum, minimum, average, median, data dispersion, and data
skewness. (Insight oriel, 2021)
d. Confirmatory analysis
CDA is the process of evaluating evidence by questioning the data's assumptions. This is the
stage in the process where they work backward from their conclusions and assess the merits of
their work. It's similar to evaluating evidence and asking witnesses in a trial to decide the
defendant's guilt or innocence. (NDMU, 2018)
CDA techniques include hypothesis testing, estimation, regression analysis (estimating the
connection between variables), and variance analysis (evaluating the difference between the
planned and actual outcome). (NDMU, 2018)
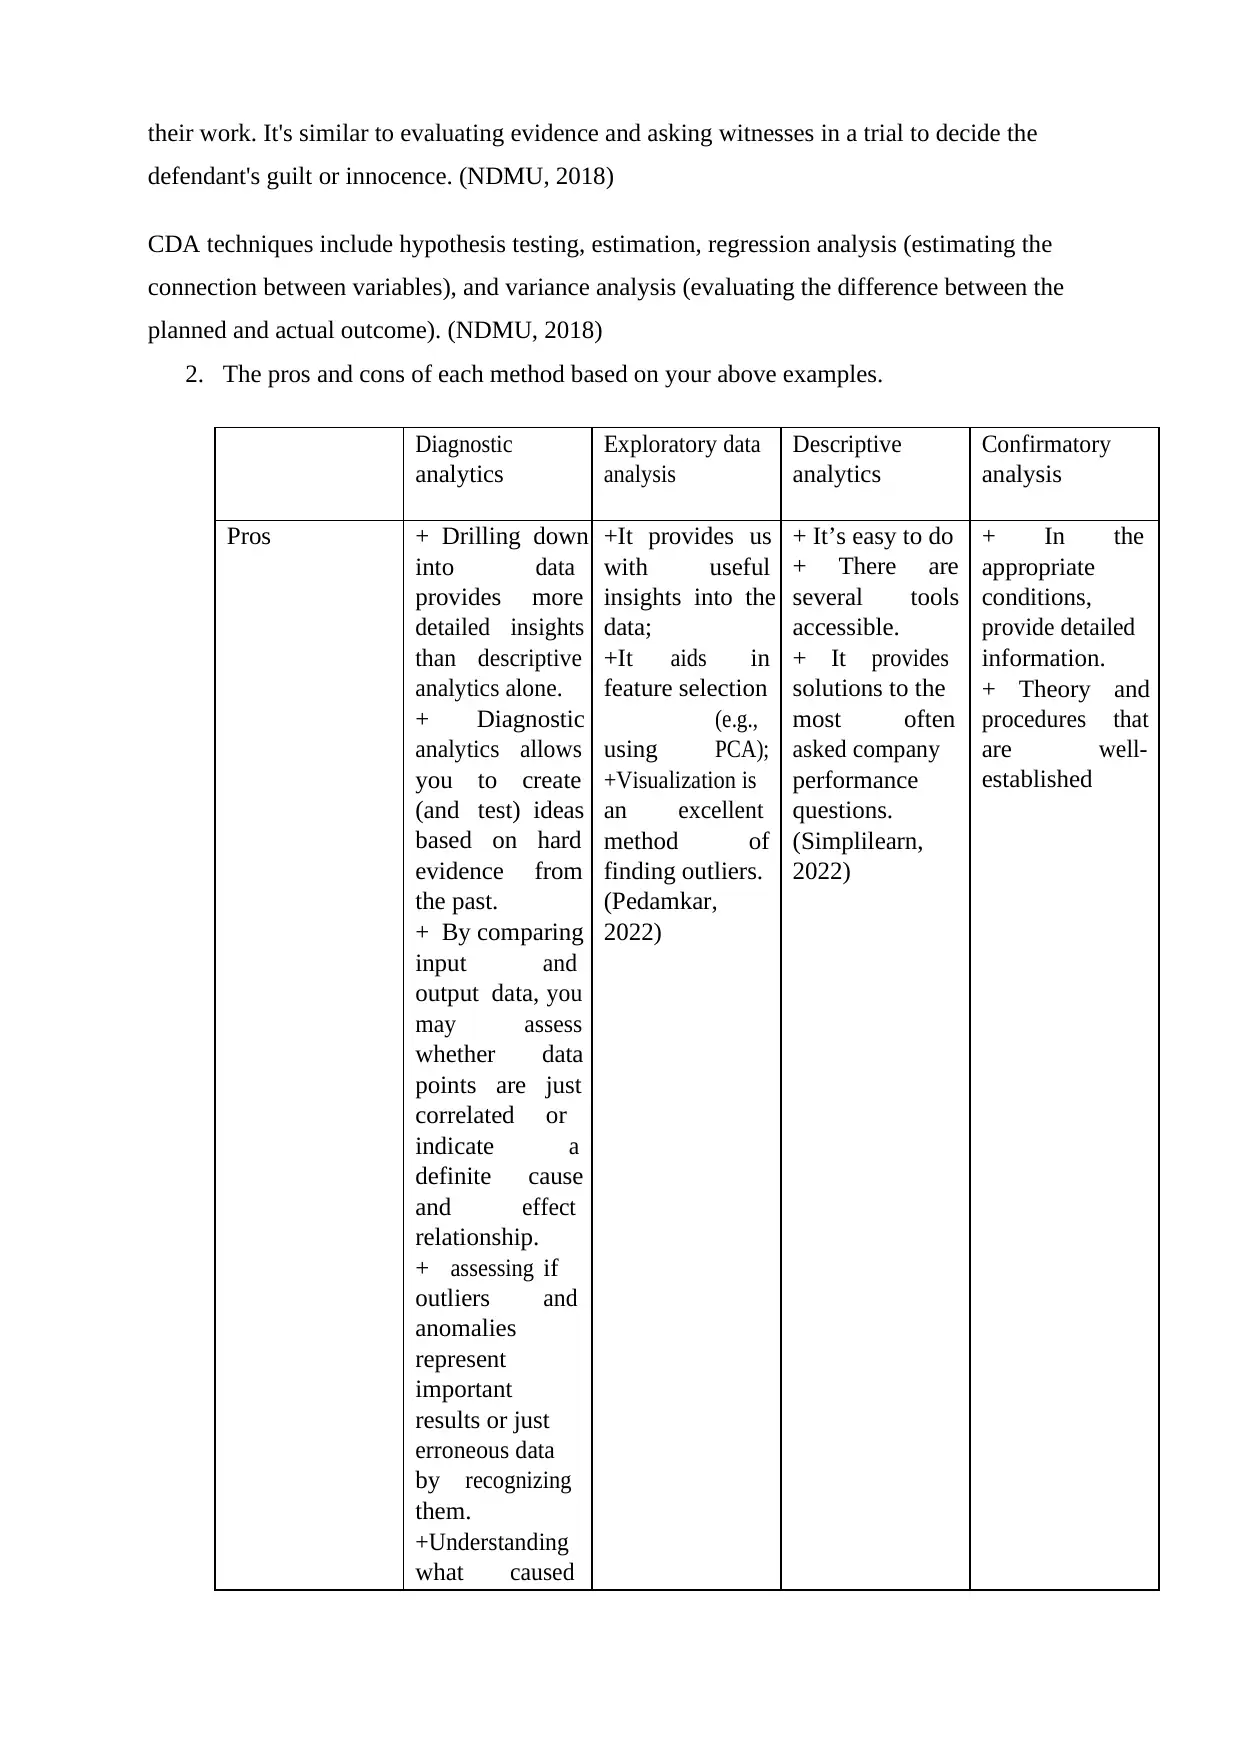
2. The pros and cons of each method based on your above examples.
Diagnostic
analytics
Exploratory data
analysis
Descriptive
analytics
Confirmatory
analysis
Pros + Drilling down
into data
provides more
detailed insights
than descriptive
analytics alone.
+ Diagnostic
analytics allows
you to create
(and test) ideas
based on hard
evidence from
the past.
+ By comparing
input and
output data, you
may assess
whether data
points are just
correlated or
indicate a
definite cause
and effect
relationship.
+ assessing if
outliers and
anomalies
represent
important
results or just
erroneous data
by recognizing
them.
+Understanding
what caused
+It provides us
with useful
insights into the
data;
+It aids in
feature selection
(e.g.,
using PCA);
+Visualization is
an excellent
method of
finding outliers.
(Pedamkar,
2022)
+ It’s easy to do
+ There are
several tools
accessible.
+ It provides
solutions to the
most often
asked company
performance
questions.
(Simplilearn,
2022)
+ In the
appropriate
conditions,
provide detailed
information.
+ Theory and
procedures that
are well-
established
defendant's guilt or innocence. (NDMU, 2018)
CDA techniques include hypothesis testing, estimation, regression analysis (estimating the
connection between variables), and variance analysis (evaluating the difference between the
planned and actual outcome). (NDMU, 2018)
2. The pros and cons of each method based on your above examples.
Diagnostic
analytics
Exploratory data
analysis
Descriptive
analytics
Confirmatory
analysis
Pros + Drilling down
into data
provides more
detailed insights
than descriptive
analytics alone.
+ Diagnostic
analytics allows
you to create
(and test) ideas
based on hard
evidence from
the past.
+ By comparing
input and
output data, you
may assess
whether data
points are just
correlated or
indicate a
definite cause
and effect
relationship.
+ assessing if
outliers and
anomalies
represent
important
results or just
erroneous data
by recognizing
them.
+Understanding
what caused
+It provides us
with useful
insights into the
data;
+It aids in
feature selection
(e.g.,
using PCA);
+Visualization is
an excellent
method of
finding outliers.
(Pedamkar,
2022)
+ It’s easy to do
+ There are
several tools
accessible.
+ It provides
solutions to the
most often
asked company
performance
questions.
(Simplilearn,
2022)
+ In the
appropriate
conditions,
provide detailed
information.
+ Theory and
procedures that
are well-
established
⊘ This is a preview!⊘
Do you want full access?
Subscribe today to unlock all pages.
Trusted by 1+ million students worldwide

Paraphrase This Document
Need a fresh take? Get an instant paraphrase of this document with our AI Paraphraser
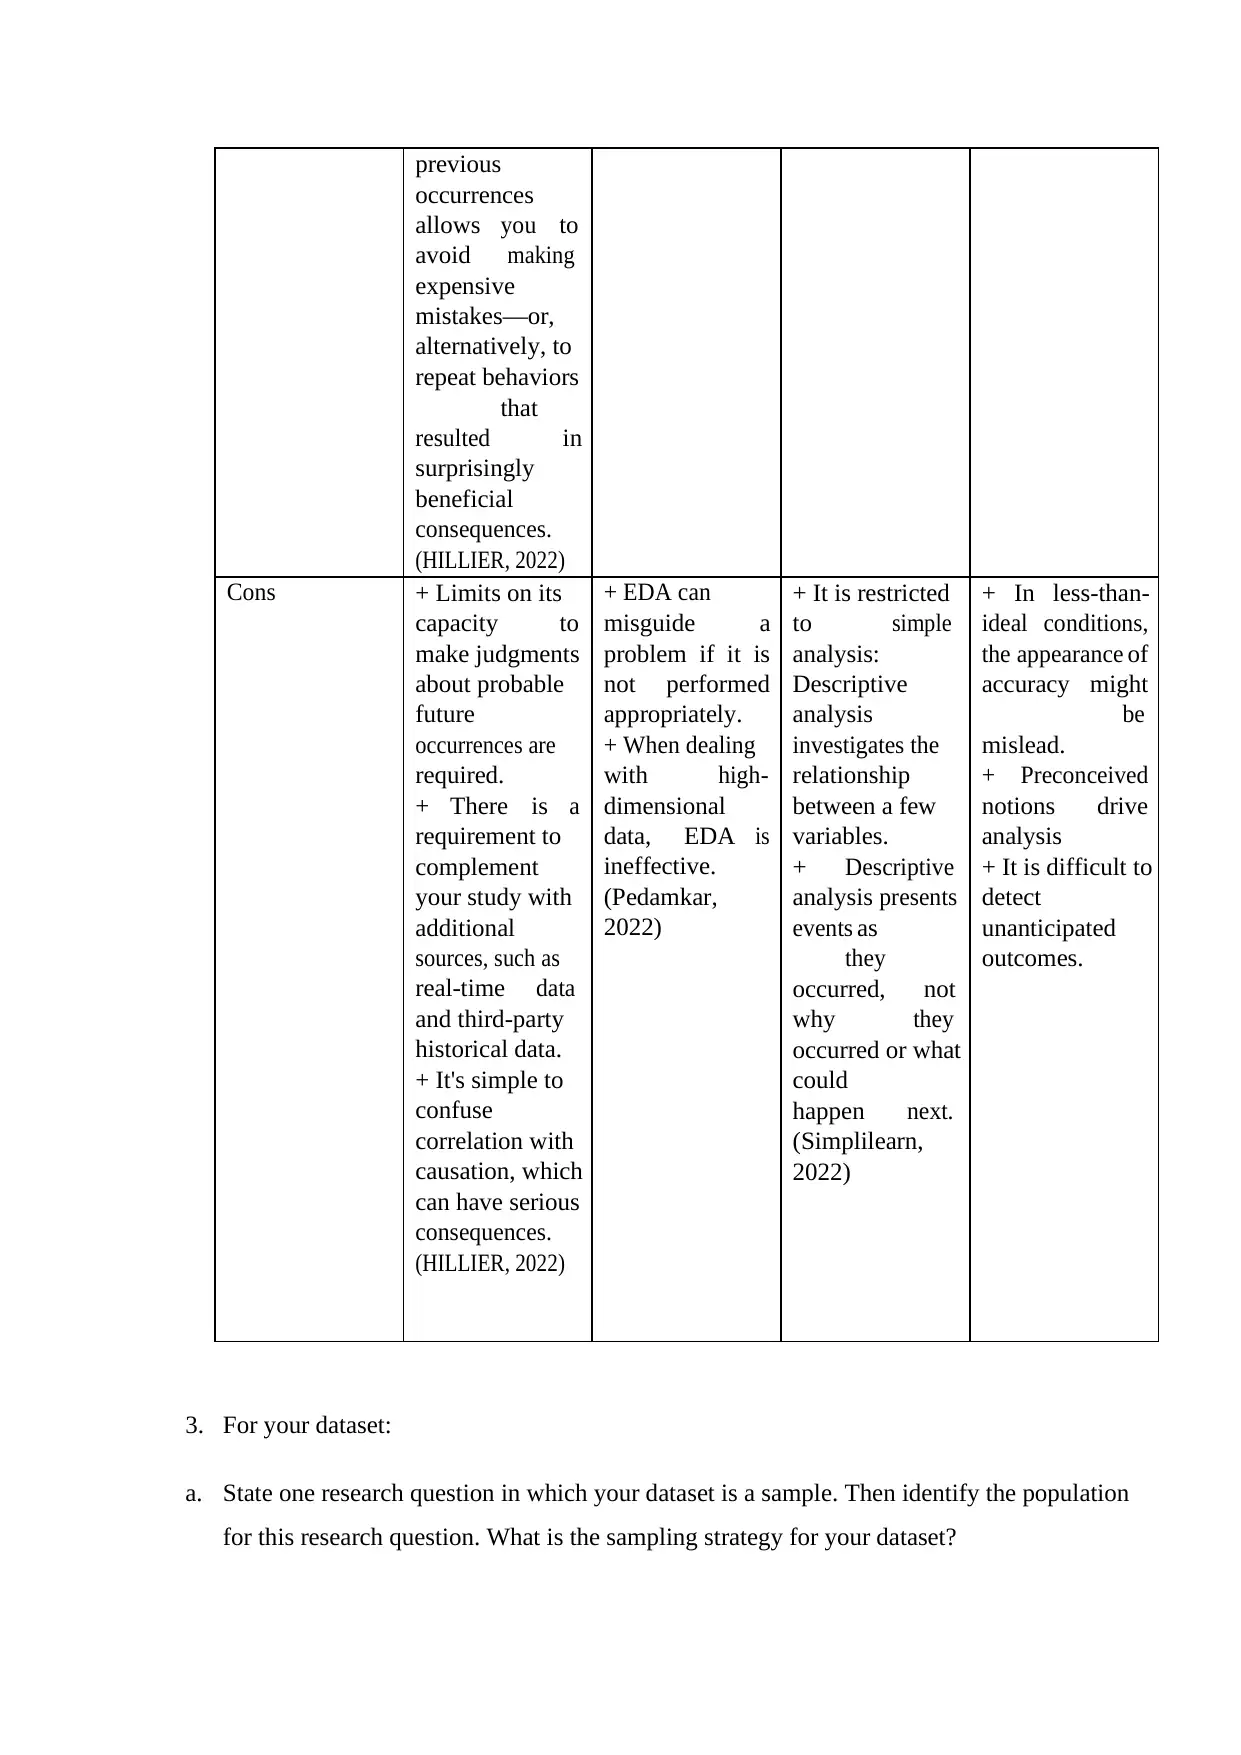
previous
occurrences
allows you to
avoid making
expensive
mistakes—or,
alternatively, to
repeat behaviors
that
resulted in
surprisingly
beneficial
consequences.
(HILLIER, 2022)
Cons + Limits on its
capacity to
make judgments
about probable
future
occurrences are
required.
+ There is a
requirement to
complement
your study with
additional
sources, such as
real-time data
and third-party
historical data.
+ It's simple to
confuse
correlation with
causation, which
can have serious
consequences.
(HILLIER, 2022)
+ EDA can
misguide a
problem if it is
not performed
appropriately.
+ When dealing
with high-
dimensional
data, EDA is
ineffective.
(Pedamkar,
2022)
+ It is restricted
to simple
analysis:
Descriptive
analysis
investigates the
relationship
between a few
variables.
+ Descriptive
analysis presents
events as
they
occurred, not
why they
occurred or what
could
happen next.
(Simplilearn,
2022)
+ In less-than-
ideal conditions,
the appearance of
accuracy might
be
mislead.
+ Preconceived
notions drive
analysis
+ It is difficult to
detect
unanticipated
outcomes.
3. For your dataset:
a. State one research question in which your dataset is a sample. Then identify the population
for this research question. What is the sampling strategy for your dataset?
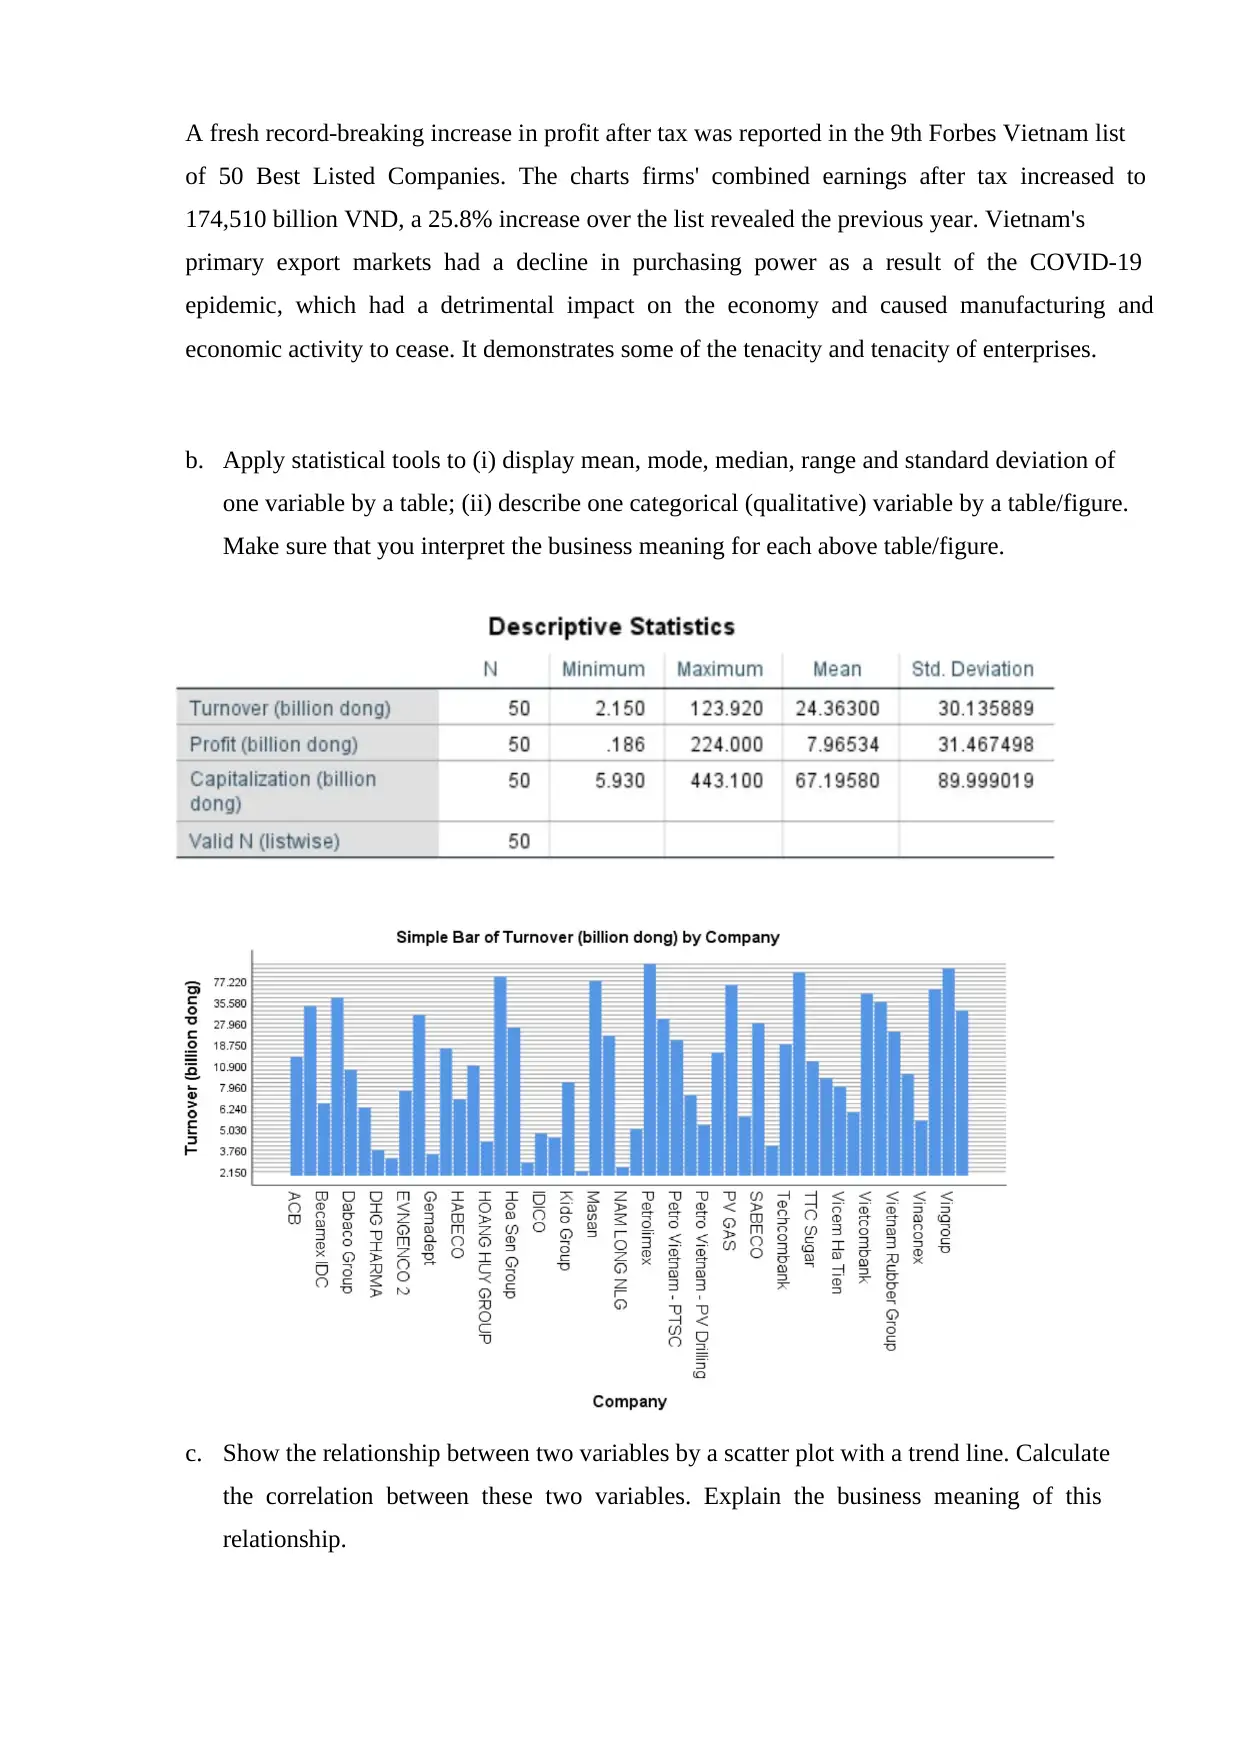
A fresh record-breaking increase in profit after tax was reported in the 9th Forbes Vietnam list
of 50 Best Listed Companies. The charts firms' combined earnings after tax increased to
174,510 billion VND, a 25.8% increase over the list revealed the previous year. Vietnam's
primary export markets had a decline in purchasing power as a result of the COVID-19
epidemic, which had a detrimental impact on the economy and caused manufacturing and
economic activity to cease. It demonstrates some of the tenacity and tenacity of enterprises.
b. Apply statistical tools to (i) display mean, mode, median, range and standard deviation of
one variable by a table; (ii) describe one categorical (qualitative) variable by a table/figure.
Make sure that you interpret the business meaning for each above table/figure.
c. Show the relationship between two variables by a scatter plot with a trend line. Calculate
the correlation between these two variables. Explain the business meaning of this
relationship.
⊘ This is a preview!⊘
Do you want full access?
Subscribe today to unlock all pages.
Trusted by 1+ million students worldwide
1 out of 14
Related Documents


Your All-in-One AI-Powered Toolkit for Academic Success.
+13062052269
info@desklib.com
Available 24*7 on WhatsApp / Email
![[object Object]](/_next/static/media/star-bottom.7253800d.svg)
Unlock your academic potential
Copyright © 2020–2026 A2Z Services. All Rights Reserved. Developed and managed by ZUCOL.