Business Data Analysis and Case Study Report - Module Report
VerifiedAdded on 2021/02/19
|16
|4209
|25
Report
AI Summary
This report provides a comprehensive data analysis, beginning with an introduction to data's importance in research. The main body is divided into two parts. Part 1 distinguishes between qualitative and quantitative data, detailing horizontal, vertical, and statistical analysis methods. It emphasizes data quality, its dimensions, and its significance in financial reports. Part 2 presents a case study involving aircraft fleet data, answering questions about fleet size, manufacturer representation, and percentage calculations. It includes ratio analysis and explores market risk factors. The report concludes with a summary of findings and references.

Using Information
Paraphrase This Document
Need a fresh take? Get an instant paraphrase of this document with our AI Paraphraser
Table of Contents
INTRODUCTION ...............................................................................................................................3
MAIN BODY.......................................................................................................................................3
PART 1 .................................................................................................................................................3
Ques. 1. Distinguish.........................................................................................................................3
Ques. 2. Explaining data quality and its importance in the final reports ........................................5
PART 2 CASE STUDY........................................................................................................................6
Ques 1. Answer following...............................................................................................................6
a). Aircraft having the largest fleet in December 2017....................................................................6
b). Aircraft manufacturer having the biggest representation as per December 2017......................7
c). Percentage...................................................................................................................................8
d). Pie chart......................................................................................................................................8
e).Graph...........................................................................................................................................9
Ques. 2. Ratio analysis...................................................................................................................10
Ques. 3. Determining the risk factors that would affect the market position of the company.......11
Ques. 4.Commenting on the British Revenue for last 5 year.........................................................13
CONCLUSION..................................................................................................................................14
REFERENCES...................................................................................................................................15
INTRODUCTION
Data is considered as one of the most essential component for completing every research project.
Data gathered needs to be analysed with the help of statistical as well as mathematical tools for
deriving meaningful information out of it. Data analysed can be represented with the help of graph,
pie chart etc. for providing better understanding to its user for assisting them in their decision
making process. It is very much important that data collected is having reliability aspect as well as
ensures correctness about the subject matter. In this report, first part will made emphasis on defining
difference between Qualitative and Quantitative data. Different trend analysis methods used. Data
quality with its importance in the financial statements and for its users. In second part, case study is
solved with the help of appropriate excel calculations and graph for providing better understanding
to the users.
MAIN BODY
PART 1
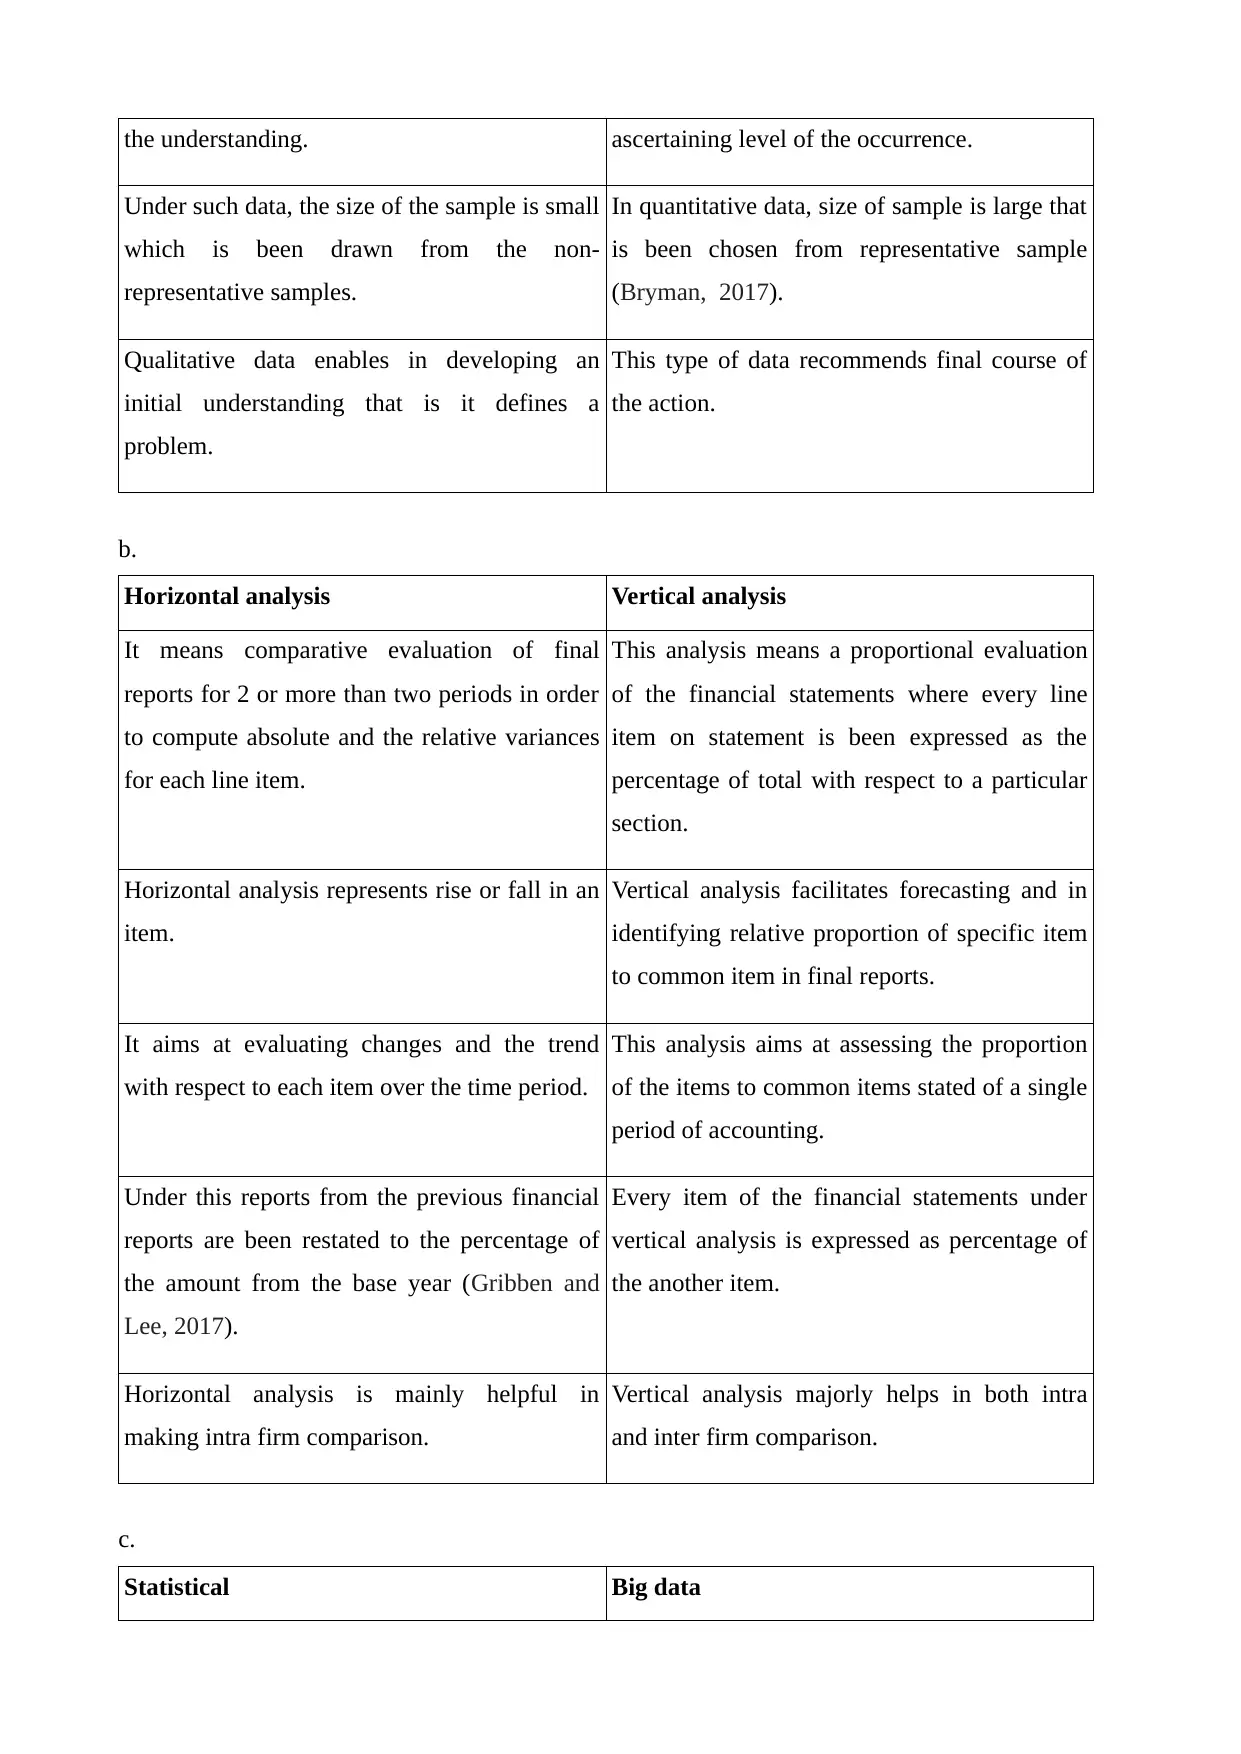
Ques. 1. Distinguish
a.
Qualitative data Quantitative data
It refers to the data under which the objects are
classified on the basis of the attributes.
This type of data are the one which could be
counted and is expressed in form of values and
the numbers.
The methodology adopted under qualitative
data is exploratory that means to facilitate
understanding and the insights.
However, quantitative data are considered as
conclusive in nature that aims fro testing a
particular hypothesis and in examining the
relationships.
Inquiry approach under this data is said to be
holistic and subjective.
On the other state, quantitative data involves
focused and the objective approach.
In case of such data, non-statistical analysis is
been made as application of statistical analysis
requires dataset in form of numbers.
Quantitative data includes statistical analysis
by using different statistical tools.
Qualitative data helps in identifying depth of However, quantitative data helps in
Data is considered as one of the most essential component for completing every research project.
Data gathered needs to be analysed with the help of statistical as well as mathematical tools for
deriving meaningful information out of it. Data analysed can be represented with the help of graph,
pie chart etc. for providing better understanding to its user for assisting them in their decision
making process. It is very much important that data collected is having reliability aspect as well as
ensures correctness about the subject matter. In this report, first part will made emphasis on defining
difference between Qualitative and Quantitative data. Different trend analysis methods used. Data
quality with its importance in the financial statements and for its users. In second part, case study is
solved with the help of appropriate excel calculations and graph for providing better understanding
to the users.
MAIN BODY
PART 1
Ques. 1. Distinguish
a.
Qualitative data Quantitative data
It refers to the data under which the objects are
classified on the basis of the attributes.
This type of data are the one which could be
counted and is expressed in form of values and
the numbers.
The methodology adopted under qualitative
data is exploratory that means to facilitate
understanding and the insights.
However, quantitative data are considered as
conclusive in nature that aims fro testing a
particular hypothesis and in examining the
relationships.
Inquiry approach under this data is said to be
holistic and subjective.
On the other state, quantitative data involves
focused and the objective approach.
In case of such data, non-statistical analysis is
been made as application of statistical analysis
requires dataset in form of numbers.
Quantitative data includes statistical analysis
by using different statistical tools.
Qualitative data helps in identifying depth of However, quantitative data helps in
⊘ This is a preview!⊘
Do you want full access?
Subscribe today to unlock all pages.
Trusted by 1+ million students worldwide
the understanding. ascertaining level of the occurrence.
Under such data, the size of the sample is small
which is been drawn from the non-
representative samples.
In quantitative data, size of sample is large that
is been chosen from representative sample
(Bryman, 2017).
Qualitative data enables in developing an
initial understanding that is it defines a
problem.
This type of data recommends final course of
the action.
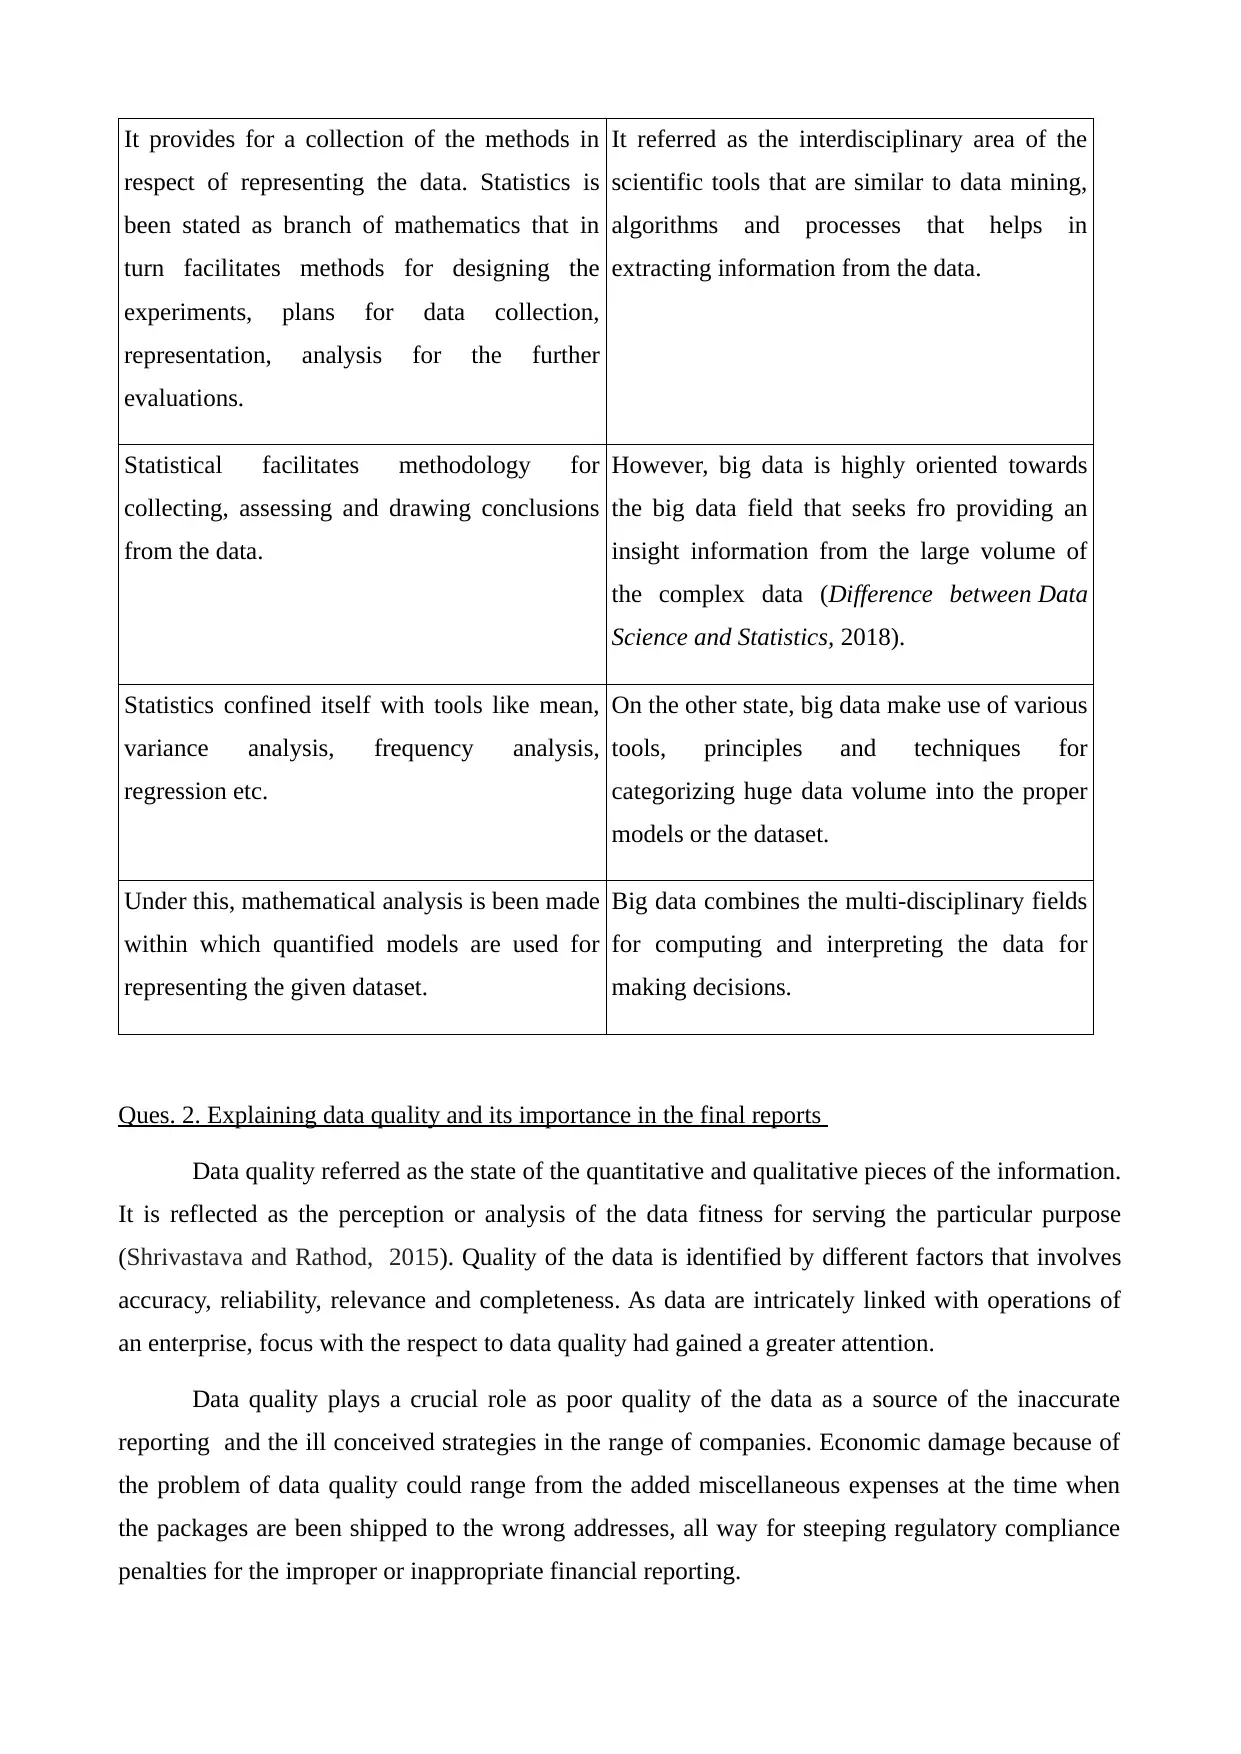
b.
Horizontal analysis Vertical analysis
It means comparative evaluation of final
reports for 2 or more than two periods in order
to compute absolute and the relative variances
for each line item.
This analysis means a proportional evaluation
of the financial statements where every line
item on statement is been expressed as the
percentage of total with respect to a particular
section.
Horizontal analysis represents rise or fall in an
item.
Vertical analysis facilitates forecasting and in
identifying relative proportion of specific item
to common item in final reports.
It aims at evaluating changes and the trend
with respect to each item over the time period.
This analysis aims at assessing the proportion
of the items to common items stated of a single
period of accounting.
Under this reports from the previous financial
reports are been restated to the percentage of
the amount from the base year (Gribben and
Lee, 2017).
Every item of the financial statements under
vertical analysis is expressed as percentage of
the another item.
Horizontal analysis is mainly helpful in
making intra firm comparison.
Vertical analysis majorly helps in both intra
and inter firm comparison.
c.
Statistical Big data
Under such data, the size of the sample is small
which is been drawn from the non-
representative samples.
In quantitative data, size of sample is large that
is been chosen from representative sample
(Bryman, 2017).
Qualitative data enables in developing an
initial understanding that is it defines a
problem.
This type of data recommends final course of
the action.
b.
Horizontal analysis Vertical analysis
It means comparative evaluation of final
reports for 2 or more than two periods in order
to compute absolute and the relative variances
for each line item.
This analysis means a proportional evaluation
of the financial statements where every line
item on statement is been expressed as the
percentage of total with respect to a particular
section.
Horizontal analysis represents rise or fall in an
item.
Vertical analysis facilitates forecasting and in
identifying relative proportion of specific item
to common item in final reports.
It aims at evaluating changes and the trend
with respect to each item over the time period.
This analysis aims at assessing the proportion
of the items to common items stated of a single
period of accounting.
Under this reports from the previous financial
reports are been restated to the percentage of
the amount from the base year (Gribben and
Lee, 2017).
Every item of the financial statements under
vertical analysis is expressed as percentage of
the another item.
Horizontal analysis is mainly helpful in
making intra firm comparison.
Vertical analysis majorly helps in both intra
and inter firm comparison.
c.
Statistical Big data
Paraphrase This Document
Need a fresh take? Get an instant paraphrase of this document with our AI Paraphraser
It provides for a collection of the methods in
respect of representing the data. Statistics is
been stated as branch of mathematics that in
turn facilitates methods for designing the
experiments, plans for data collection,
representation, analysis for the further
evaluations.
It referred as the interdisciplinary area of the
scientific tools that are similar to data mining,
algorithms and processes that helps in
extracting information from the data.
Statistical facilitates methodology for
collecting, assessing and drawing conclusions
from the data.
However, big data is highly oriented towards
the big data field that seeks fro providing an
insight information from the large volume of
the complex data (Difference between Data
Science and Statistics, 2018).
Statistics confined itself with tools like mean,
variance analysis, frequency analysis,
regression etc.
On the other state, big data make use of various
tools, principles and techniques for
categorizing huge data volume into the proper
models or the dataset.
Under this, mathematical analysis is been made
within which quantified models are used for
representing the given dataset.
Big data combines the multi-disciplinary fields
for computing and interpreting the data for
making decisions.
Ques. 2. Explaining data quality and its importance in the final reports
Data quality referred as the state of the quantitative and qualitative pieces of the information.
It is reflected as the perception or analysis of the data fitness for serving the particular purpose
(Shrivastava and Rathod, 2015). Quality of the data is identified by different factors that involves
accuracy, reliability, relevance and completeness. As data are intricately linked with operations of
an enterprise, focus with the respect to data quality had gained a greater attention.
Data quality plays a crucial role as poor quality of the data as a source of the inaccurate
reporting and the ill conceived strategies in the range of companies. Economic damage because of
the problem of data quality could range from the added miscellaneous expenses at the time when
the packages are been shipped to the wrong addresses, all way for steeping regulatory compliance
penalties for the improper or inappropriate financial reporting.
There are various dimensions and the aspects that majorly important to the data quality that
includes correctness, accuracy and completeness that helps in determining errors which occurs in
case if the data resulted as missing, conformity, consistency, lack of conflict with the other values of
data, adherence to the standard format, duplication and the repeated records.
Data quality plays an essential role in facilitating accurate financial information as it helps
the financial service enterprise in demonstrating completeness, accuracy and the timeliness of the
data that in turn helps the firm in meeting with the relevant regulatory guidelines while preparing
financial statements and companies could be able to assess their own data quality goals
(Waemustafa and Sukri, 2016). This helps in developing improved relationships with the customers
as accuracy in the data leads to create better customer relations and also helps in estimating ways
for fulfilling their needs.
Thus, containing good data quality ensures that all the employees are considered as
accountable and allows an entity in prioritising the optimum or best use of the resources. Data
quality also improves the reporting and provides for a fair and true picture of the financial
statements to the users so that they could be able to make decisions wisely.
PART 2 CASE STUDY
Ques 1. Answer following
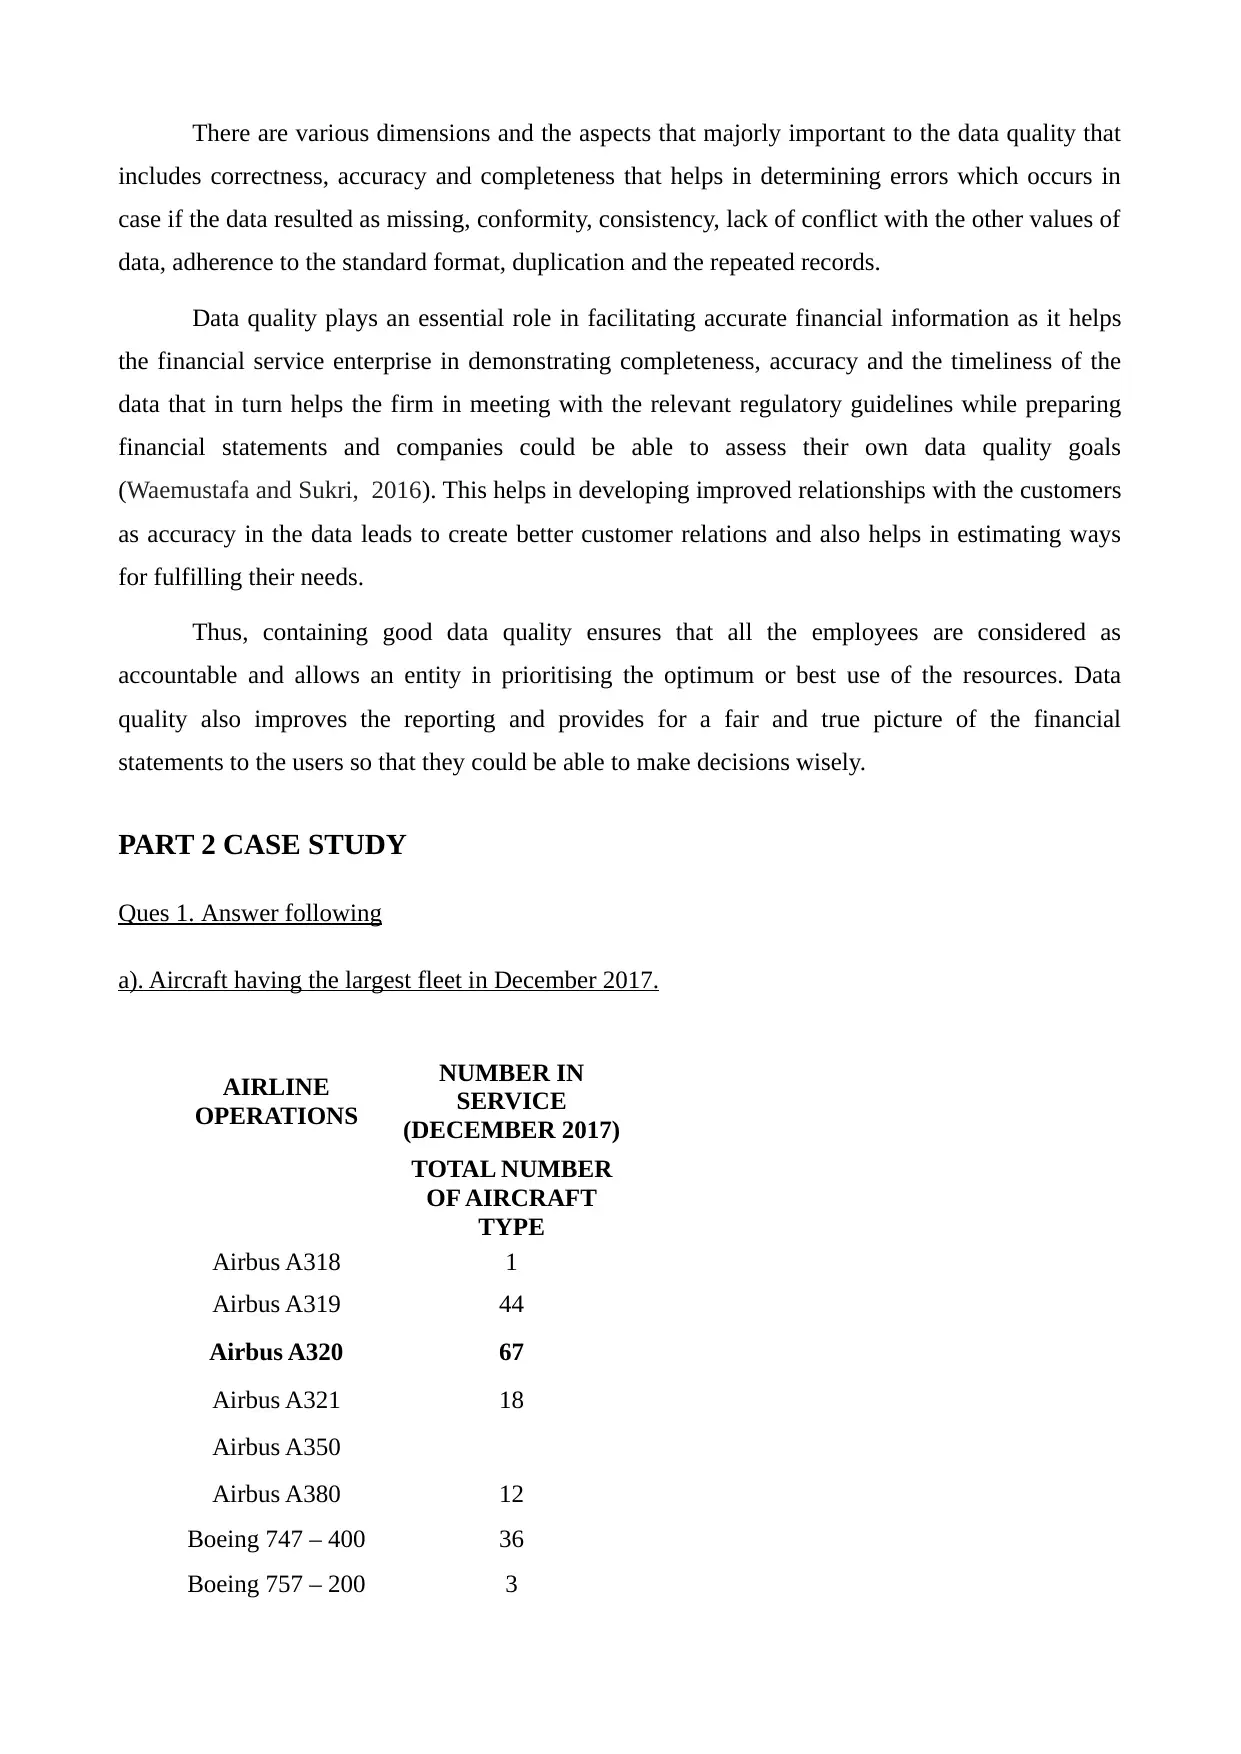
a). Aircraft having the largest fleet in December 2017.
AIRLINE
OPERATIONS
NUMBER IN
SERVICE
(DECEMBER 2017)
TOTAL NUMBER
OF AIRCRAFT
TYPE
Airbus A318 1
Airbus A319 44
Airbus A320 67
Airbus A321 18
Airbus A350
Airbus A380 12
Boeing 747 – 400 36
Boeing 757 – 200 3
includes correctness, accuracy and completeness that helps in determining errors which occurs in
case if the data resulted as missing, conformity, consistency, lack of conflict with the other values of
data, adherence to the standard format, duplication and the repeated records.
Data quality plays an essential role in facilitating accurate financial information as it helps
the financial service enterprise in demonstrating completeness, accuracy and the timeliness of the
data that in turn helps the firm in meeting with the relevant regulatory guidelines while preparing
financial statements and companies could be able to assess their own data quality goals
(Waemustafa and Sukri, 2016). This helps in developing improved relationships with the customers
as accuracy in the data leads to create better customer relations and also helps in estimating ways
for fulfilling their needs.
Thus, containing good data quality ensures that all the employees are considered as
accountable and allows an entity in prioritising the optimum or best use of the resources. Data
quality also improves the reporting and provides for a fair and true picture of the financial
statements to the users so that they could be able to make decisions wisely.
PART 2 CASE STUDY
Ques 1. Answer following
a). Aircraft having the largest fleet in December 2017.
AIRLINE
OPERATIONS
NUMBER IN
SERVICE
(DECEMBER 2017)
TOTAL NUMBER
OF AIRCRAFT
TYPE
Airbus A318 1
Airbus A319 44
Airbus A320 67
Airbus A321 18
Airbus A350
Airbus A380 12
Boeing 747 – 400 36
Boeing 757 – 200 3
⊘ This is a preview!⊘
Do you want full access?
Subscribe today to unlock all pages.
Trusted by 1+ million students worldwide
Boeing 767 – 300 8
Boeing 777 – 200 46
Boeing 777 – 300 12
Boeing 787 – 8 9
Boeing 787 – 9 16
Boeing 787 – 10
Embraer E170 6
Embraer E190 15
Maximum 67
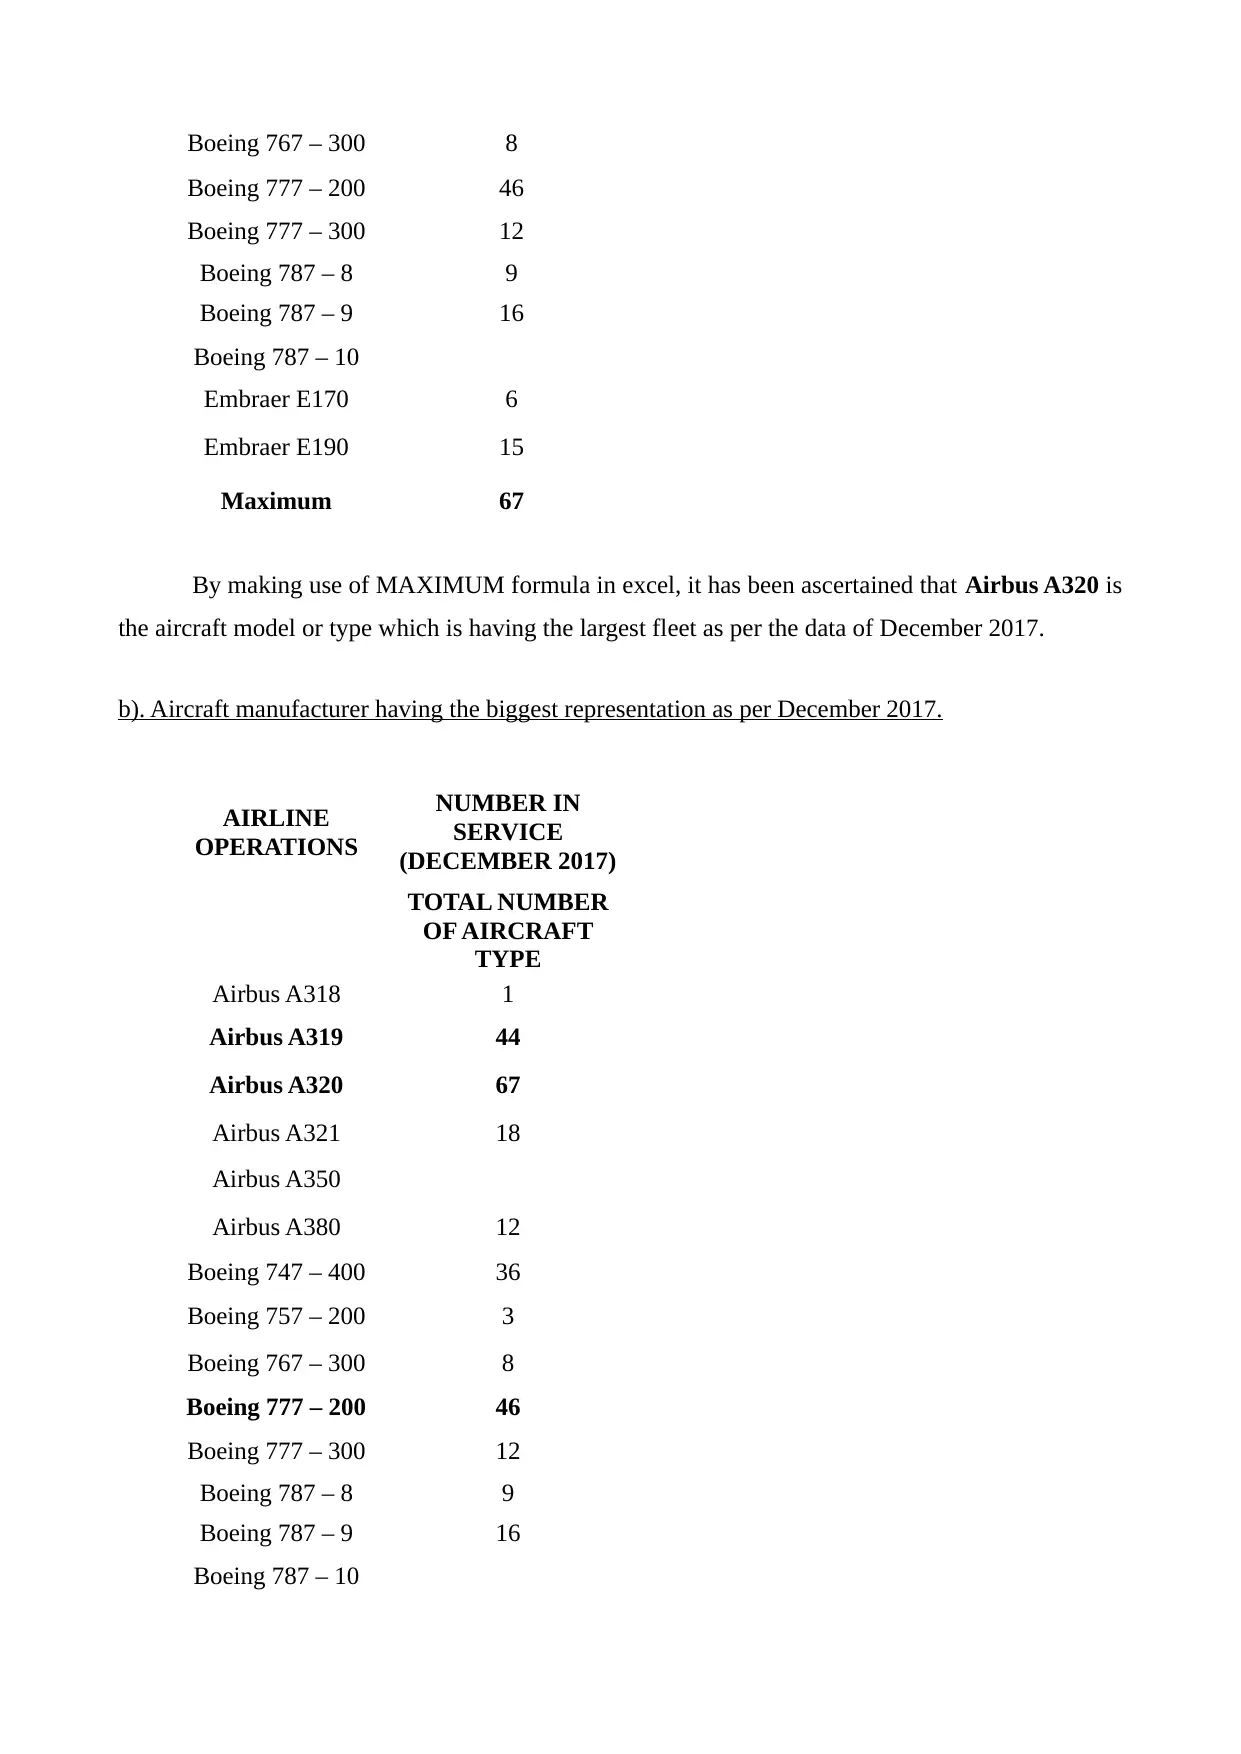
By making use of MAXIMUM formula in excel, it has been ascertained that Airbus A320 is
the aircraft model or type which is having the largest fleet as per the data of December 2017.
b). Aircraft manufacturer having the biggest representation as per December 2017.
AIRLINE
OPERATIONS
NUMBER IN
SERVICE
(DECEMBER 2017)
TOTAL NUMBER
OF AIRCRAFT
TYPE
Airbus A318 1
Airbus A319 44
Airbus A320 67
Airbus A321 18
Airbus A350
Airbus A380 12
Boeing 747 – 400 36
Boeing 757 – 200 3
Boeing 767 – 300 8
Boeing 777 – 200 46
Boeing 777 – 300 12
Boeing 787 – 8 9
Boeing 787 – 9 16
Boeing 787 – 10
Boeing 777 – 200 46
Boeing 777 – 300 12
Boeing 787 – 8 9
Boeing 787 – 9 16
Boeing 787 – 10
Embraer E170 6
Embraer E190 15
Maximum 67
By making use of MAXIMUM formula in excel, it has been ascertained that Airbus A320 is
the aircraft model or type which is having the largest fleet as per the data of December 2017.
b). Aircraft manufacturer having the biggest representation as per December 2017.
AIRLINE
OPERATIONS
NUMBER IN
SERVICE
(DECEMBER 2017)
TOTAL NUMBER
OF AIRCRAFT
TYPE
Airbus A318 1
Airbus A319 44
Airbus A320 67
Airbus A321 18
Airbus A350
Airbus A380 12
Boeing 747 – 400 36
Boeing 757 – 200 3
Boeing 767 – 300 8
Boeing 777 – 200 46
Boeing 777 – 300 12
Boeing 787 – 8 9
Boeing 787 – 9 16
Boeing 787 – 10
Paraphrase This Document
Need a fresh take? Get an instant paraphrase of this document with our AI Paraphraser
Embraer E170 6
Embraer E190 15
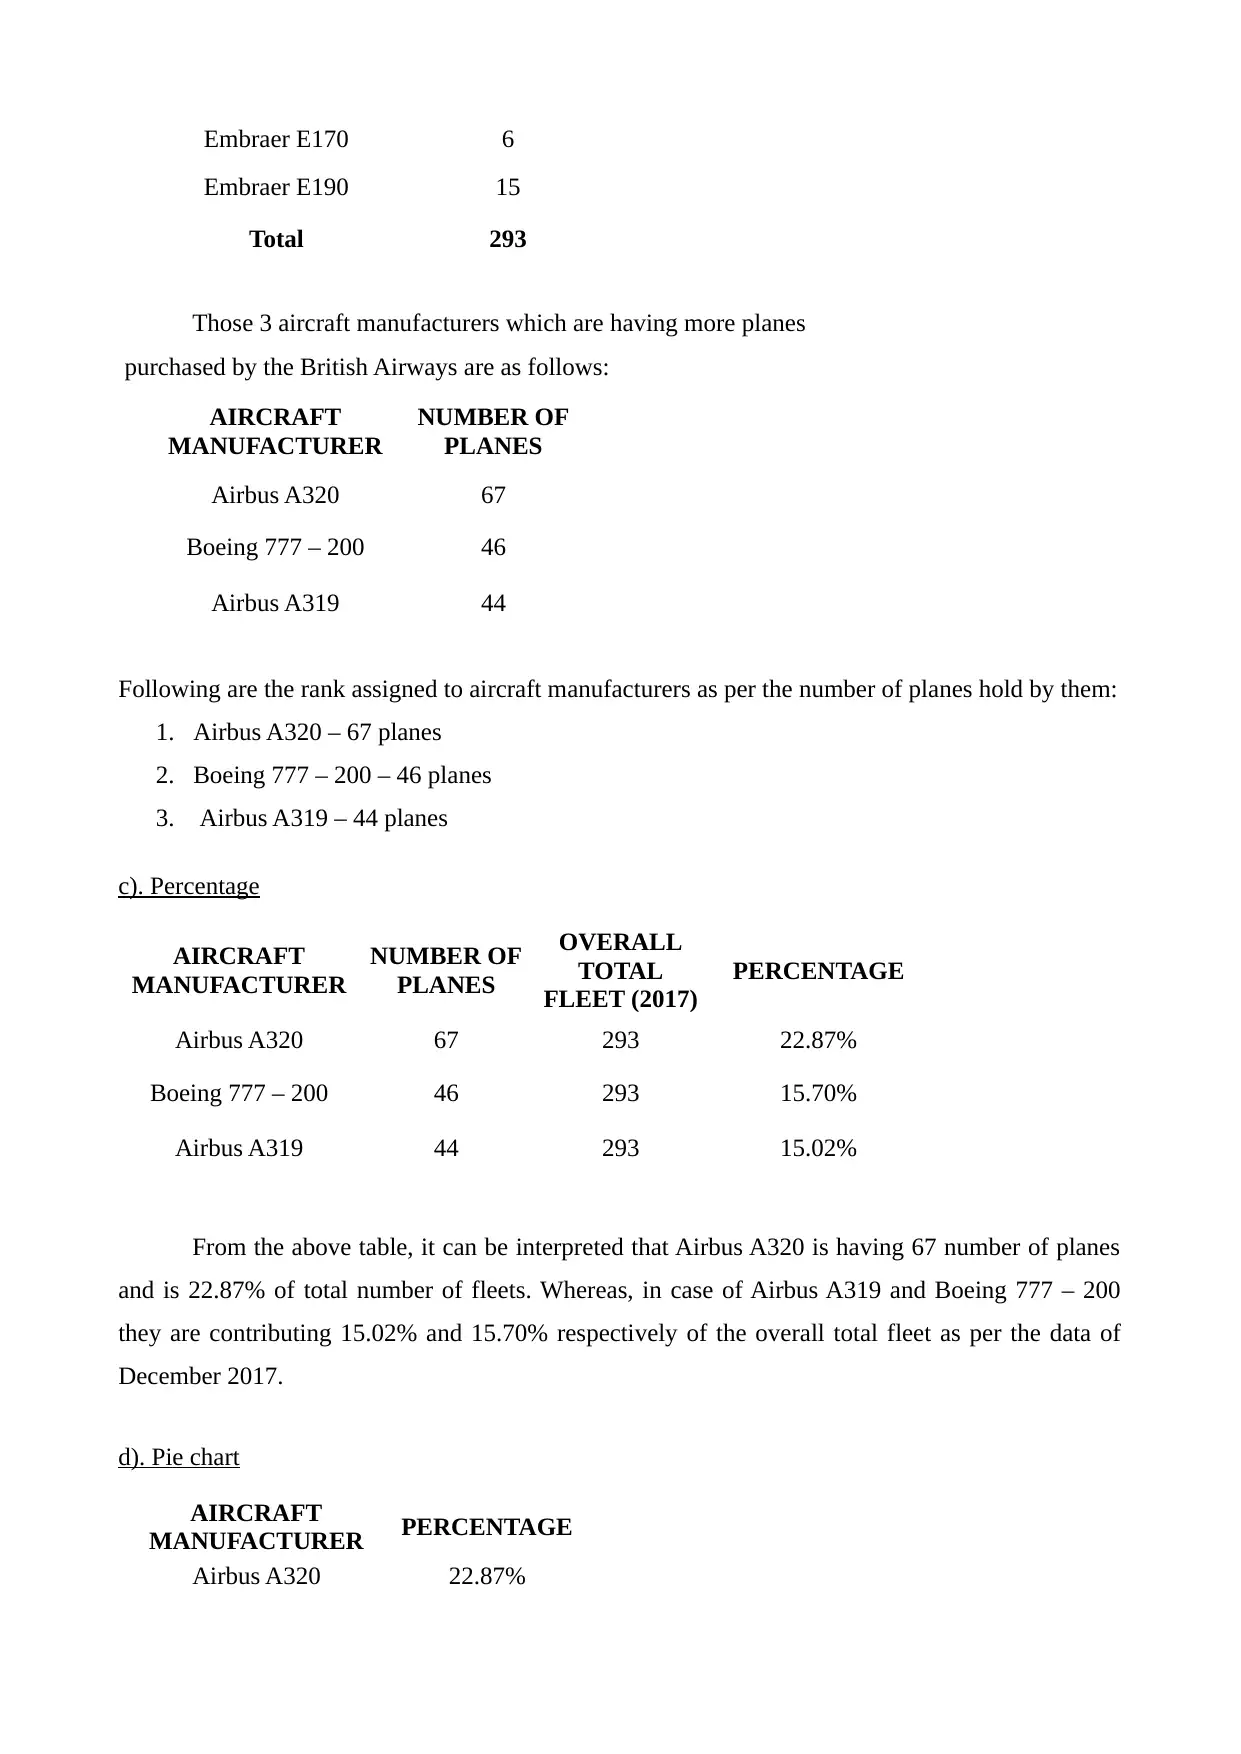
Total 293
Those 3 aircraft manufacturers which are having more planes
purchased by the British Airways are as follows:
AIRCRAFT
MANUFACTURER
NUMBER OF
PLANES
Airbus A320 67
Boeing 777 – 200 46
Airbus A319 44
Following are the rank assigned to aircraft manufacturers as per the number of planes hold by them:
1. Airbus A320 – 67 planes
2. Boeing 777 – 200 – 46 planes
3. Airbus A319 – 44 planes
c). Percentage
AIRCRAFT
MANUFACTURER
NUMBER OF
PLANES
OVERALL
TOTAL
FLEET (2017)
PERCENTAGE
Airbus A320 67 293 22.87%
Boeing 777 – 200 46 293 15.70%
Airbus A319 44 293 15.02%
From the above table, it can be interpreted that Airbus A320 is having 67 number of planes
and is 22.87% of total number of fleets. Whereas, in case of Airbus A319 and Boeing 777 – 200
they are contributing 15.02% and 15.70% respectively of the overall total fleet as per the data of
December 2017.
d). Pie chart
AIRCRAFT
MANUFACTURER PERCENTAGE
Airbus A320 22.87%
Embraer E190 15
Total 293
Those 3 aircraft manufacturers which are having more planes
purchased by the British Airways are as follows:
AIRCRAFT
MANUFACTURER
NUMBER OF
PLANES
Airbus A320 67
Boeing 777 – 200 46
Airbus A319 44
Following are the rank assigned to aircraft manufacturers as per the number of planes hold by them:
1. Airbus A320 – 67 planes
2. Boeing 777 – 200 – 46 planes
3. Airbus A319 – 44 planes
c). Percentage
AIRCRAFT
MANUFACTURER
NUMBER OF
PLANES
OVERALL
TOTAL
FLEET (2017)
PERCENTAGE
Airbus A320 67 293 22.87%
Boeing 777 – 200 46 293 15.70%
Airbus A319 44 293 15.02%
From the above table, it can be interpreted that Airbus A320 is having 67 number of planes
and is 22.87% of total number of fleets. Whereas, in case of Airbus A319 and Boeing 777 – 200
they are contributing 15.02% and 15.70% respectively of the overall total fleet as per the data of
December 2017.
d). Pie chart
AIRCRAFT
MANUFACTURER PERCENTAGE
Airbus A320 22.87%
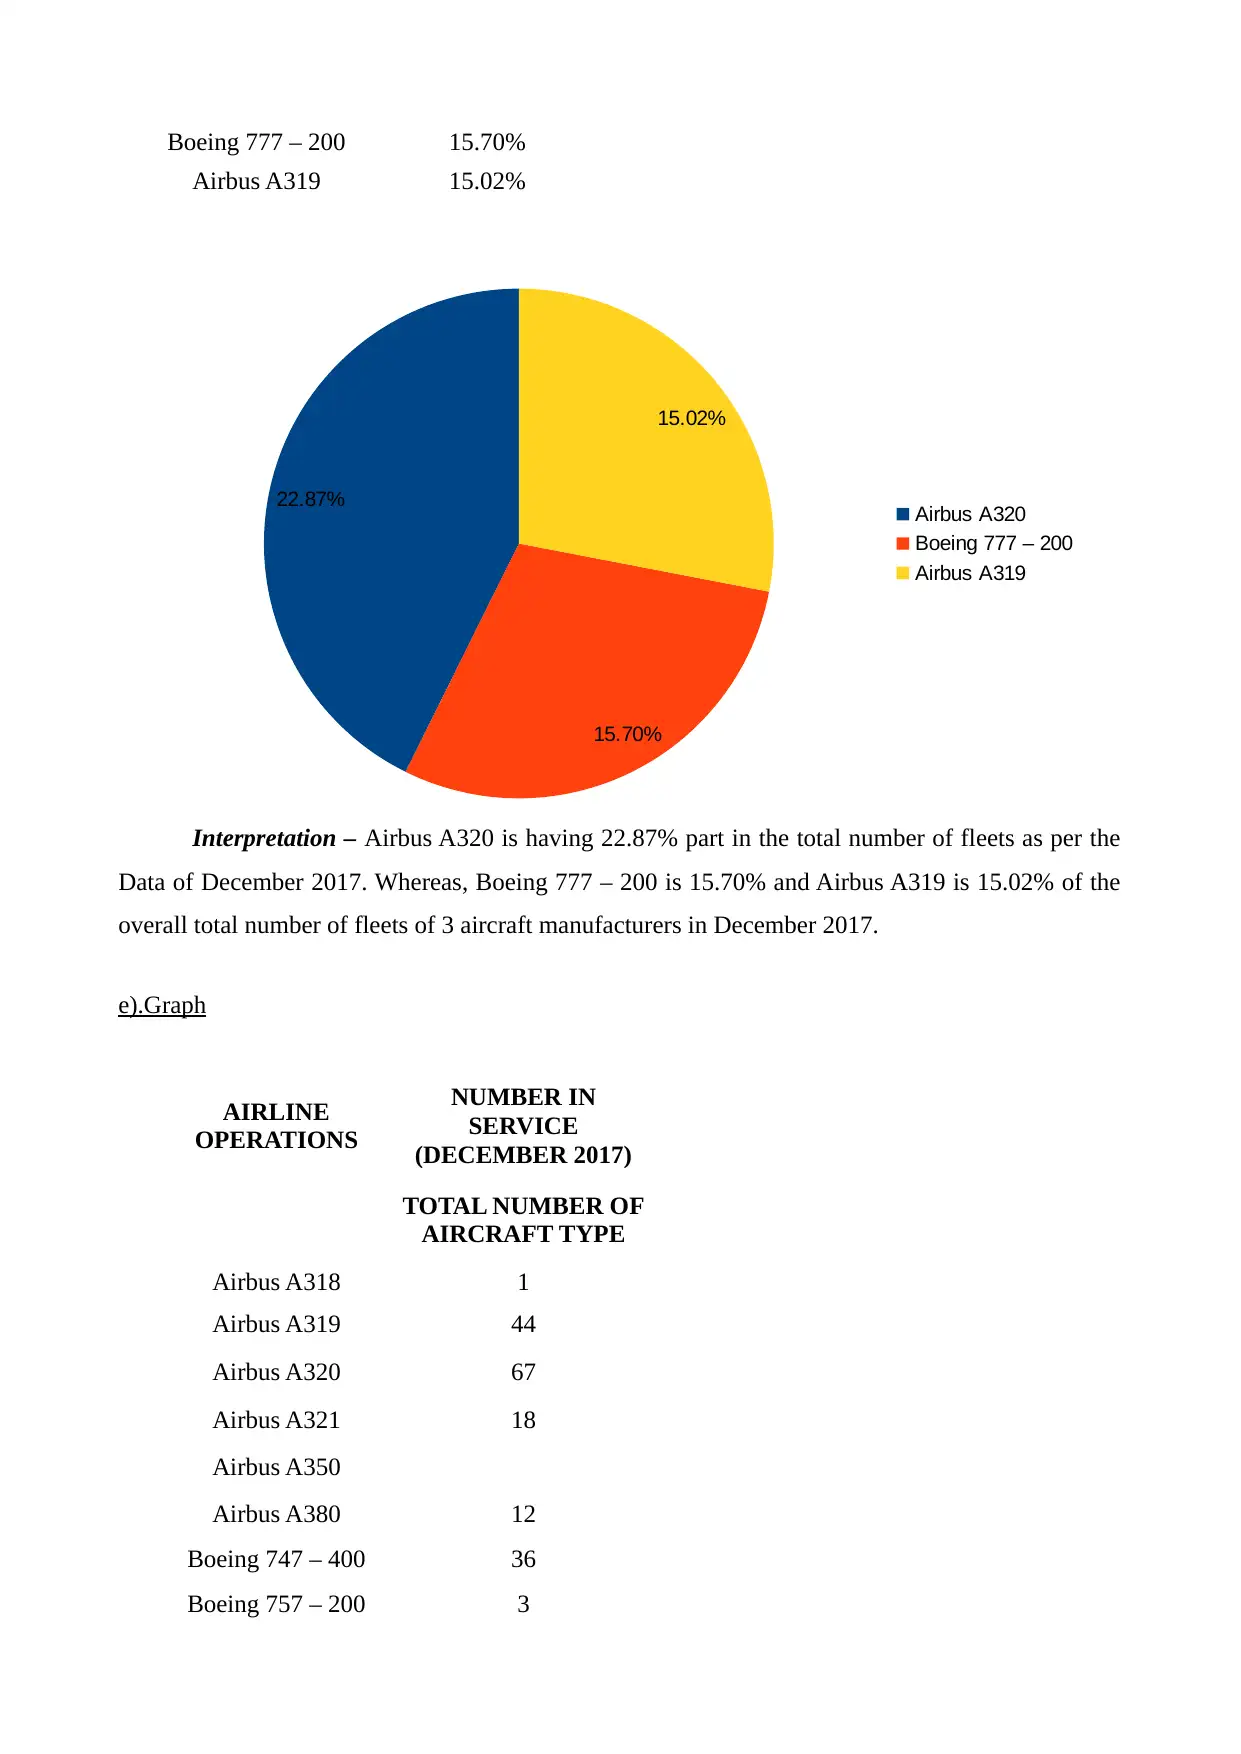
Boeing 777 – 200 15.70%
Airbus A319 15.02%
Interpretation – Airbus A320 is having 22.87% part in the total number of fleets as per the
Data of December 2017. Whereas, Boeing 777 – 200 is 15.70% and Airbus A319 is 15.02% of the
overall total number of fleets of 3 aircraft manufacturers in December 2017.
e).Graph
AIRLINE
OPERATIONS
NUMBER IN
SERVICE
(DECEMBER 2017)
TOTAL NUMBER OF
AIRCRAFT TYPE
Airbus A318 1
Airbus A319 44
Airbus A320 67
Airbus A321 18
Airbus A350
Airbus A380 12
Boeing 747 – 400 36
Boeing 757 – 200 3
22.87%
15.70%
15.02%
Airbus A320
Boeing 777 – 200
Airbus A319
⊘ This is a preview!⊘
Do you want full access?
Subscribe today to unlock all pages.
Trusted by 1+ million students worldwide
Boeing 767 – 300 8
Boeing 777 – 200 46
Boeing 777 – 300 12
Boeing 787 – 8 9
Boeing 787 – 9 16
Boeing 787 – 10
Embraer E170 6
Embraer E190 15
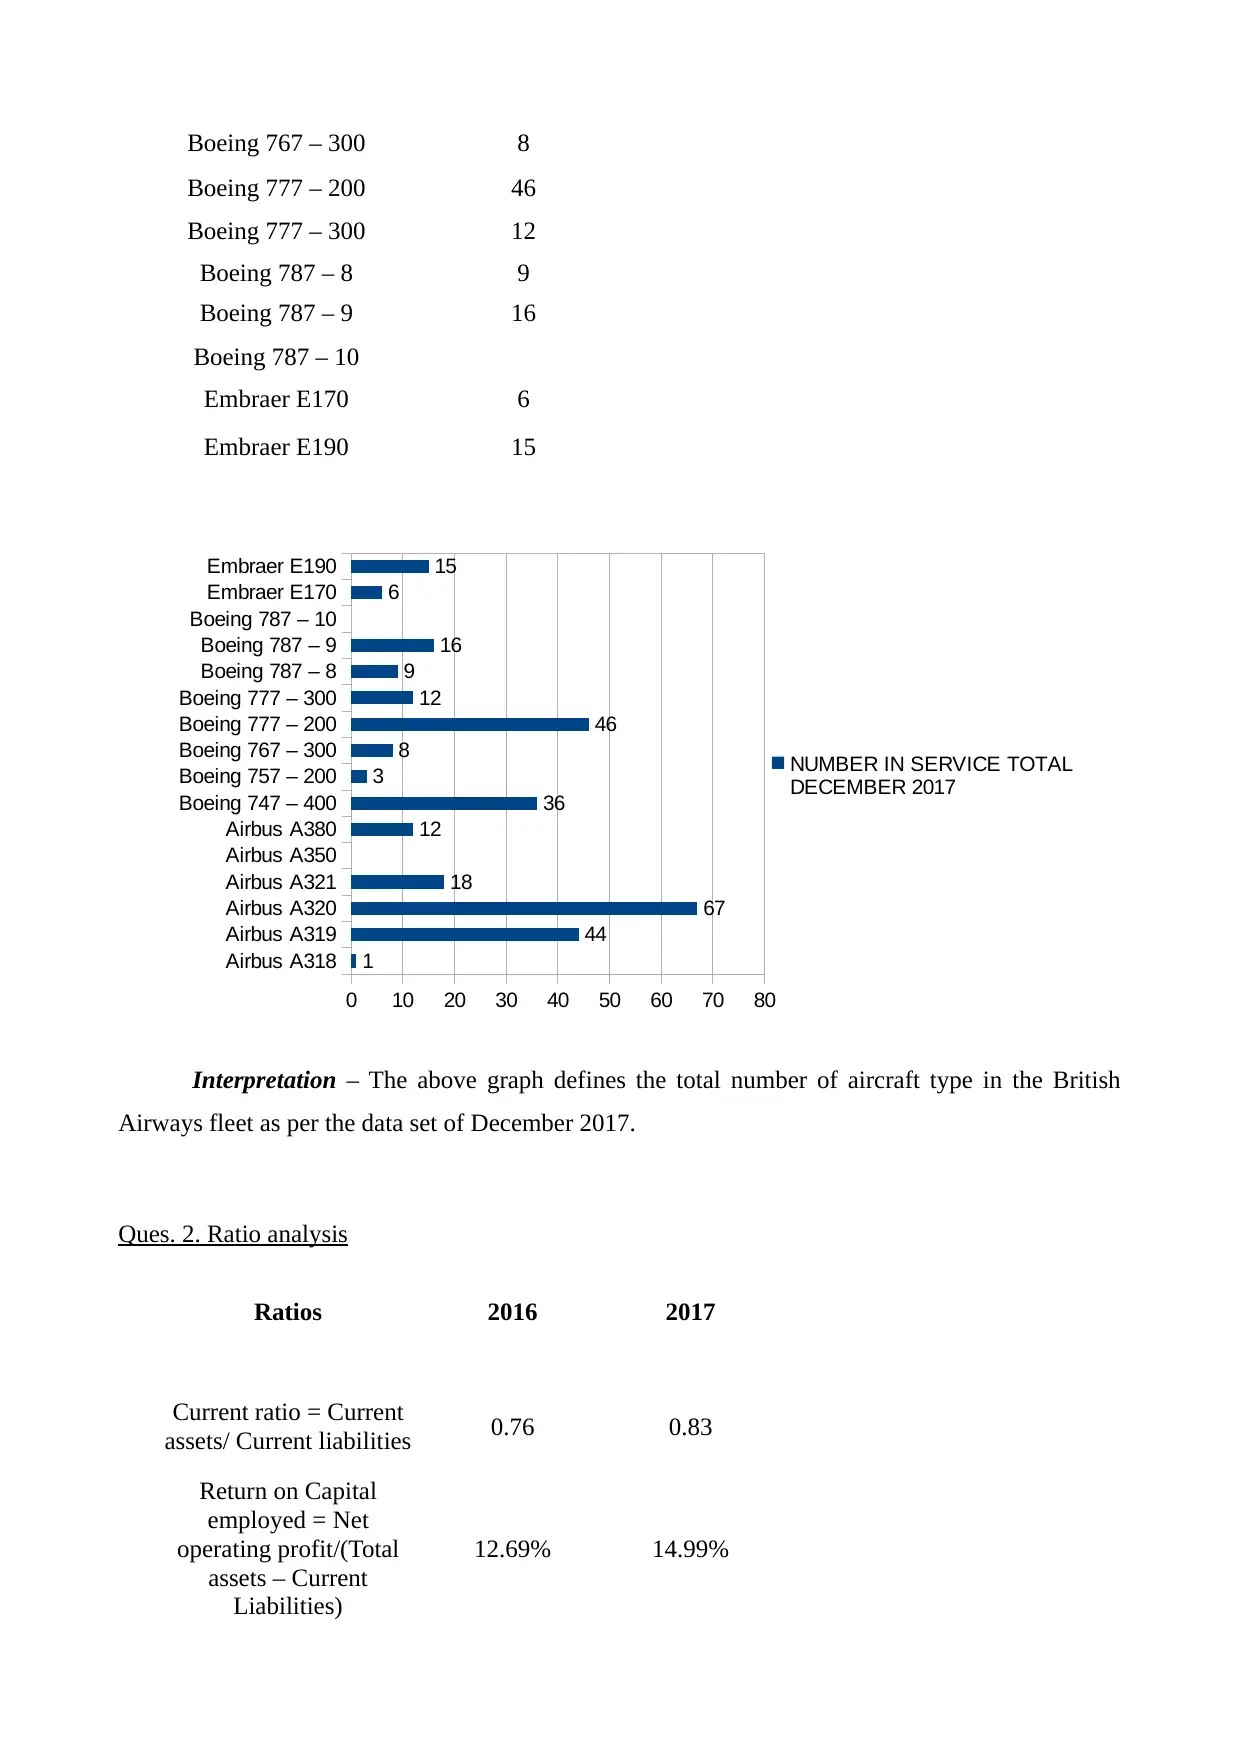
Interpretation – The above graph defines the total number of aircraft type in the British
Airways fleet as per the data set of December 2017.
Ques. 2. Ratio analysis
Ratios 2016 2017
Current ratio = Current
assets/ Current liabilities 0.76 0.83
Return on Capital
employed = Net
operating profit/(Total
assets – Current
Liabilities)
12.69% 14.99%
Airbus A318
Airbus A319
Airbus A320
Airbus A321
Airbus A350
Airbus A380
Boeing 747 – 400
Boeing 757 – 200
Boeing 767 – 300
Boeing 777 – 200
Boeing 777 – 300
Boeing 787 – 8
Boeing 787 – 9
Boeing 787 – 10
Embraer E170
Embraer E190
0 10 20 30 40 50 60 70 80
1
44
67
18
12
36
3
8
46
12
9
16
6
15
NUMBER IN SERVICE TOTAL
DECEMBER 2017
Boeing 777 – 200 46
Boeing 777 – 300 12
Boeing 787 – 8 9
Boeing 787 – 9 16
Boeing 787 – 10
Embraer E170 6
Embraer E190 15
Interpretation – The above graph defines the total number of aircraft type in the British
Airways fleet as per the data set of December 2017.
Ques. 2. Ratio analysis
Ratios 2016 2017
Current ratio = Current
assets/ Current liabilities 0.76 0.83
Return on Capital
employed = Net
operating profit/(Total
assets – Current
Liabilities)
12.69% 14.99%
Airbus A318
Airbus A319
Airbus A320
Airbus A321
Airbus A350
Airbus A380
Boeing 747 – 400
Boeing 757 – 200
Boeing 767 – 300
Boeing 777 – 200
Boeing 777 – 300
Boeing 787 – 8
Boeing 787 – 9
Boeing 787 – 10
Embraer E170
Embraer E190
0 10 20 30 40 50 60 70 80
1
44
67
18
12
36
3
8
46
12
9
16
6
15
NUMBER IN SERVICE TOTAL
DECEMBER 2017
Paraphrase This Document
Need a fresh take? Get an instant paraphrase of this document with our AI Paraphraser
Return on Equity = Net
income/ Shareholders
equity
103.01% 104.48%
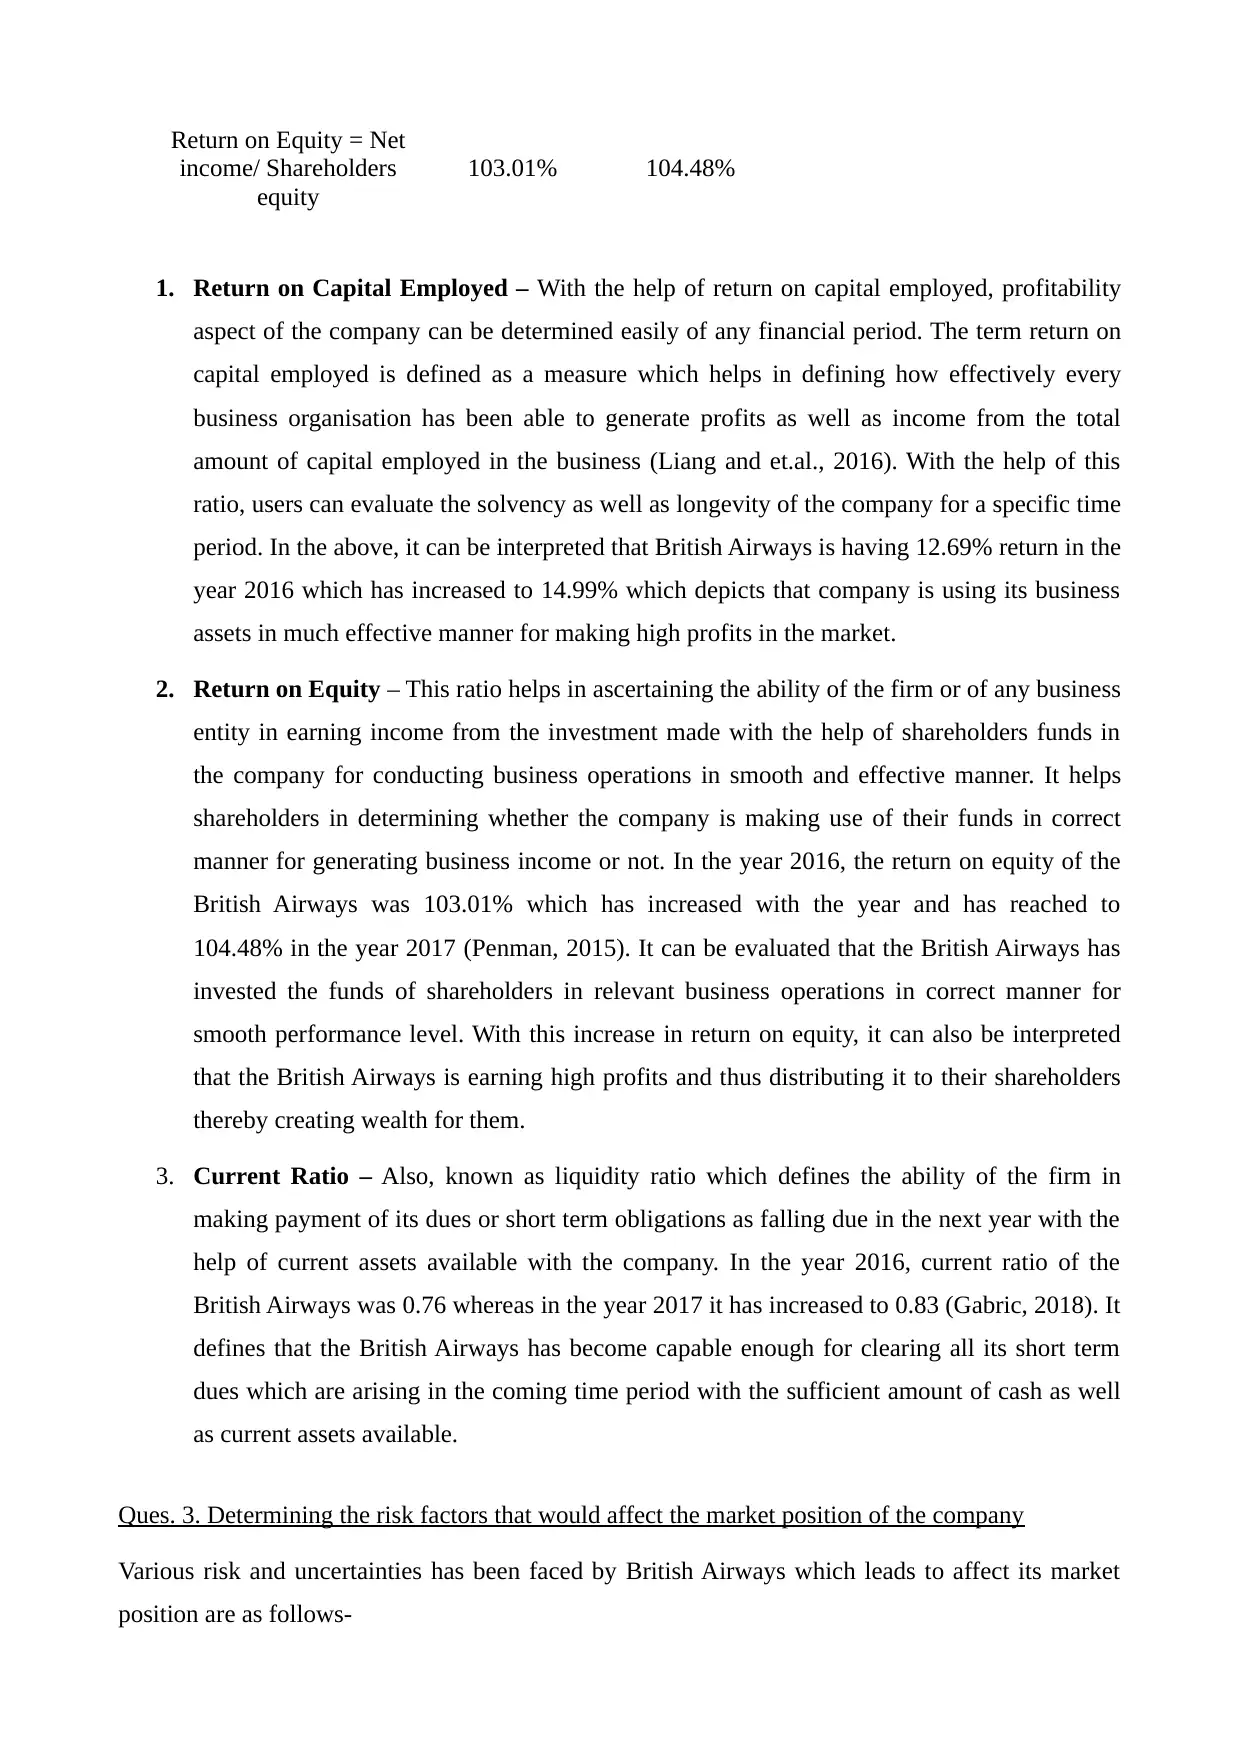
1. Return on Capital Employed – With the help of return on capital employed, profitability
aspect of the company can be determined easily of any financial period. The term return on
capital employed is defined as a measure which helps in defining how effectively every
business organisation has been able to generate profits as well as income from the total
amount of capital employed in the business (Liang and et.al., 2016). With the help of this
ratio, users can evaluate the solvency as well as longevity of the company for a specific time
period. In the above, it can be interpreted that British Airways is having 12.69% return in the
year 2016 which has increased to 14.99% which depicts that company is using its business
assets in much effective manner for making high profits in the market.
2. Return on Equity – This ratio helps in ascertaining the ability of the firm or of any business
entity in earning income from the investment made with the help of shareholders funds in
the company for conducting business operations in smooth and effective manner. It helps
shareholders in determining whether the company is making use of their funds in correct
manner for generating business income or not. In the year 2016, the return on equity of the
British Airways was 103.01% which has increased with the year and has reached to
104.48% in the year 2017 (Penman, 2015). It can be evaluated that the British Airways has
invested the funds of shareholders in relevant business operations in correct manner for
smooth performance level. With this increase in return on equity, it can also be interpreted
that the British Airways is earning high profits and thus distributing it to their shareholders
thereby creating wealth for them.
3. Current Ratio – Also, known as liquidity ratio which defines the ability of the firm in
making payment of its dues or short term obligations as falling due in the next year with the
help of current assets available with the company. In the year 2016, current ratio of the
British Airways was 0.76 whereas in the year 2017 it has increased to 0.83 (Gabric, 2018). It
defines that the British Airways has become capable enough for clearing all its short term
dues which are arising in the coming time period with the sufficient amount of cash as well
as current assets available.
Ques. 3. Determining the risk factors that would affect the market position of the company
Various risk and uncertainties has been faced by British Airways which leads to affect its market
position are as follows-
income/ Shareholders
equity
103.01% 104.48%
1. Return on Capital Employed – With the help of return on capital employed, profitability
aspect of the company can be determined easily of any financial period. The term return on
capital employed is defined as a measure which helps in defining how effectively every
business organisation has been able to generate profits as well as income from the total
amount of capital employed in the business (Liang and et.al., 2016). With the help of this
ratio, users can evaluate the solvency as well as longevity of the company for a specific time
period. In the above, it can be interpreted that British Airways is having 12.69% return in the
year 2016 which has increased to 14.99% which depicts that company is using its business
assets in much effective manner for making high profits in the market.
2. Return on Equity – This ratio helps in ascertaining the ability of the firm or of any business
entity in earning income from the investment made with the help of shareholders funds in
the company for conducting business operations in smooth and effective manner. It helps
shareholders in determining whether the company is making use of their funds in correct
manner for generating business income or not. In the year 2016, the return on equity of the
British Airways was 103.01% which has increased with the year and has reached to
104.48% in the year 2017 (Penman, 2015). It can be evaluated that the British Airways has
invested the funds of shareholders in relevant business operations in correct manner for
smooth performance level. With this increase in return on equity, it can also be interpreted
that the British Airways is earning high profits and thus distributing it to their shareholders
thereby creating wealth for them.
3. Current Ratio – Also, known as liquidity ratio which defines the ability of the firm in
making payment of its dues or short term obligations as falling due in the next year with the
help of current assets available with the company. In the year 2016, current ratio of the
British Airways was 0.76 whereas in the year 2017 it has increased to 0.83 (Gabric, 2018). It
defines that the British Airways has become capable enough for clearing all its short term
dues which are arising in the coming time period with the sufficient amount of cash as well
as current assets available.
Ques. 3. Determining the risk factors that would affect the market position of the company
Various risk and uncertainties has been faced by British Airways which leads to affect its market
position are as follows-
Brand reputation- British Airways contains a significant commercial value and erosion of
brand due to a single event or the series of an event might adversely affects the companies
leadership position with their customers and this ultimately affects the future revenues and the
profitability of an enterprise (Yeoh and Popovič, 2016). If British Airways could not be able to
meet needs of their customers and does not engage effectively in maintaining an emotional
attachment towards their brand, then it might face erosion of its brand and will be losing a huge
market share.
Competition- As British Airways functions its business in a highly competitive market as
direct competition on all their routes that is from indirect flights to charter services. Due to this, the
company needs to operate its business in an effective manner or must faces the growth of
competitive capacity greater than the demand growth, this materially affected their margins (Ting,
Cheung, and Wong, 2016). British Airways has consistently sought for addressing various risk that
are created through intense competition such as strong market reputation, alliances, diverse
customer base, leadership in the strategic markets etc.
Digital disruption- It involves risk relating to more effective use of digital technology by the
new entrant or the competitors disrupted their business model (Shrivastava and Rathod, 2015). In
order to overcome this risk, British Airways had emphasized on customers along with the
exploitation of their digital reduces the influence of the digital disrupters.
Deregulation- This factor relates to the merger and acquisition that had been taken place
among their competitors leads to affect the market position and the revenue of the company. The
group had maintained rigorous control over the cost and the investment in the targeted product for
remaining competitive. For overcoming this risk, British Airways maintained a leading presence in
the world for ensuring that alliance attracts and retain right members which is counted as key aspect
on the ongoing development of network.
Government intervention- Regulation made by the government in context of the Airline
Industry includes many of their activities such as right of airport landing, right of route flying,
departure taxes, security controls etc (Waemustafa and Sukri, 2016). Excessive taxes and the
increases within a regulation might impact on the operational and the financial performance of
British Airways. Imposition of the Air passenger duty resulted a negative effect on the market
position of the company.
Infrastructure constraints- British Airways is highly dependent on and may get affected by
the infrastructure decisions or the changes in the policy by the governments, other entities and the
regulators that in turn resulted a great impact on their operations. With respect to infrastructure
constraint, the operating cost of British Airways tend to increase as it had to pay Airport, landing
⊘ This is a preview!⊘
Do you want full access?
Subscribe today to unlock all pages.
Trusted by 1+ million students worldwide
1 out of 16
Related Documents


Your All-in-One AI-Powered Toolkit for Academic Success.
+13062052269
info@desklib.com
Available 24*7 on WhatsApp / Email
![[object Object]](/_next/static/media/star-bottom.7253800d.svg)
Unlock your academic potential
Copyright © 2020–2026 A2Z Services. All Rights Reserved. Developed and managed by ZUCOL.