Statistics for Management: Data Analysis & Business Planning Report
VerifiedAdded on 2023/06/09
|19
|4912
|178
Report
AI Summary
This report provides an analysis of statistical methods for management, focusing on their application in business planning using Morrison as a case study. It discusses the nature of economic and business data, including qualitative and quantitative analysis techniques. The report evaluates raw business data using descriptive and inferential statistics, including regression analysis and ANOVA, to assess the relationship between variables like sales revenue and marketing costs. It also examines the use of charts and tables for communicating findings, differentiating between descriptive and inferential statistics, and ultimately aims to provide insights into how statistical methods inform business decisions related to inventory, quality, and capacity management. Desklib offers similar solved assignments and past papers for students.
Unit 31 Statistics for
Management
Management
Paraphrase This Document
Need a fresh take? Get an instant paraphrase of this document with our AI Paraphraser
Table of Contents
INTRODUCTION...........................................................................................................................2
MAIN BODY..................................................................................................................................2
P1.................................................................................................................................................2
P2.................................................................................................................................................4
M1................................................................................................................................................5
D1................................................................................................................................................5
P3 Analysis and evaluation of qualitative and quantitative raw business data using appropriate
statistical method.........................................................................................................................6
M2................................................................................................................................................8
P4 Application of different range of statistical method in Morrison’s business planning..........9
P5 Communicating findings for a number of variables using appropriate charts or tables.......12
M3..............................................................................................................................................14
M4..............................................................................................................................................15
D3..............................................................................................................................................15
CONCLUSION..............................................................................................................................16
REFERENCES..............................................................................................................................17
1
INTRODUCTION
The statistical for management is referred as analysis of data and it helps in provide the
frameworks for analysing the data, organizing data as well as also helps in examine the business
problems in the systematic and logical way. Morrison company is the largest supermarket chain
in the United Kingdom and retailer company serves to the customers across the United Kingdom.
It operates with the many stores under the company brands and associated activities. The report
will discuss the natures and process of economic and business data as well as elaborate the
variety of sources using the many methods of data analysis. This report will also evaluate the
quantitative and qualitative raw business data as well as apply the statistical methods which are
used in the business planning for inventory, quality and capacity management (Levin and Rubin,
2021). This will also elaborate the communicate finding with the tables and charts as well as
differentiate between the inferential and descriptive statistics.
MAIN BODY
P1
Natures of economic data
The economics data is measures the well-beings and financial health of company and
within the individual markets. The economics data can measure with the past measures. There
are various types of economic data such as cross-sectional data and time series data as well as
panel data which can be used for the estimate the business and economic data. There are various
nature of economic and business data such as data, wisdom, knowledge and information.
Data: The data are important and useful in the qualitative and quantitative analysis. It is
the piece of informational record and it used for the purpose of analysis on the basis of
quantitative and qualitative information. The purpose of the data in business with the
different types of data is analysed, collected, interpreted and presentation (Castillo-
Atoche, 2021). There are two process of data analysis such as presentation and
interpretations.
Wisdom: The wisdom are most important for the business data in the statistical methods
because it is the ability to combine the mathematical, methodological and domain
knowledge with the helps of understanding, experience, good judgements and experience
in order to make decision based on the data in the business and economics.
2
⊘ This is a preview!⊘
Do you want full access?
Subscribe today to unlock all pages.
Trusted by 1+ million students worldwide
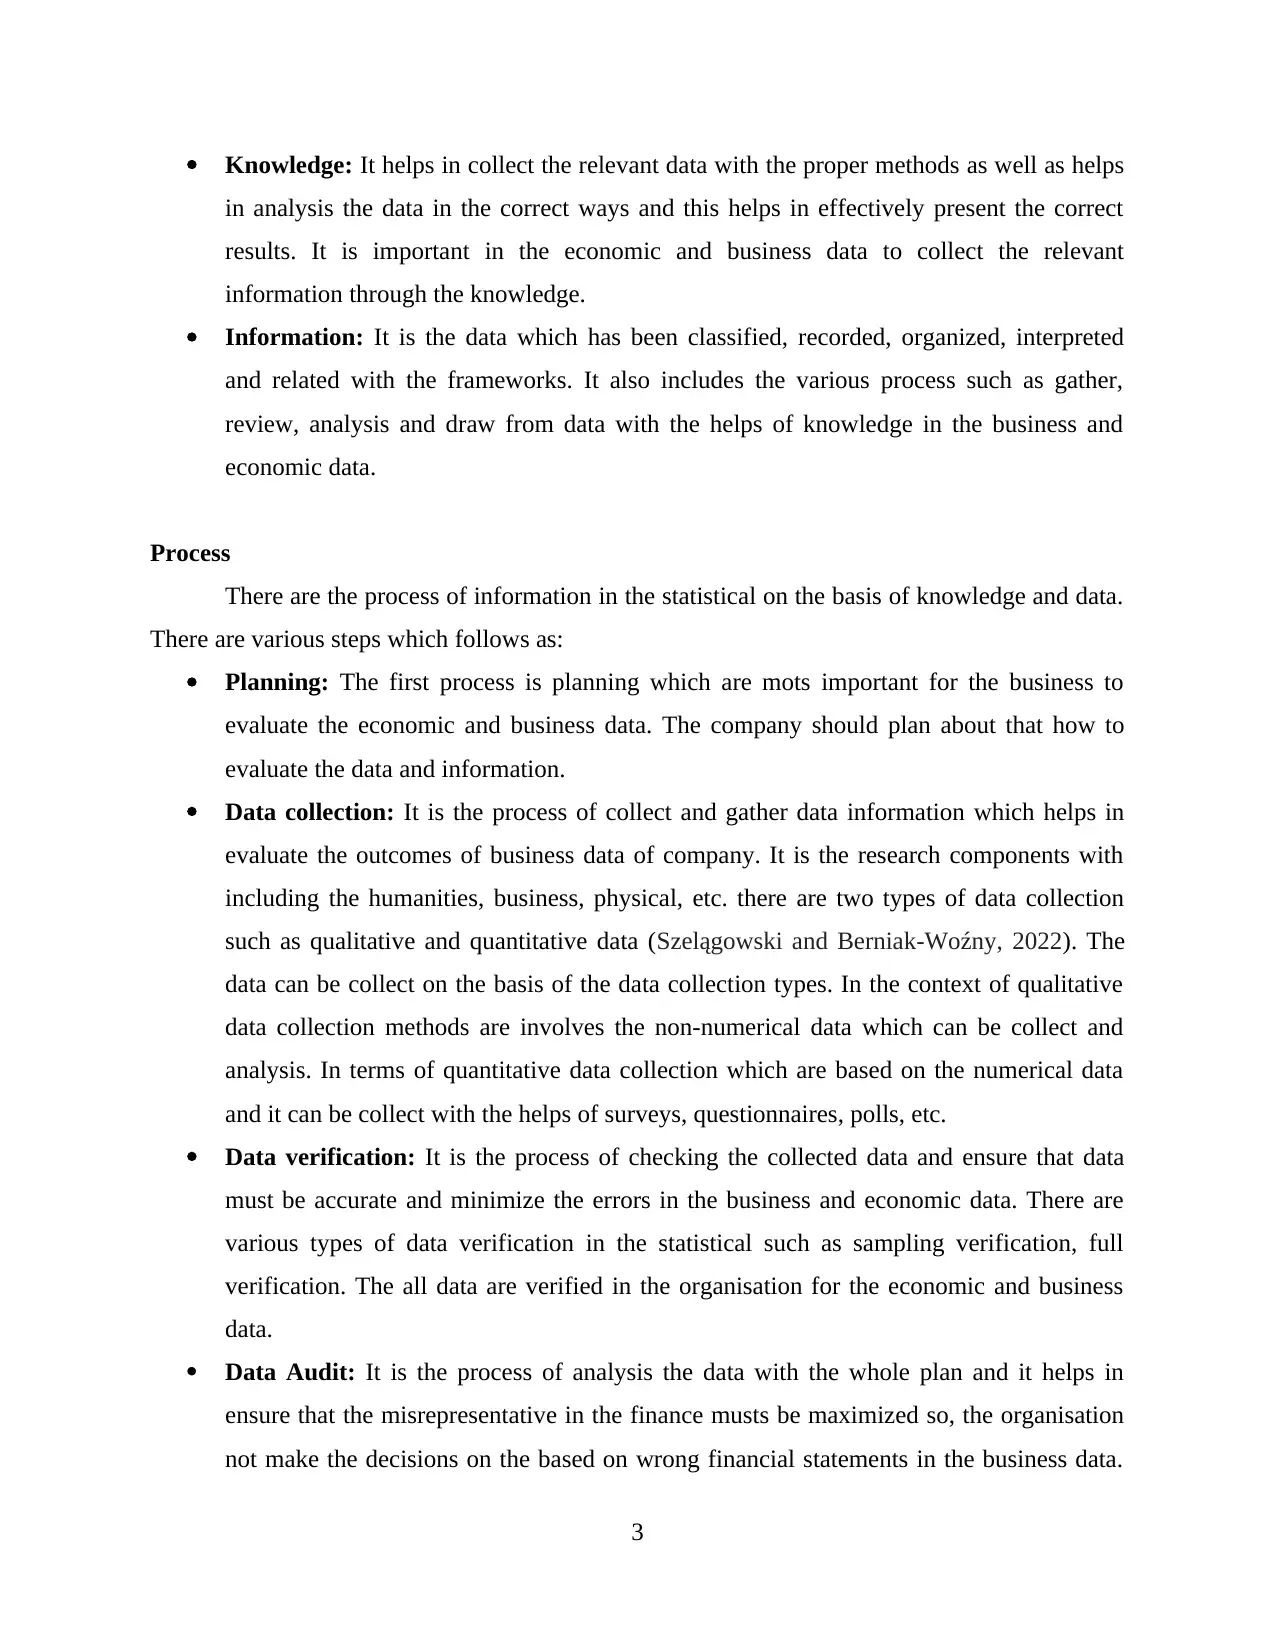
Knowledge: It helps in collect the relevant data with the proper methods as well as helps
in analysis the data in the correct ways and this helps in effectively present the correct
results. It is important in the economic and business data to collect the relevant
information through the knowledge.
Information: It is the data which has been classified, recorded, organized, interpreted
and related with the frameworks. It also includes the various process such as gather,
review, analysis and draw from data with the helps of knowledge in the business and
economic data.
Process
There are the process of information in the statistical on the basis of knowledge and data.
There are various steps which follows as:
Planning: The first process is planning which are mots important for the business to
evaluate the economic and business data. The company should plan about that how to
evaluate the data and information.
Data collection: It is the process of collect and gather data information which helps in
evaluate the outcomes of business data of company. It is the research components with
including the humanities, business, physical, etc. there are two types of data collection
such as qualitative and quantitative data (Szelągowski and Berniak‐Woźny, 2022). The
data can be collect on the basis of the data collection types. In the context of qualitative
data collection methods are involves the non-numerical data which can be collect and
analysis. In terms of quantitative data collection which are based on the numerical data
and it can be collect with the helps of surveys, questionnaires, polls, etc.
Data verification: It is the process of checking the collected data and ensure that data
must be accurate and minimize the errors in the business and economic data. There are
various types of data verification in the statistical such as sampling verification, full
verification. The all data are verified in the organisation for the economic and business
data.
Data Audit: It is the process of analysis the data with the whole plan and it helps in
ensure that the misrepresentative in the finance musts be maximized so, the organisation
not make the decisions on the based on wrong financial statements in the business data.
3
Paraphrase This Document
Need a fresh take? Get an instant paraphrase of this document with our AI Paraphraser
There are various process to conduct the data audit such as find out what the company
have, find out where it is, interview key players, priorities and organize and then track
that how the data is evaluated.
P2
Data analysis is the techniques which involves the various activities such as organizing,
gathering the data. The main purpose of the data analysis is important for business purpose. It is
also known as the data analytics. There are various data which comes from the different
structures such as metadata, structured data, big data and real time data. The data analysis
methods in the business are based on the facts, metrics and figures (Mishra, 2019). There are two
primary sources of data analysis such as quantitative data and qualitative data analysis
techniques.
Quantitative data analysis: The quantitative data involves the numerical variables such
as calculations, measurements, statistics and percentages and other data which are most
important in the quantitative data analysis. These techniques working with the
mathematical analysis tools and reveals the business values. In moreover, the company
can change the variables with the helps of financial data analyst as well as company van
evaluate the employees financial performance in future with the past data. It also
assesses the market data to help a company to set the competitive cost for its products.
Qualitative data analysis: These techniques is the non-numerical data and it can be used
in the various business processes. It is the part of the software developments process. In
the qualitative data analysis, the data can be analysis with the helps of conduct interview,
asking questions, different surveys and review documents (Assarroudi, 2018). In
moreover, In these types of sources, there information and data cannot be measured,
counted and expressed with numbers.
Exploratory data analysis: The exploratory data is mostly used by the data scientist and
the main aim of the exploratory data analysis techniques is helps in look at data before
making any assumptions in the business organization and it is the visual analysis. This
types of sources check with the helps of graphical representation and summary statistics
of Morrison company.
4
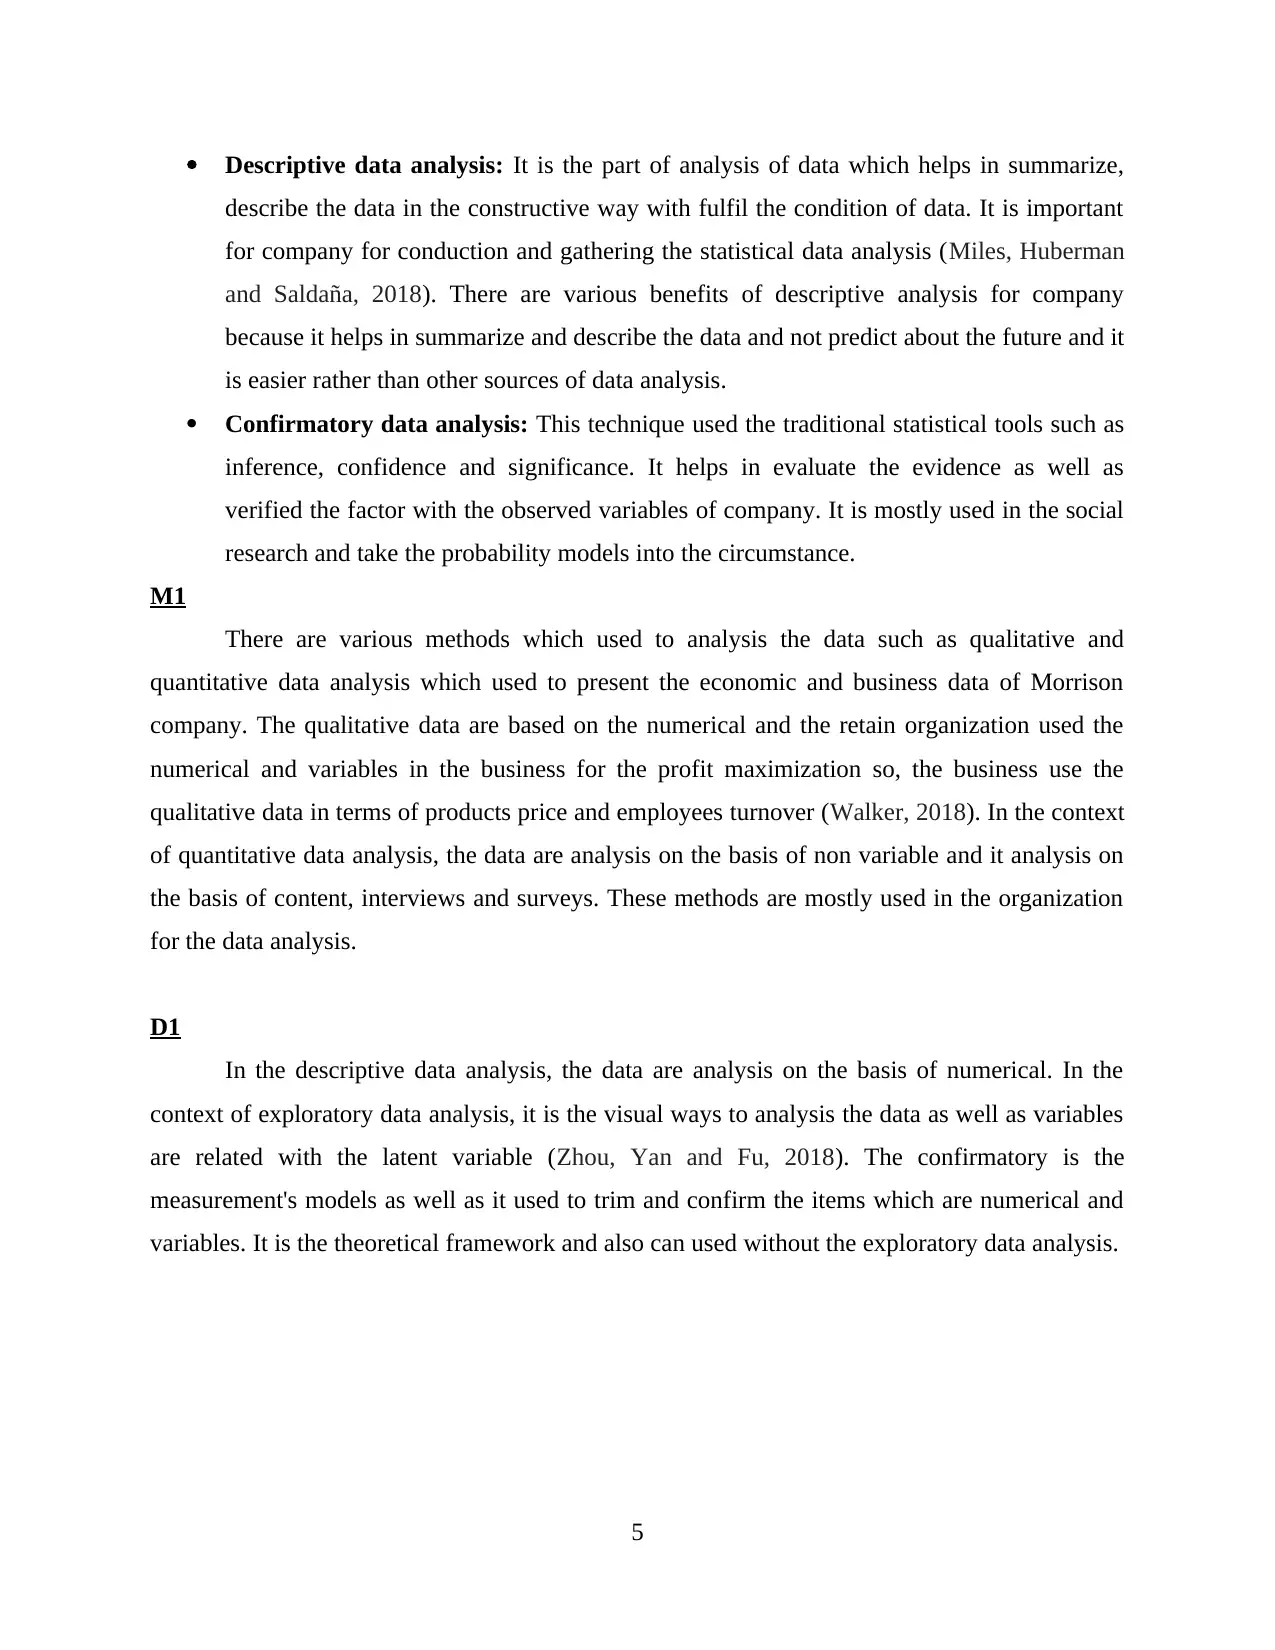
Descriptive data analysis: It is the part of analysis of data which helps in summarize,
describe the data in the constructive way with fulfil the condition of data. It is important
for company for conduction and gathering the statistical data analysis (Miles, Huberman
and Saldaña, 2018). There are various benefits of descriptive analysis for company
because it helps in summarize and describe the data and not predict about the future and it
is easier rather than other sources of data analysis.
Confirmatory data analysis: This technique used the traditional statistical tools such as
inference, confidence and significance. It helps in evaluate the evidence as well as
verified the factor with the observed variables of company. It is mostly used in the social
research and take the probability models into the circumstance.
M1
There are various methods which used to analysis the data such as qualitative and
quantitative data analysis which used to present the economic and business data of Morrison
company. The qualitative data are based on the numerical and the retain organization used the
numerical and variables in the business for the profit maximization so, the business use the
qualitative data in terms of products price and employees turnover (Walker, 2018). In the context
of quantitative data analysis, the data are analysis on the basis of non variable and it analysis on
the basis of content, interviews and surveys. These methods are mostly used in the organization
for the data analysis.
D1
In the descriptive data analysis, the data are analysis on the basis of numerical. In the
context of exploratory data analysis, it is the visual ways to analysis the data as well as variables
are related with the latent variable (Zhou, Yan and Fu, 2018). The confirmatory is the
measurement's models as well as it used to trim and confirm the items which are numerical and
variables. It is the theoretical framework and also can used without the exploratory data analysis.
5
⊘ This is a preview!⊘
Do you want full access?
Subscribe today to unlock all pages.
Trusted by 1+ million students worldwide
P3 Analysis and evaluation of qualitative and quantitative raw business data using appropriate
statistical method
There are two most important raw business data that helps the management of company in
business planning and performance management. These includes qualitative and quantitative raw
business data.
Qualitative Data: The qualitative is the descriptive and theoretical data which is basically
collected through questionnaire, interview and observations. For example, on the basis of the
survey conducted via means of questionnaire, it is identified that the employees of Morrison’s
company are highly satisfied with the work environment and culture of company. It is basically
identified through survey where 30 employees of Morrison are selected as sample. Out of 30
employees, 20 respondents have stated that their company culture is positive while 20 have said
that their culture is negative (Castillo-Atoche and et.al., 2021). So, on this basis, it can be said
that Morrison company can use survey method to collect the qualitative business data such as
employee motivation factor and analyse the outcome of the result.
Quantitative data: The quantitative data is just opposite of qualitative data as it includes
facts, figures and numbers. For example, sales revenue and marketing is the two quantitative raw
data of Morrison business (Levin and Rubin, 2021). The analysis and evaluation of quantitative
data of Morrison organization using statistical method are as follows:
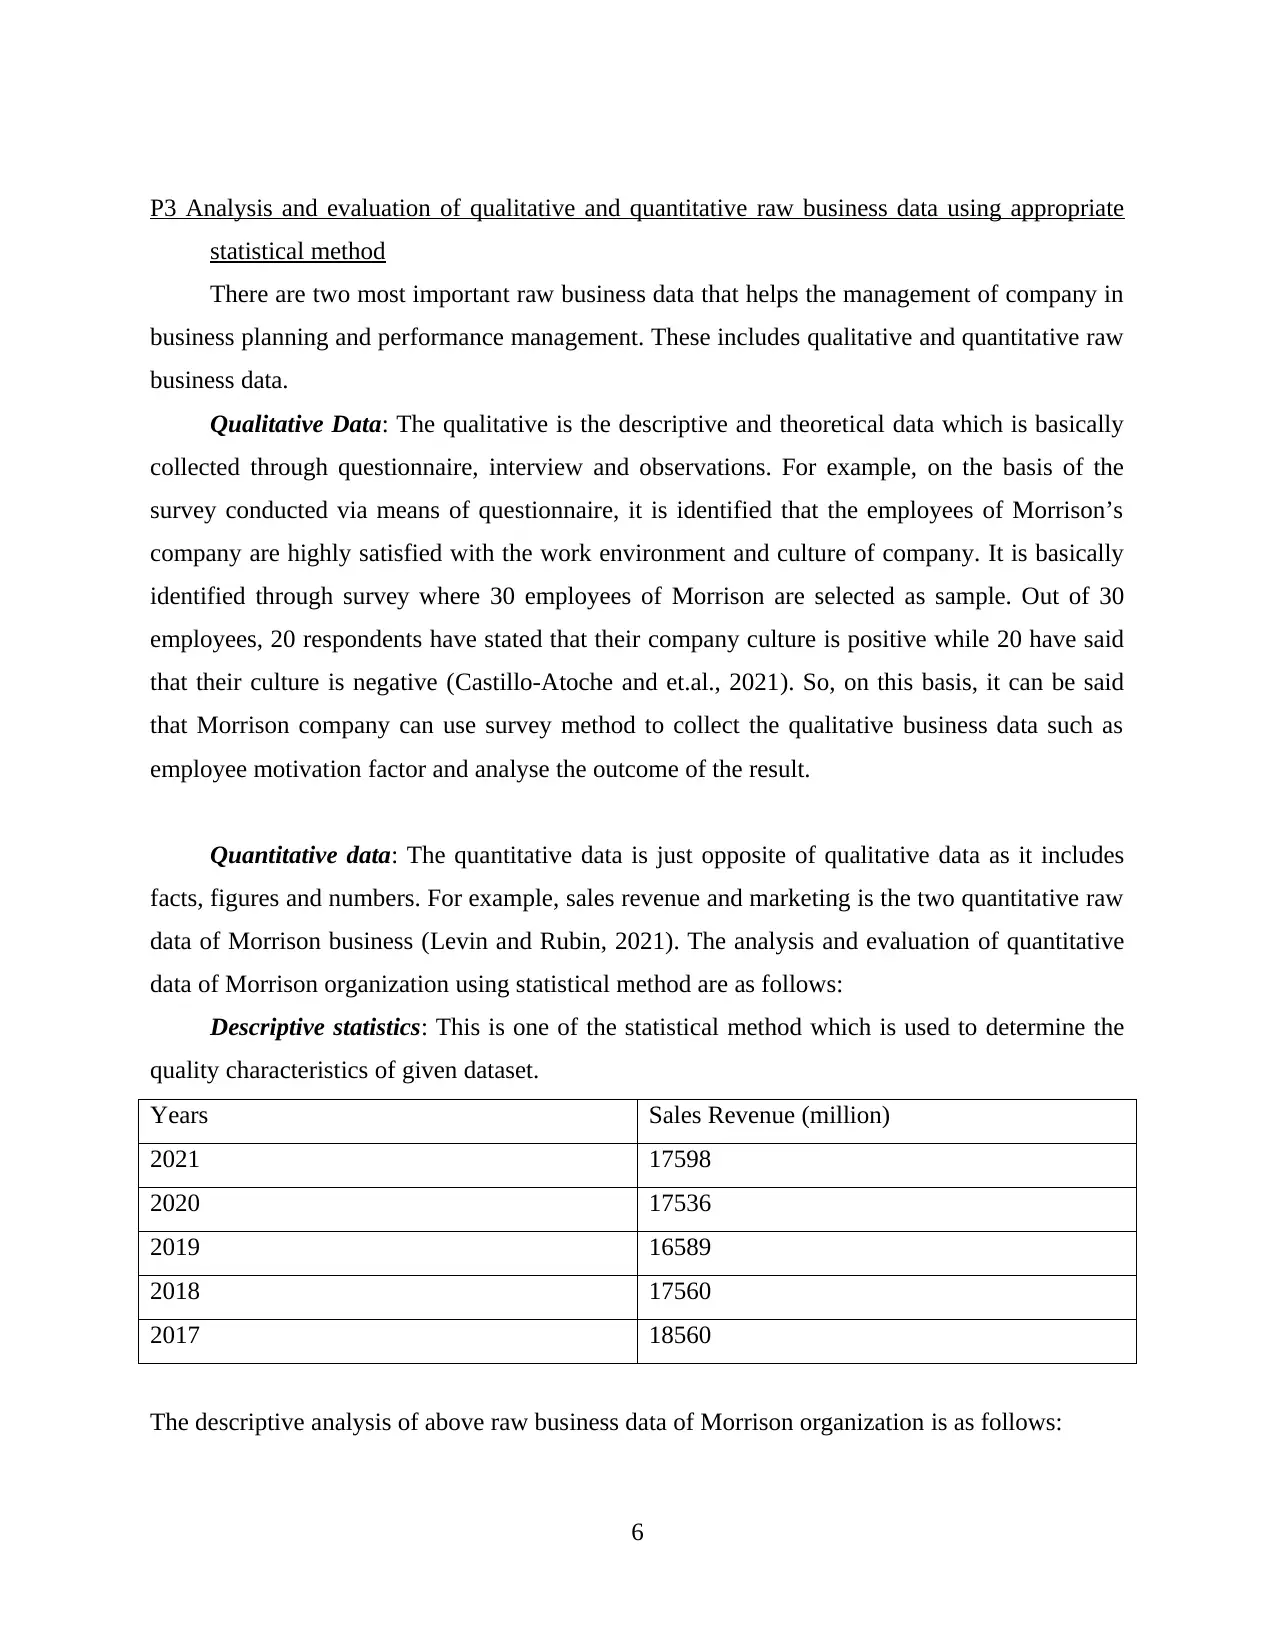
Descriptive statistics: This is one of the statistical method which is used to determine the
quality characteristics of given dataset.
Years Sales Revenue (million)
2021 17598
2020 17536
2019 16589
2018 17560
2017 18560
The descriptive analysis of above raw business data of Morrison organization is as follows:
6
statistical method
There are two most important raw business data that helps the management of company in
business planning and performance management. These includes qualitative and quantitative raw
business data.
Qualitative Data: The qualitative is the descriptive and theoretical data which is basically
collected through questionnaire, interview and observations. For example, on the basis of the
survey conducted via means of questionnaire, it is identified that the employees of Morrison’s
company are highly satisfied with the work environment and culture of company. It is basically
identified through survey where 30 employees of Morrison are selected as sample. Out of 30
employees, 20 respondents have stated that their company culture is positive while 20 have said
that their culture is negative (Castillo-Atoche and et.al., 2021). So, on this basis, it can be said
that Morrison company can use survey method to collect the qualitative business data such as
employee motivation factor and analyse the outcome of the result.
Quantitative data: The quantitative data is just opposite of qualitative data as it includes
facts, figures and numbers. For example, sales revenue and marketing is the two quantitative raw
data of Morrison business (Levin and Rubin, 2021). The analysis and evaluation of quantitative
data of Morrison organization using statistical method are as follows:
Descriptive statistics: This is one of the statistical method which is used to determine the
quality characteristics of given dataset.
Years Sales Revenue (million)
2021 17598
2020 17536
2019 16589
2018 17560
2017 18560
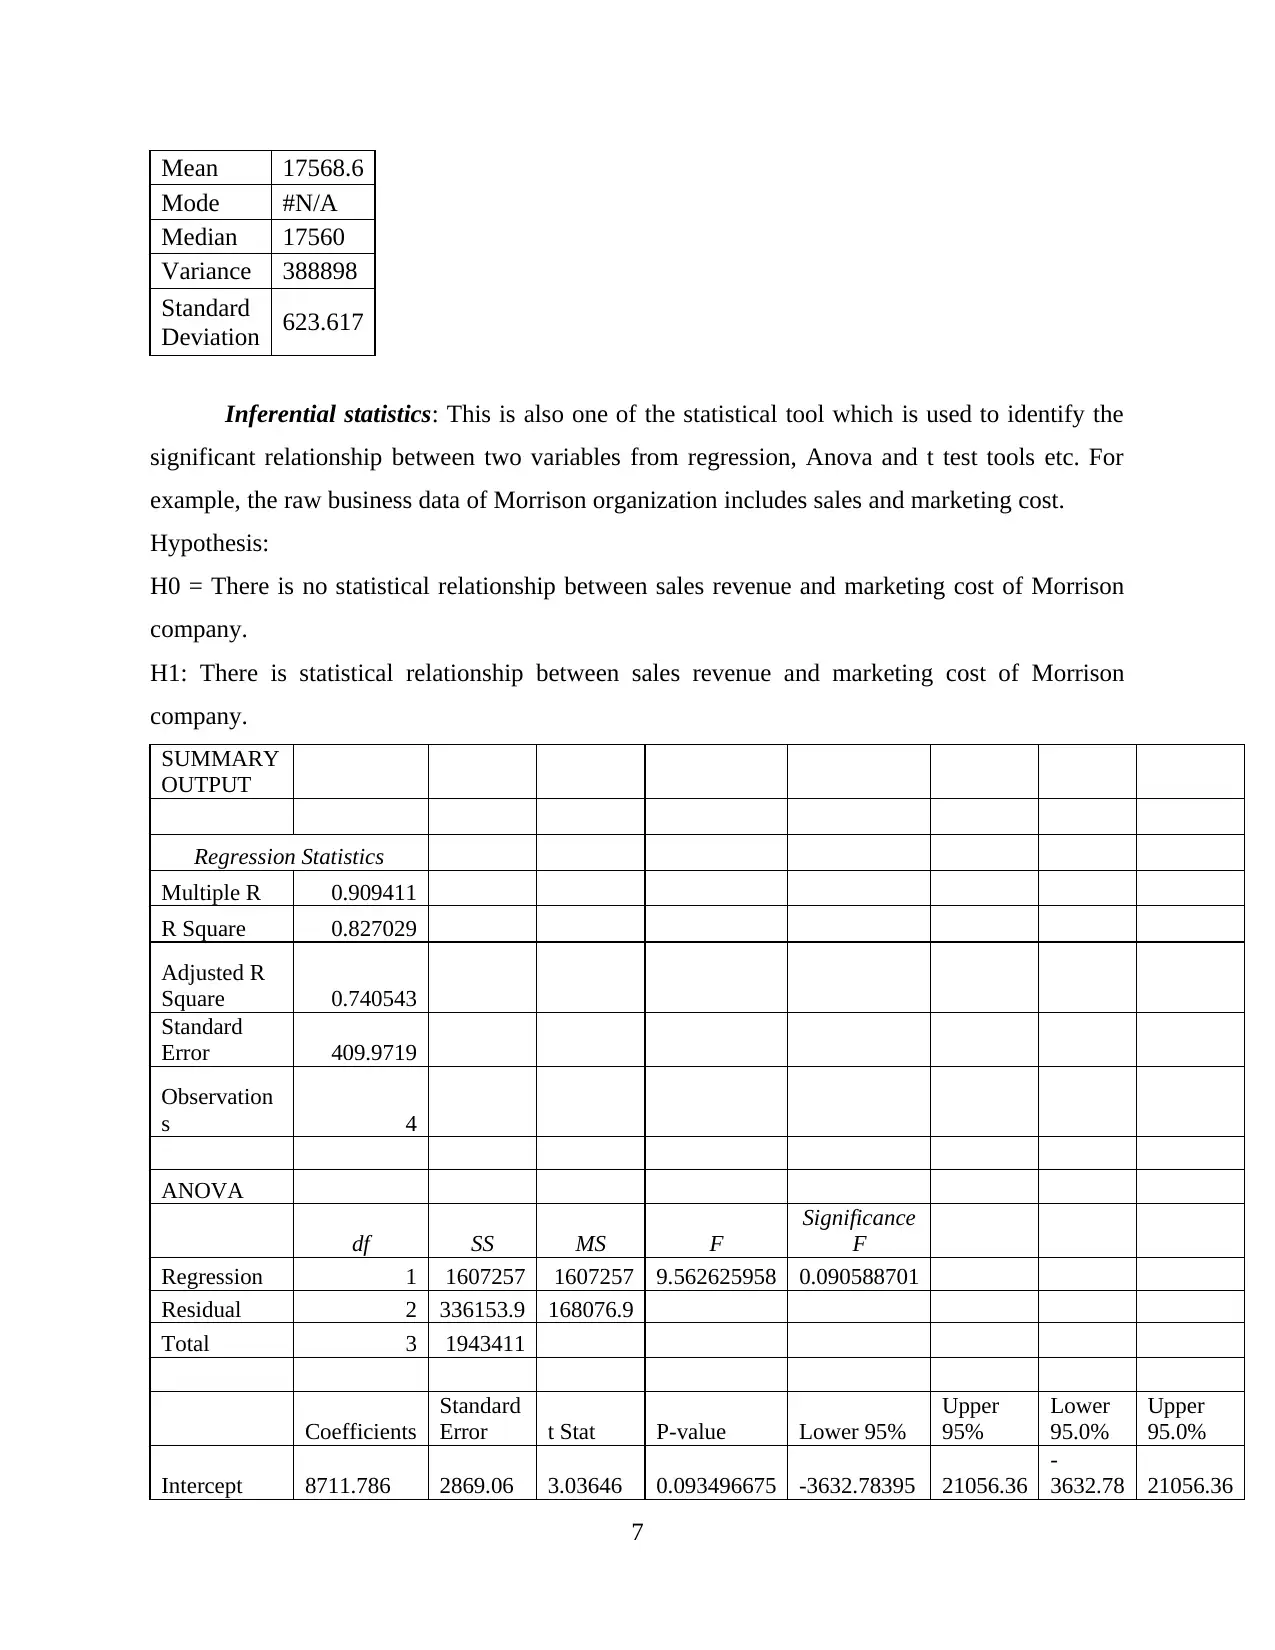
The descriptive analysis of above raw business data of Morrison organization is as follows:
6
Paraphrase This Document
Need a fresh take? Get an instant paraphrase of this document with our AI Paraphraser
Mean 17568.6
Mode #N/A
Median 17560
Variance 388898
Standard
Deviation 623.617
Inferential statistics: This is also one of the statistical tool which is used to identify the
significant relationship between two variables from regression, Anova and t test tools etc. For
example, the raw business data of Morrison organization includes sales and marketing cost.
Hypothesis:
H0 = There is no statistical relationship between sales revenue and marketing cost of Morrison
company.
H1: There is statistical relationship between sales revenue and marketing cost of Morrison
company.
SUMMARY
OUTPUT
Regression Statistics
Multiple R 0.909411
R Square 0.827029
Adjusted R
Square 0.740543
Standard
Error 409.9719
Observation
s 4
ANOVA
df SS MS F
Significance
F
Regression 1 1607257 1607257 9.562625958 0.090588701
Residual 2 336153.9 168076.9
Total 3 1943411
Coefficients
Standard
Error t Stat P-value Lower 95%
Upper
95%
Lower
95.0%
Upper
95.0%
Intercept 8711.786 2869.06 3.03646 0.093496675 -3632.78395 21056.36
-
3632.78 21056.36
7
1600 5.396014 1.744956 3.09235 0.090588701
-
2.111925941 12.90395
-
2.11193 12.90395
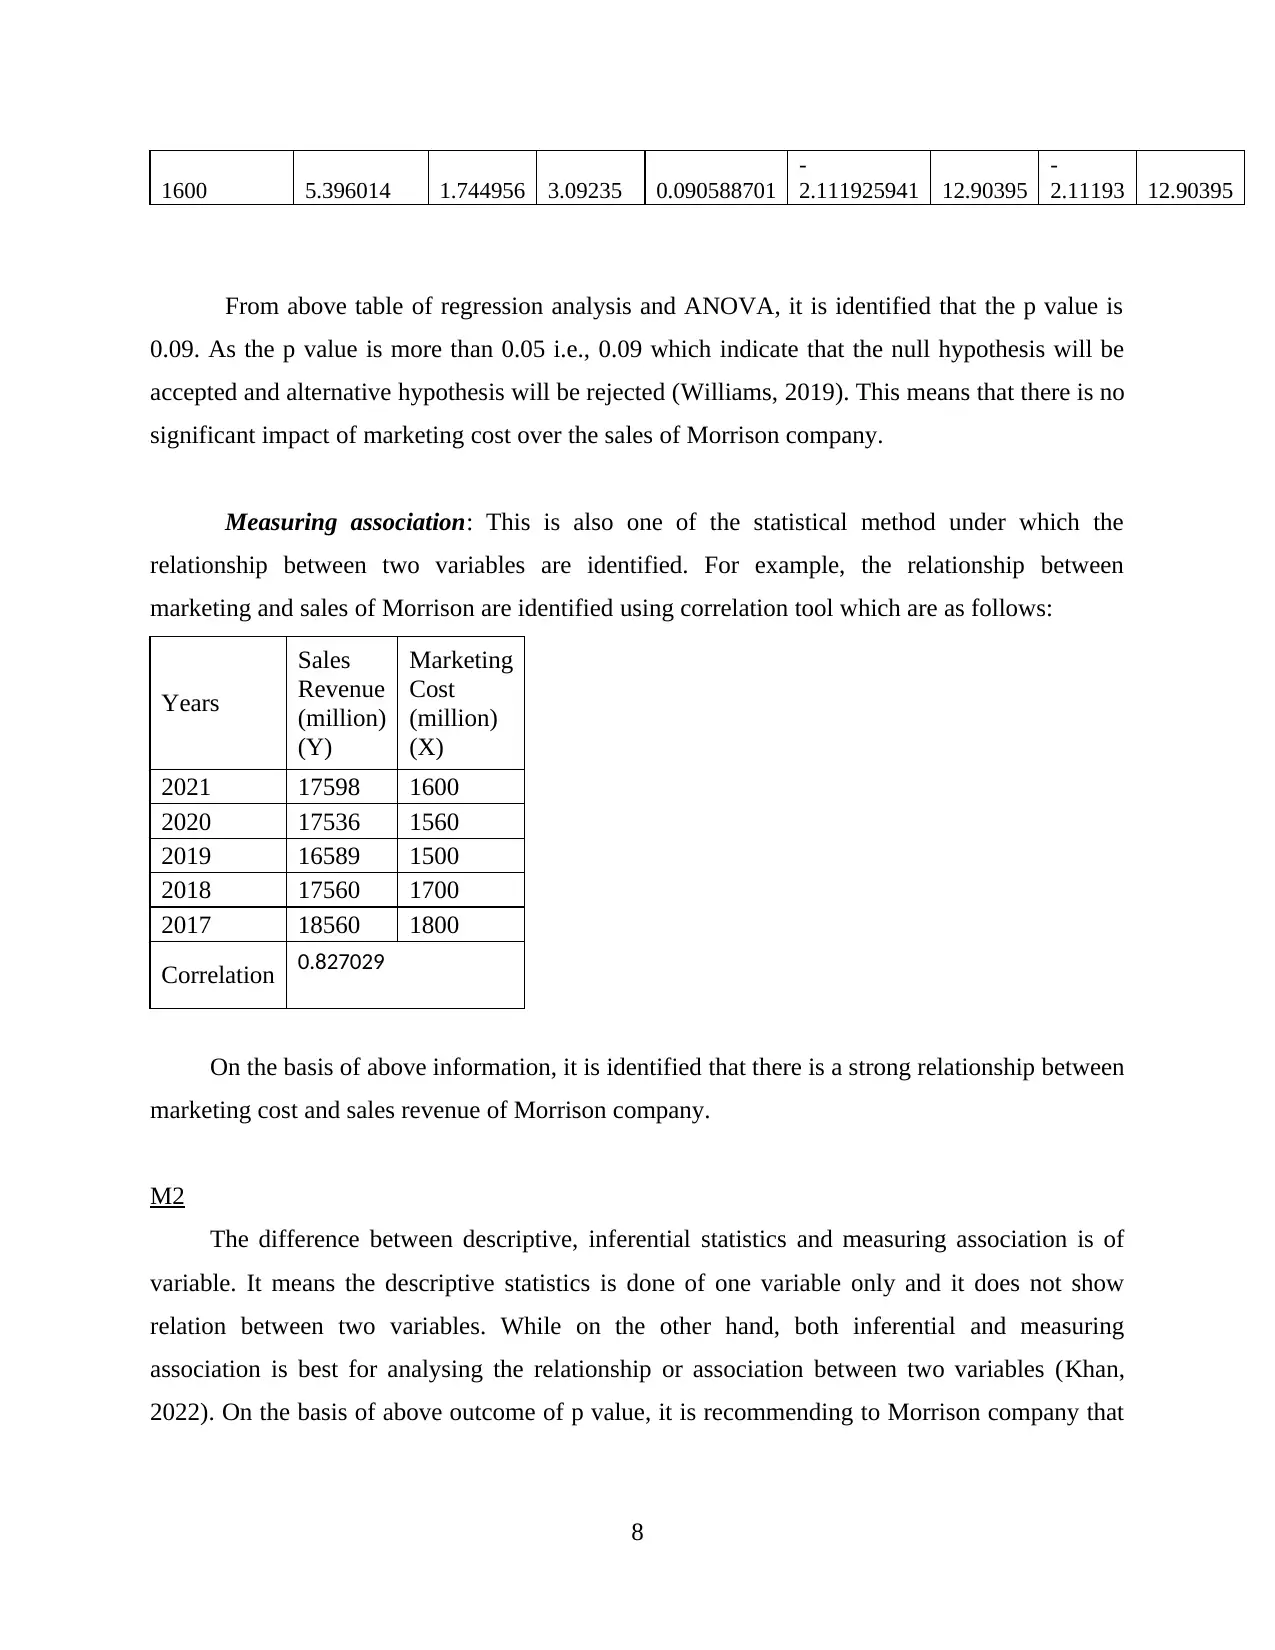
From above table of regression analysis and ANOVA, it is identified that the p value is
0.09. As the p value is more than 0.05 i.e., 0.09 which indicate that the null hypothesis will be
accepted and alternative hypothesis will be rejected (Williams, 2019). This means that there is no
significant impact of marketing cost over the sales of Morrison company.
Measuring association: This is also one of the statistical method under which the
relationship between two variables are identified. For example, the relationship between
marketing and sales of Morrison are identified using correlation tool which are as follows:
Years
Sales
Revenue
(million)
(Y)
Marketing
Cost
(million)
(X)
2021 17598 1600
2020 17536 1560
2019 16589 1500
2018 17560 1700
2017 18560 1800
Correlation 0.827029
On the basis of above information, it is identified that there is a strong relationship between
marketing cost and sales revenue of Morrison company.
M2
The difference between descriptive, inferential statistics and measuring association is of
variable. It means the descriptive statistics is done of one variable only and it does not show
relation between two variables. While on the other hand, both inferential and measuring
association is best for analysing the relationship or association between two variables (Khan,
2022). On the basis of above outcome of p value, it is recommending to Morrison company that
8
-
2.111925941 12.90395
-
2.11193 12.90395
From above table of regression analysis and ANOVA, it is identified that the p value is
0.09. As the p value is more than 0.05 i.e., 0.09 which indicate that the null hypothesis will be
accepted and alternative hypothesis will be rejected (Williams, 2019). This means that there is no
significant impact of marketing cost over the sales of Morrison company.
Measuring association: This is also one of the statistical method under which the
relationship between two variables are identified. For example, the relationship between
marketing and sales of Morrison are identified using correlation tool which are as follows:
Years
Sales
Revenue
(million)
(Y)
Marketing
Cost
(million)
(X)
2021 17598 1600
2020 17536 1560
2019 16589 1500
2018 17560 1700
2017 18560 1800
Correlation 0.827029
On the basis of above information, it is identified that there is a strong relationship between
marketing cost and sales revenue of Morrison company.
M2
The difference between descriptive, inferential statistics and measuring association is of
variable. It means the descriptive statistics is done of one variable only and it does not show
relation between two variables. While on the other hand, both inferential and measuring
association is best for analysing the relationship or association between two variables (Khan,
2022). On the basis of above outcome of p value, it is recommending to Morrison company that
8
⊘ This is a preview!⊘
Do you want full access?
Subscribe today to unlock all pages.
Trusted by 1+ million students worldwide
they should focus more on other factors or strategy rather than only marketing in order to
increase their sales.
P4 Application of different range of statistical method in Morrison’s business planning
Statistical methods are the methods which is used or applied by the organization such as
Morrison’s within their business planning for quality, inventory and capacity management. The
different range of statistical methods used in business planning using the specific range of data is
as follows:
Statistical Process Control: The statistical quality control is basically used to monitor,
control and improve the processes of business using statistical techniques. There are various
factors such as increased competition, increased cost of raw material etc. which the management
of Morrison company cannot control (Audu and Singh, 2021). But with the application of
statistical process control, the management of Morrison company can shift its process from
detection based to prevention based quality controls. With the continuous monitoring of process
and product performance, Morrison company can detect changes and trends in the process before
they result in non-conforming products or scarp.
Application:
Morrison company can apply the tools of statistical process control in order to measure the
conforming product output. The key tools include run chart, control chart, Pareto chart etc. The
control chart helps the management of Morrison company to identify the three element of
process such as upper limit, target and the lower limit. While on the other hand, the Pareto chart
9
Paraphrase This Document
Need a fresh take? Get an instant paraphrase of this document with our AI Paraphraser
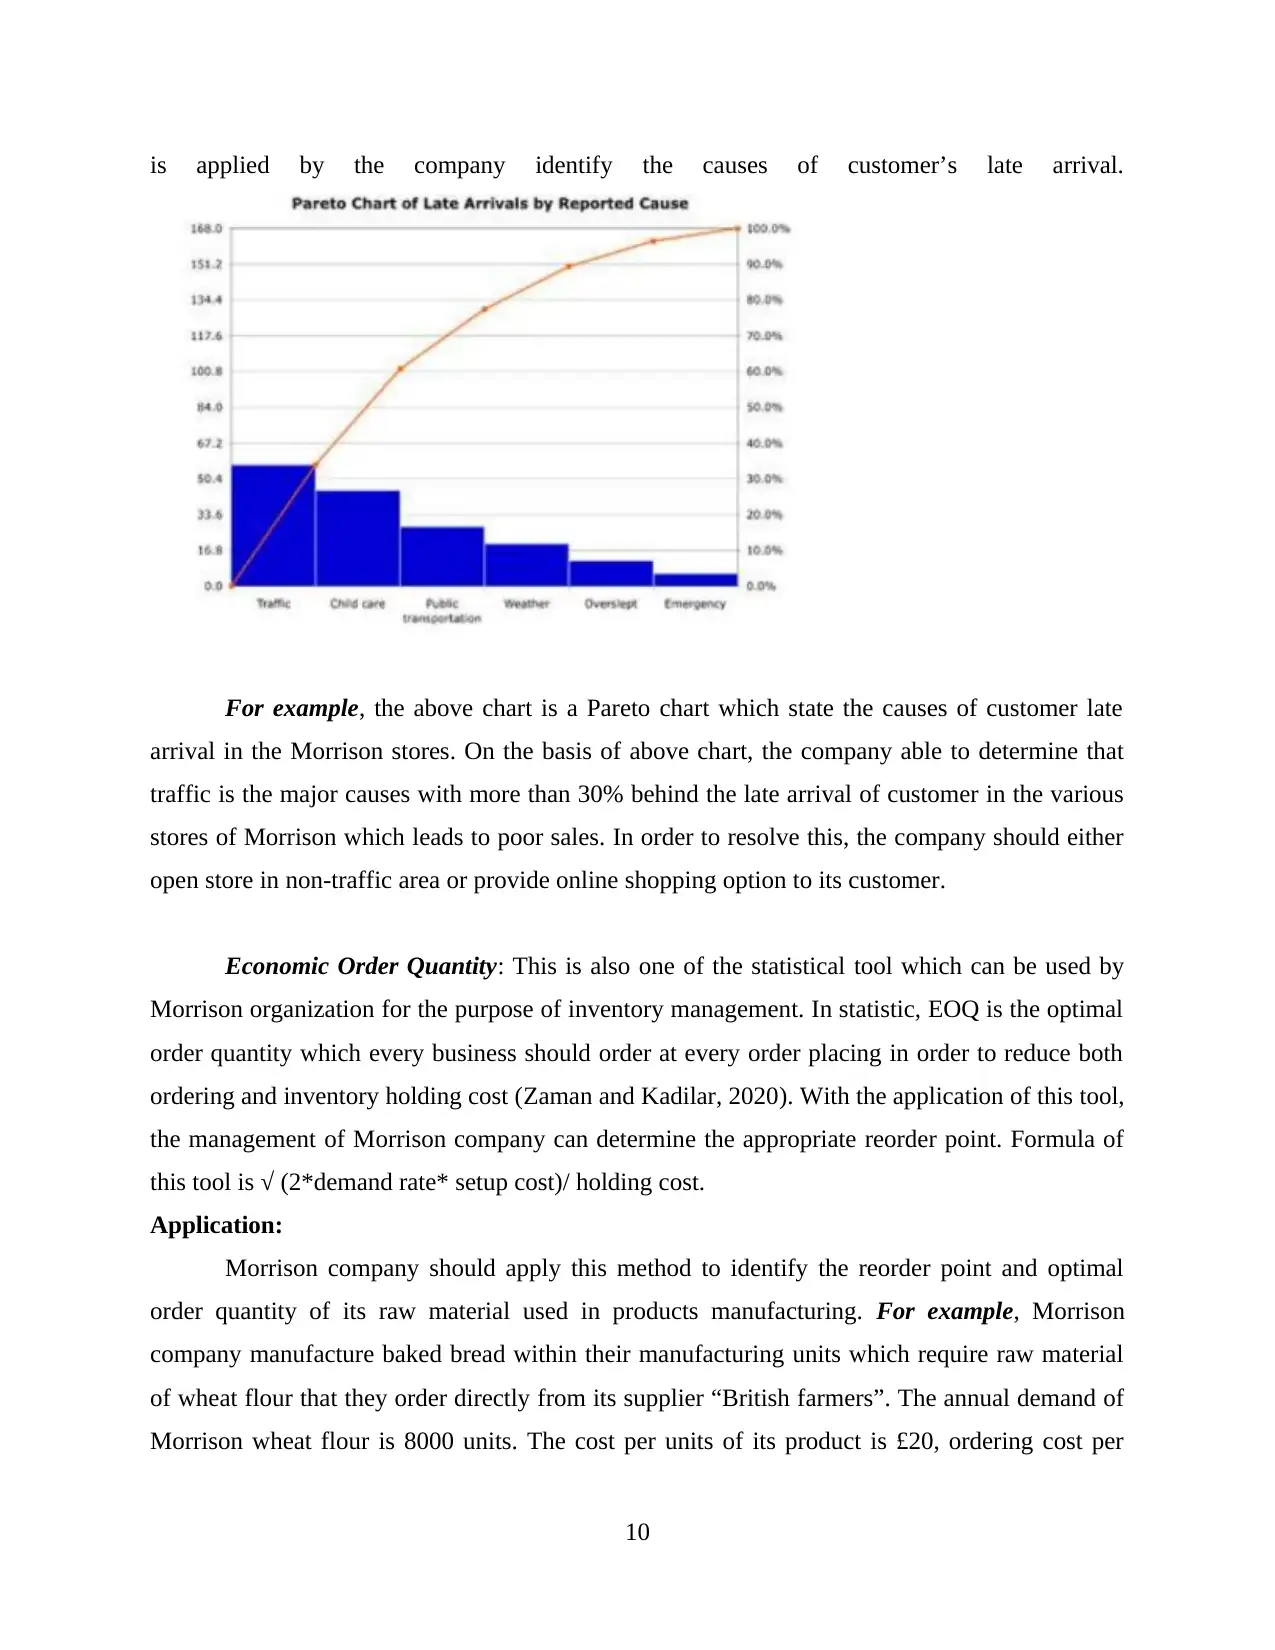
is applied by the company identify the causes of customer’s late arrival.
For example, the above chart is a Pareto chart which state the causes of customer late
arrival in the Morrison stores. On the basis of above chart, the company able to determine that
traffic is the major causes with more than 30% behind the late arrival of customer in the various
stores of Morrison which leads to poor sales. In order to resolve this, the company should either
open store in non-traffic area or provide online shopping option to its customer.
Economic Order Quantity: This is also one of the statistical tool which can be used by
Morrison organization for the purpose of inventory management. In statistic, EOQ is the optimal
order quantity which every business should order at every order placing in order to reduce both
ordering and inventory holding cost (Zaman and Kadilar, 2020). With the application of this tool,
the management of Morrison company can determine the appropriate reorder point. Formula of
this tool is √ (2*demand rate* setup cost)/ holding cost.
Application:
Morrison company should apply this method to identify the reorder point and optimal
order quantity of its raw material used in products manufacturing. For example, Morrison
company manufacture baked bread within their manufacturing units which require raw material
of wheat flour that they order directly from its supplier “British farmers”. The annual demand of
Morrison wheat flour is 8000 units. The cost per units of its product is £20, ordering cost per
10
order is £8 and holding cost is 10% of unit cost. On the basis of this information, the EOQ of
inventory of Morrison company is as follows:
√ (2*8000*8) / 20* 10% = √128000/2 = √64000 = 253 units
After computing the EOQ, it can be said that Morrison company should order 253 units
in a single order in order to minimise the ordering and holding cost. This is the point where both
ordering cost and holding cost is equal (Sethi and Mittal, 2019). In this way, the application of
this statistical method helps the company to manage inventory within Morrison company.
Linear Forecasting: This is also one of the statistical tool with the help of which, the
company such as Morrison can plan business and manage production capacity. For the purpose
of production capacity, the most appropriate statistical tool is linear forecasting as it helps the
company to estimate the future production requirement of company products.
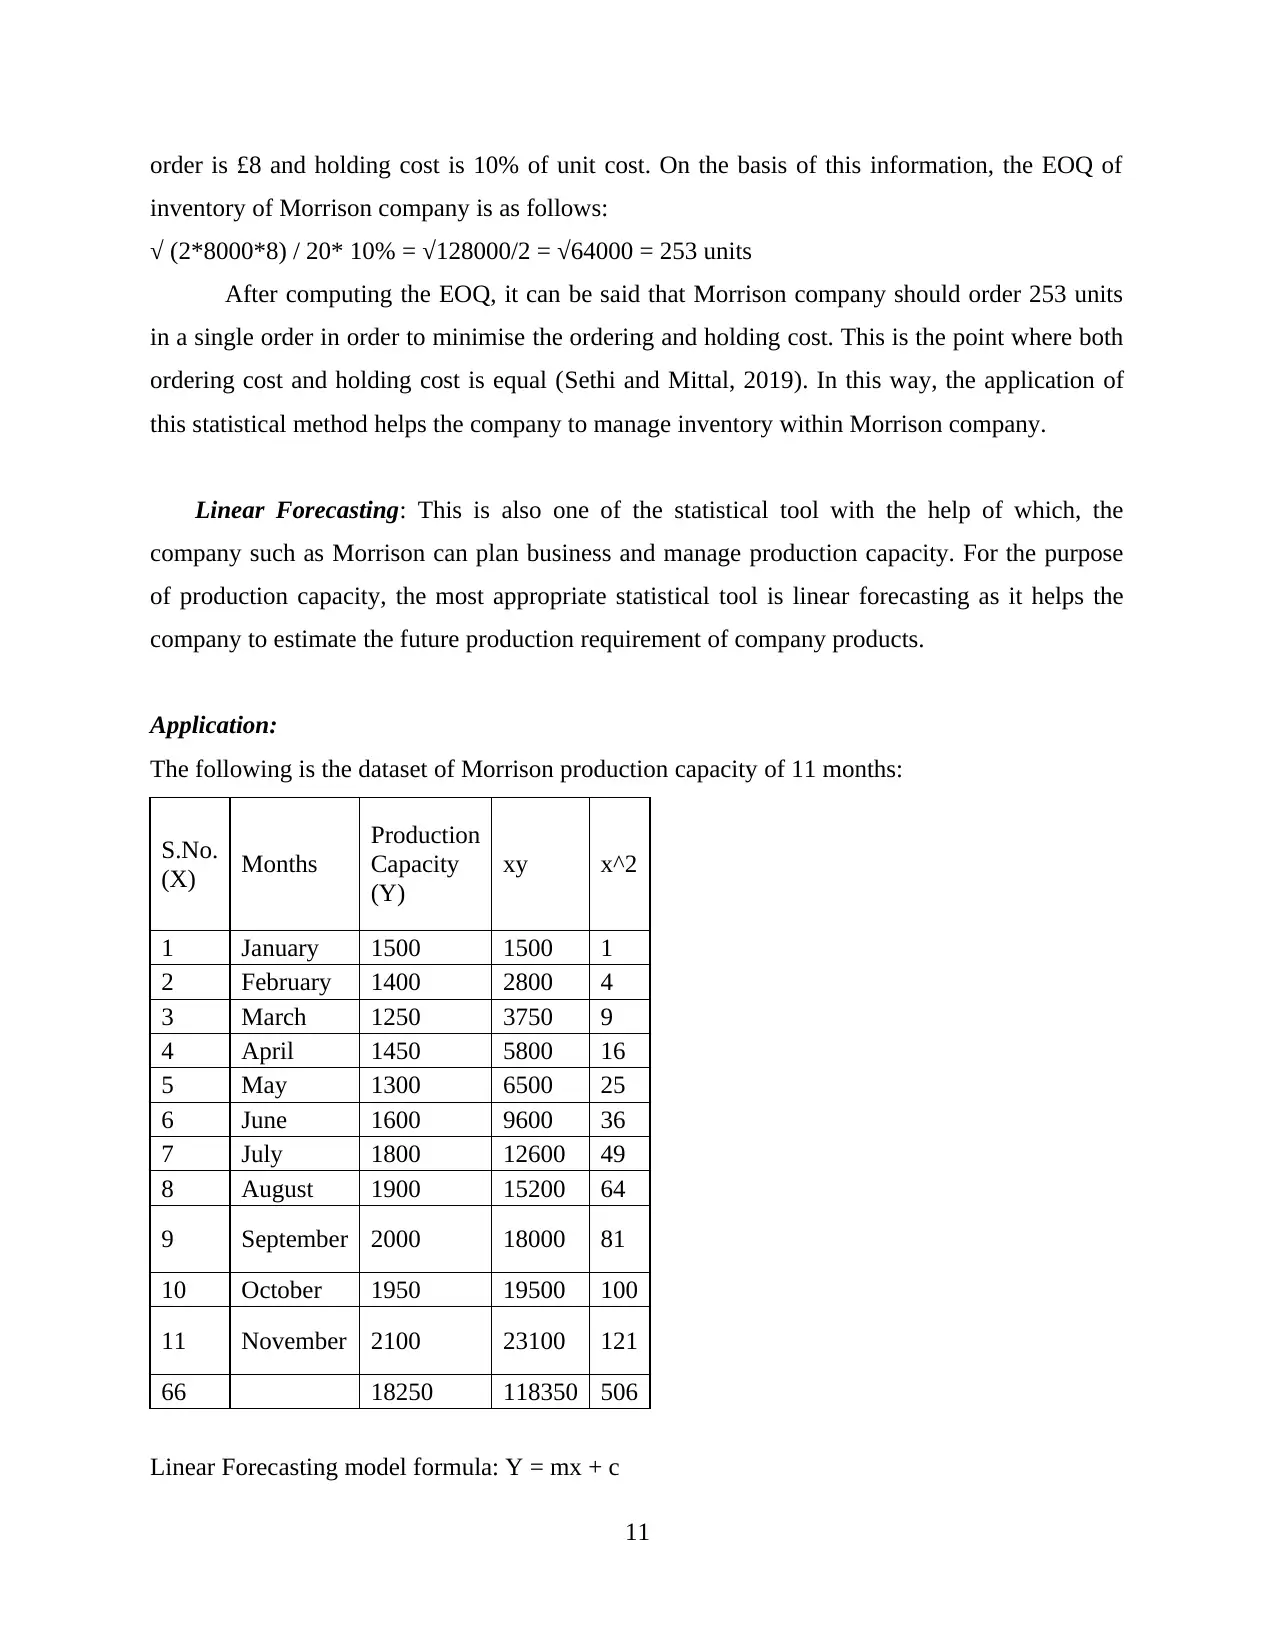
Application:
The following is the dataset of Morrison production capacity of 11 months:
S.No.
(X) Months
Production
Capacity
(Y)
xy x^2
1 January 1500 1500 1
2 February 1400 2800 4
3 March 1250 3750 9
4 April 1450 5800 16
5 May 1300 6500 25
6 June 1600 9600 36
7 July 1800 12600 49
8 August 1900 15200 64
9 September 2000 18000 81
10 October 1950 19500 100
11 November 2100 23100 121
66 18250 118350 506
Linear Forecasting model formula: Y = mx + c
11
inventory of Morrison company is as follows:
√ (2*8000*8) / 20* 10% = √128000/2 = √64000 = 253 units
After computing the EOQ, it can be said that Morrison company should order 253 units
in a single order in order to minimise the ordering and holding cost. This is the point where both
ordering cost and holding cost is equal (Sethi and Mittal, 2019). In this way, the application of
this statistical method helps the company to manage inventory within Morrison company.
Linear Forecasting: This is also one of the statistical tool with the help of which, the
company such as Morrison can plan business and manage production capacity. For the purpose
of production capacity, the most appropriate statistical tool is linear forecasting as it helps the
company to estimate the future production requirement of company products.
Application:
The following is the dataset of Morrison production capacity of 11 months:
S.No.
(X) Months
Production
Capacity
(Y)
xy x^2
1 January 1500 1500 1
2 February 1400 2800 4
3 March 1250 3750 9
4 April 1450 5800 16
5 May 1300 6500 25
6 June 1600 9600 36
7 July 1800 12600 49
8 August 1900 15200 64
9 September 2000 18000 81
10 October 1950 19500 100
11 November 2100 23100 121
66 18250 118350 506
Linear Forecasting model formula: Y = mx + c
11
⊘ This is a preview!⊘
Do you want full access?
Subscribe today to unlock all pages.
Trusted by 1+ million students worldwide
1 out of 19
Related Documents


Your All-in-One AI-Powered Toolkit for Academic Success.
+13062052269
info@desklib.com
Available 24*7 on WhatsApp / Email
![[object Object]](/_next/static/media/star-bottom.7253800d.svg)
Unlock your academic potential
Copyright © 2020–2026 A2Z Services. All Rights Reserved. Developed and managed by ZUCOL.