Statistics for Management Report: Business Data Analysis and Insights
VerifiedAdded on 2020/12/18
|20
|4422
|52
Report
AI Summary
This report provides a comprehensive analysis of statistical methods applied to business and economic data. It begins with an introduction to statistics for management, emphasizing its role in strategic planning and decision-making. The report analyzes data from the Office of National Statistics, including Consumer Price Indices (CPI) and Retail Prices Indices (RPI), explaining the differences between them and their uses in measuring inflation. The analysis includes the evaluation of quantitative and qualitative data, such as temperature and coffee sales, using appropriate statistical methods. Charts and tables are used to represent findings, aiding in the interpretation of data and the drawing of conclusions. The report differentiates between descriptive, exploratory, and confirmatory analysis, and discusses the applications of statistics in business planning, inventory management, and capacity management. The report concludes with recommendations based on the statistical findings and provides relevant references.
STATISTICSSTATISTICS
FORFOR
MANAGEMENTMANAGEMENT
FORFOR
MANAGEMENTMANAGEMENT
Paraphrase This Document
Need a fresh take? Get an instant paraphrase of this document with our AI Paraphraser
Table of Contents
INTRODUCTION...........................................................................................................................1
ACTIVITY 1....................................................................................................................................1
P1 Describing the process and nature of business and economic data with several published
sources.........................................................................................................................................1
P2 Evaluation of the data obtained from variety of sources by using different methods of
analysation ................................................................................................................................5
M1 Analysation of price index reported by the Office of national Statistics..............................7
D1 Differentiation between the descriptive, Exploratory and Confirmatory analysis with
illustrations..................................................................................................................................7
ACTIVITY 2....................................................................................................................................8
P3 Analysation of quantitative and qualitative data from the range of illustrations and suitable
statistical methods.......................................................................................................................8
M2 Assessment of several different statistical applications ....................................................11
ACTIVITY 3..................................................................................................................................12
P4 Methods of statistics used in planning for business, inventory management and capacity of
the management .......................................................................................................................12
M3 Clarification and the utilizing ways of statistical methods. ...............................................12
D2 Explanation and recommendations for activity 3 ..............................................................12
ACTIVITY 4..................................................................................................................................13
P5 Utilization of appropriate charts and tables to execute the findings for a various variables
...................................................................................................................................................13
M4 Interpreting the graphic representation assessed in activity of 1&2...................................15
D3 Determining the uses of the graphic presentation in activity 1& 2 ....................................16
CONCLUSION..............................................................................................................................16
REFERENCES..............................................................................................................................17
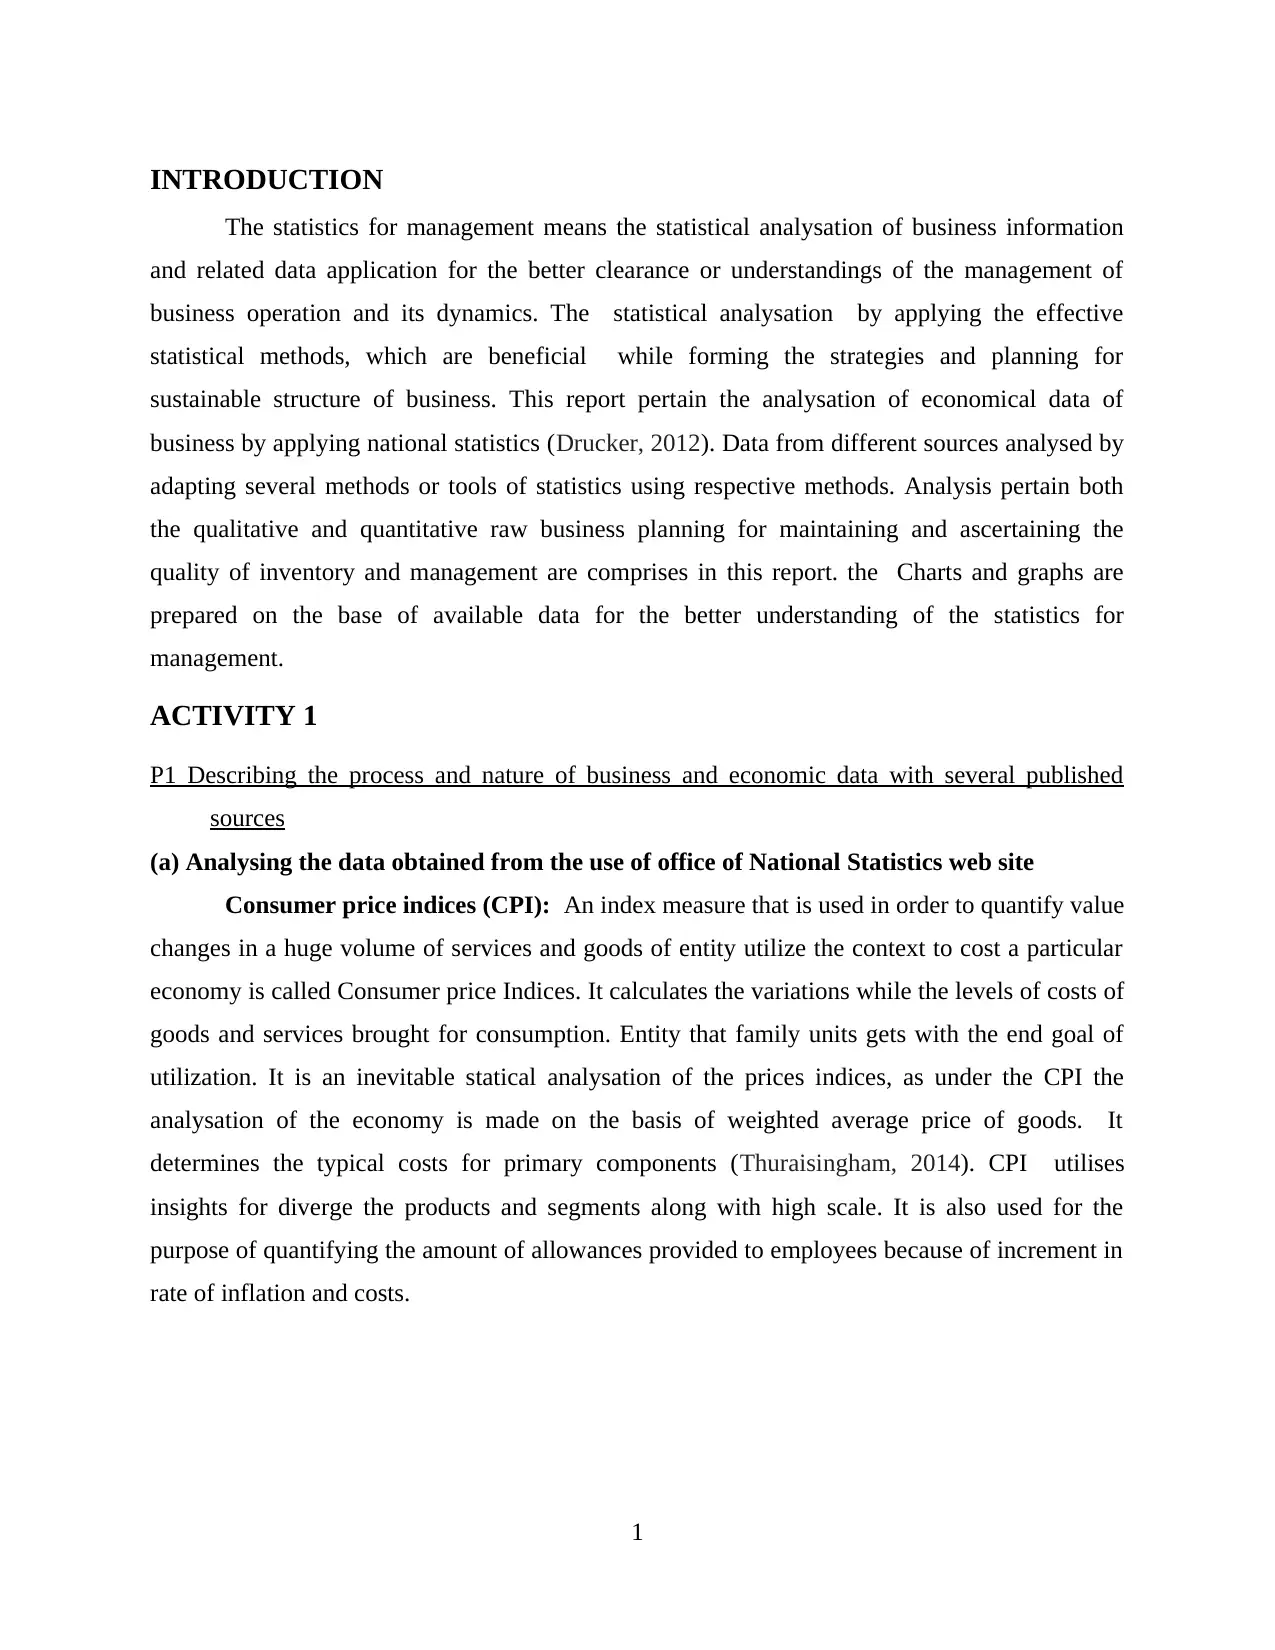
INTRODUCTION
The statistics for management means the statistical analysation of business information
and related data application for the better clearance or understandings of the management of
business operation and its dynamics. The statistical analysation by applying the effective
statistical methods, which are beneficial while forming the strategies and planning for
sustainable structure of business. This report pertain the analysation of economical data of
business by applying national statistics (Drucker, 2012). Data from different sources analysed by
adapting several methods or tools of statistics using respective methods. Analysis pertain both
the qualitative and quantitative raw business planning for maintaining and ascertaining the
quality of inventory and management are comprises in this report. the Charts and graphs are
prepared on the base of available data for the better understanding of the statistics for
management.
ACTIVITY 1
P1 Describing the process and nature of business and economic data with several published
sources
(a) Analysing the data obtained from the use of office of National Statistics web site
Consumer price indices (CPI): An index measure that is used in order to quantify value
changes in a huge volume of services and goods of entity utilize the context to cost a particular
economy is called Consumer price Indices. It calculates the variations while the levels of costs of
goods and services brought for consumption. Entity that family units gets with the end goal of
utilization. It is an inevitable statical analysation of the prices indices, as under the CPI the
analysation of the economy is made on the basis of weighted average price of goods. It
determines the typical costs for primary components (Thuraisingham, 2014). CPI utilises
insights for diverge the products and segments along with high scale. It is also used for the
purpose of quantifying the amount of allowances provided to employees because of increment in
rate of inflation and costs.
1
⊘ This is a preview!⊘
Do you want full access?
Subscribe today to unlock all pages.
Trusted by 1+ million students worldwide
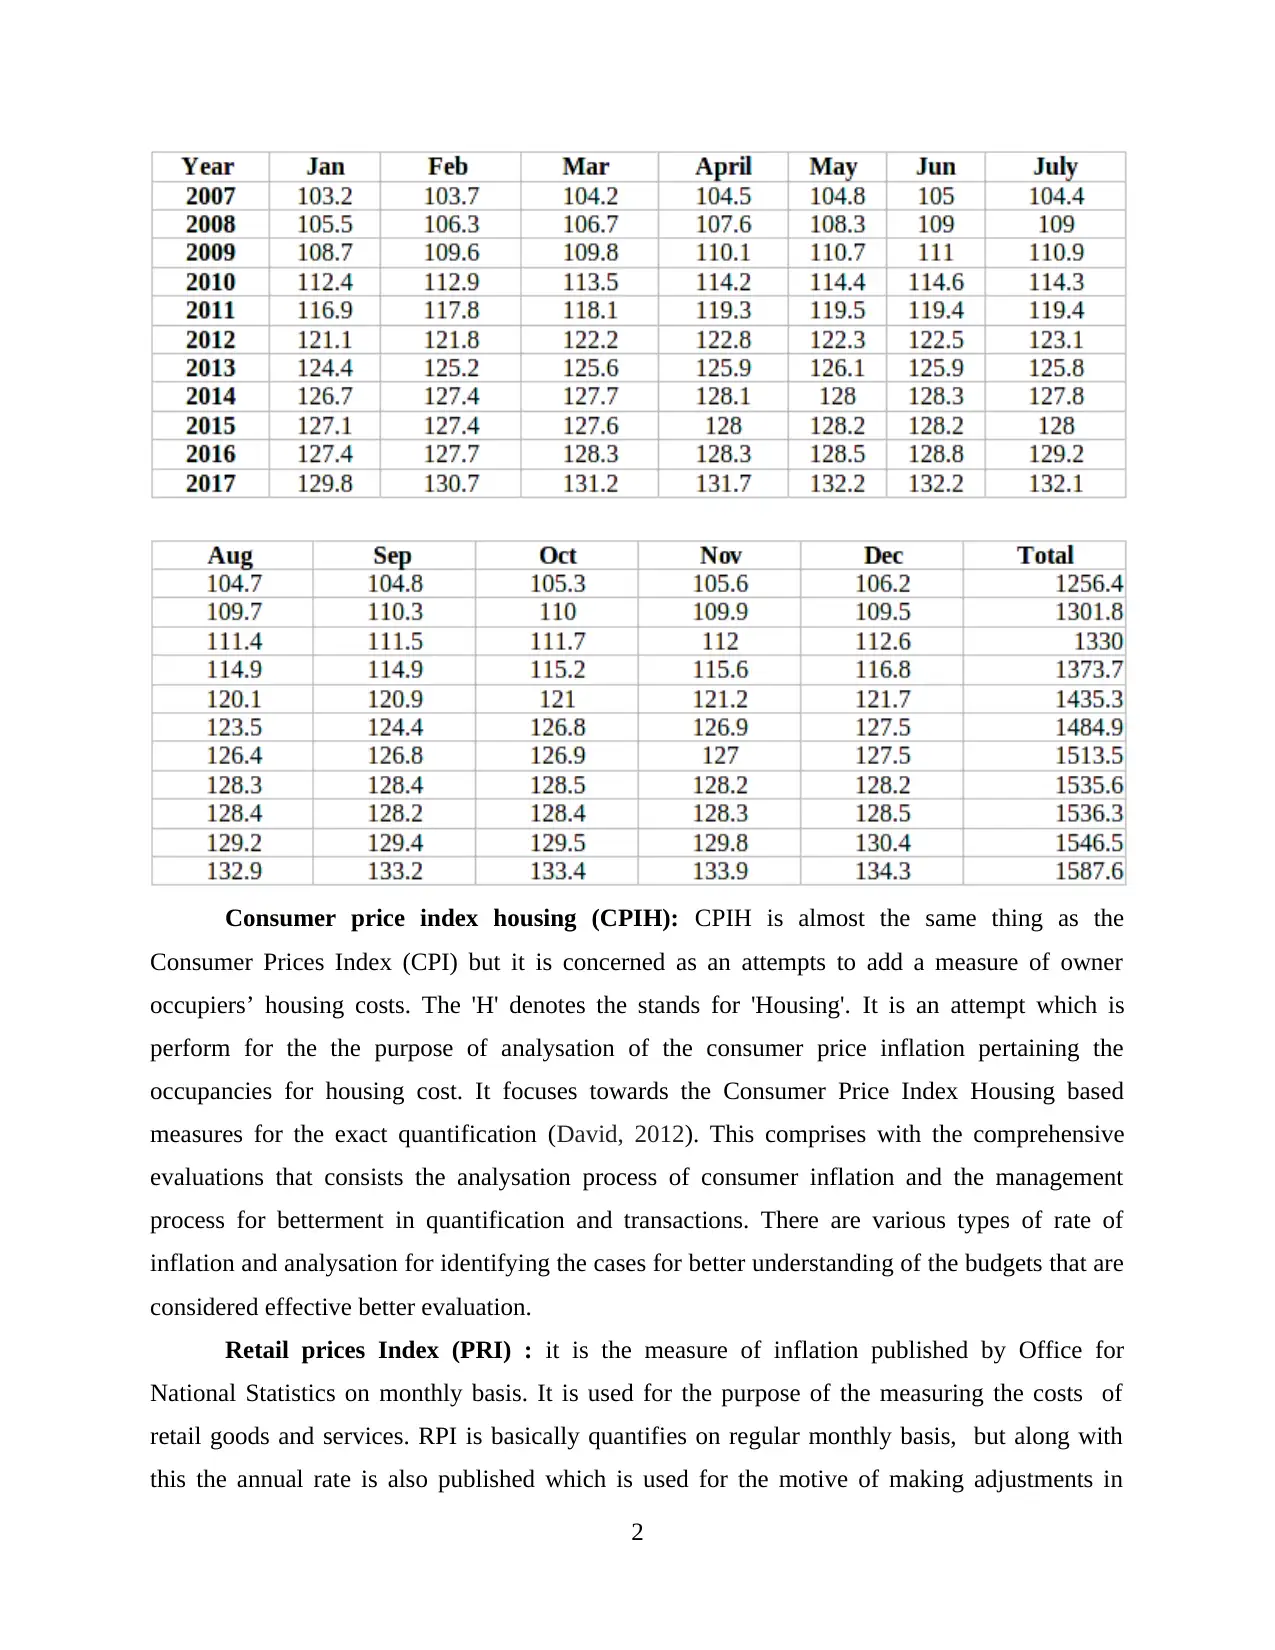
Consumer price index housing (CPIH): CPIH is almost the same thing as the
Consumer Prices Index (CPI) but it is concerned as an attempts to add a measure of owner
occupiers’ housing costs. The 'H' denotes the stands for 'Housing'. It is an attempt which is
perform for the the purpose of analysation of the consumer price inflation pertaining the
occupancies for housing cost. It focuses towards the Consumer Price Index Housing based
measures for the exact quantification (David, 2012). This comprises with the comprehensive
evaluations that consists the analysation process of consumer inflation and the management
process for betterment in quantification and transactions. There are various types of rate of
inflation and analysation for identifying the cases for better understanding of the budgets that are
considered effective better evaluation.
Retail prices Index (PRI) : it is the measure of inflation published by Office for
National Statistics on monthly basis. It is used for the purpose of the measuring the costs of
retail goods and services. RPI is basically quantifies on regular monthly basis, but along with
this the annual rate is also published which is used for the motive of making adjustments in
2
Paraphrase This Document
Need a fresh take? Get an instant paraphrase of this document with our AI Paraphraser
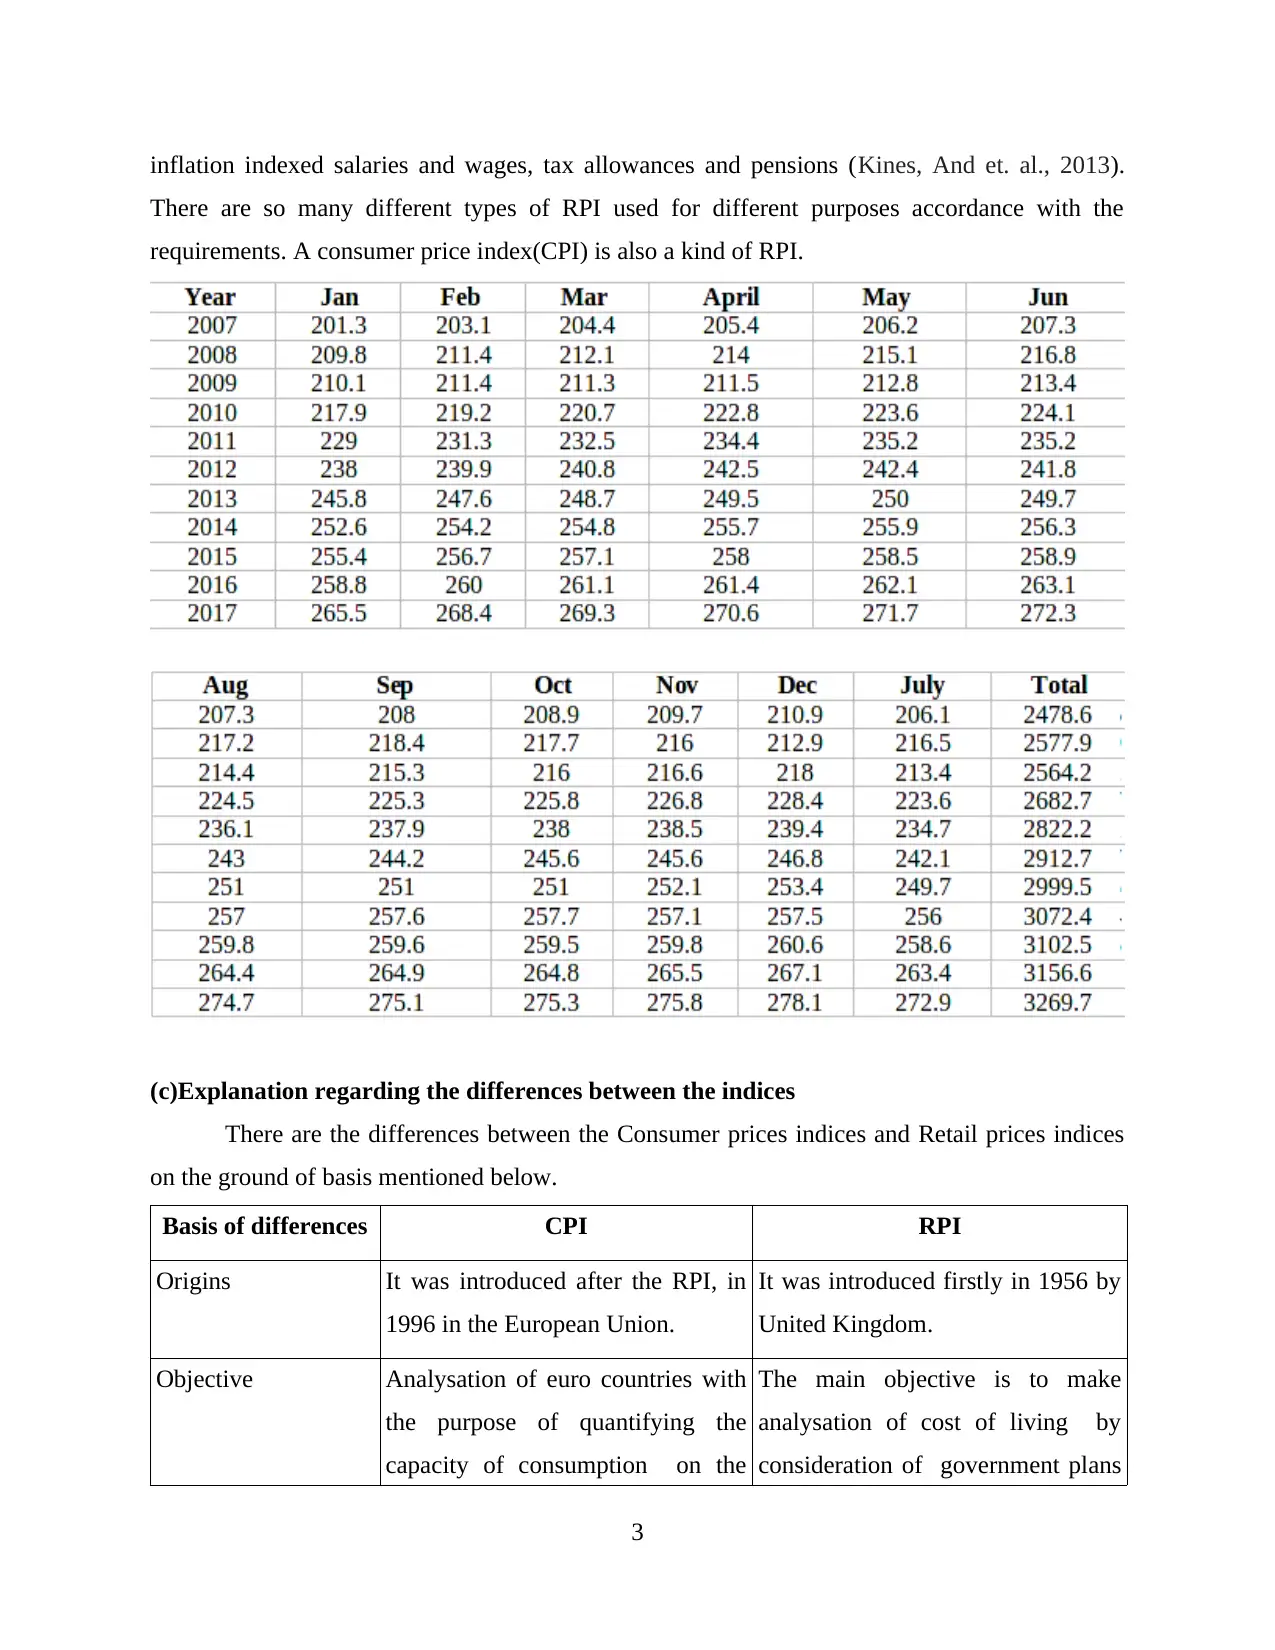
inflation indexed salaries and wages, tax allowances and pensions (Kines, And et. al., 2013).
There are so many different types of RPI used for different purposes accordance with the
requirements. A consumer price index(CPI) is also a kind of RPI.
(c)Explanation regarding the differences between the indices
There are the differences between the Consumer prices indices and Retail prices indices
on the ground of basis mentioned below.
Basis of differences CPI RPI
Origins It was introduced after the RPI, in
1996 in the European Union.
It was introduced firstly in 1956 by
United Kingdom.
Objective Analysation of euro countries with
the purpose of quantifying the
capacity of consumption on the
The main objective is to make
analysation of cost of living by
consideration of government plans
3
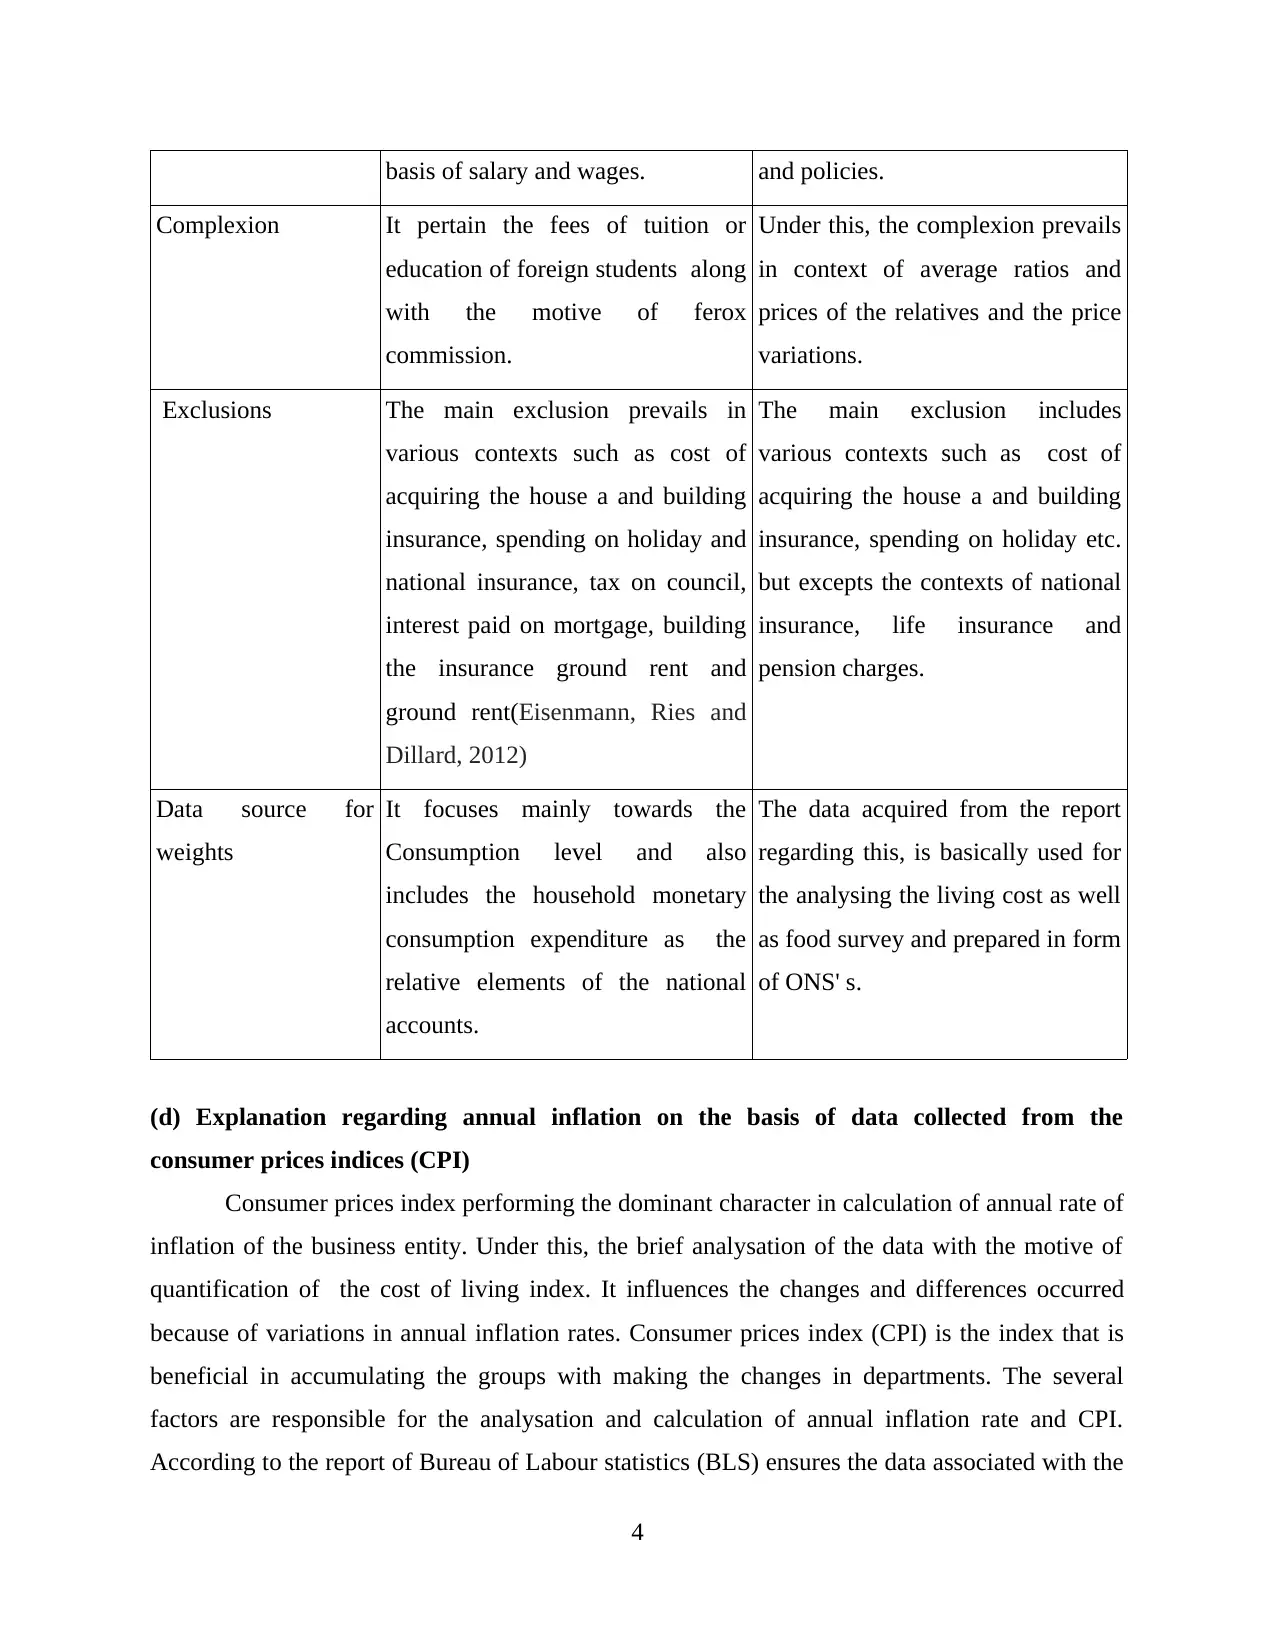
basis of salary and wages. and policies.
Complexion It pertain the fees of tuition or
education of foreign students along
with the motive of ferox
commission.
Under this, the complexion prevails
in context of average ratios and
prices of the relatives and the price
variations.
Exclusions The main exclusion prevails in
various contexts such as cost of
acquiring the house a and building
insurance, spending on holiday and
national insurance, tax on council,
interest paid on mortgage, building
the insurance ground rent and
ground rent(Eisenmann, Ries and
Dillard, 2012)
The main exclusion includes
various contexts such as cost of
acquiring the house a and building
insurance, spending on holiday etc.
but excepts the contexts of national
insurance, life insurance and
pension charges.
Data source for
weights
It focuses mainly towards the
Consumption level and also
includes the household monetary
consumption expenditure as the
relative elements of the national
accounts.
The data acquired from the report
regarding this, is basically used for
the analysing the living cost as well
as food survey and prepared in form
of ONS' s.
(d) Explanation regarding annual inflation on the basis of data collected from the
consumer prices indices (CPI)
Consumer prices index performing the dominant character in calculation of annual rate of
inflation of the business entity. Under this, the brief analysation of the data with the motive of
quantification of the cost of living index. It influences the changes and differences occurred
because of variations in annual inflation rates. Consumer prices index (CPI) is the index that is
beneficial in accumulating the groups with making the changes in departments. The several
factors are responsible for the analysation and calculation of annual inflation rate and CPI.
According to the report of Bureau of Labour statistics (BLS) ensures the data associated with the
4
⊘ This is a preview!⊘
Do you want full access?
Subscribe today to unlock all pages.
Trusted by 1+ million students worldwide
annual spendings of customers for the particular period of time. There are mainly eight sections
for analysation in order to determine the rise in prices due to rate of inflation and costs of energy.
For the purpose of quantifying the annual inflation rate it is essential to have the record of data
regarding the consumption for the particular period of time or era (Cox, 2018).
It issued for determining the healthy economic rate but also utilize by federal
government for the analysation of the the economic policies for achieving the motive of
preventing the inflation rate.
(e) Reason behind the occurrence of inflation rate which are crucial to analyse
For analysing the growth rate of any nation and the execution of view points of issues
form base level, the analysation of inflation rate is termed as the crucial element for this. As the
inflation rate depicts the tendency of increment and decrement in the consumption level of the
during the specified time period within the nation, besides this it is helpful in analysing and
collecting the comprehensive income and fluctuations in growth rate. The inflation rate clarifies
the scenarios and the variations among the decisions and changes. It represents the exact
tendency of variation. Its activities and practices helps in proper analysation of debates related to
the several sources. It is crucial to quantify the inflation rate for the proper analysation of the
economic condition of the nation. Its scope is limited to the evaluation of the growth rate of the
nation or economy but it is also used for analysing the fragmented information like employment
rate, job opportunities, production and services levels within the economy(Mullis, Foyand and
Arora, 2012).
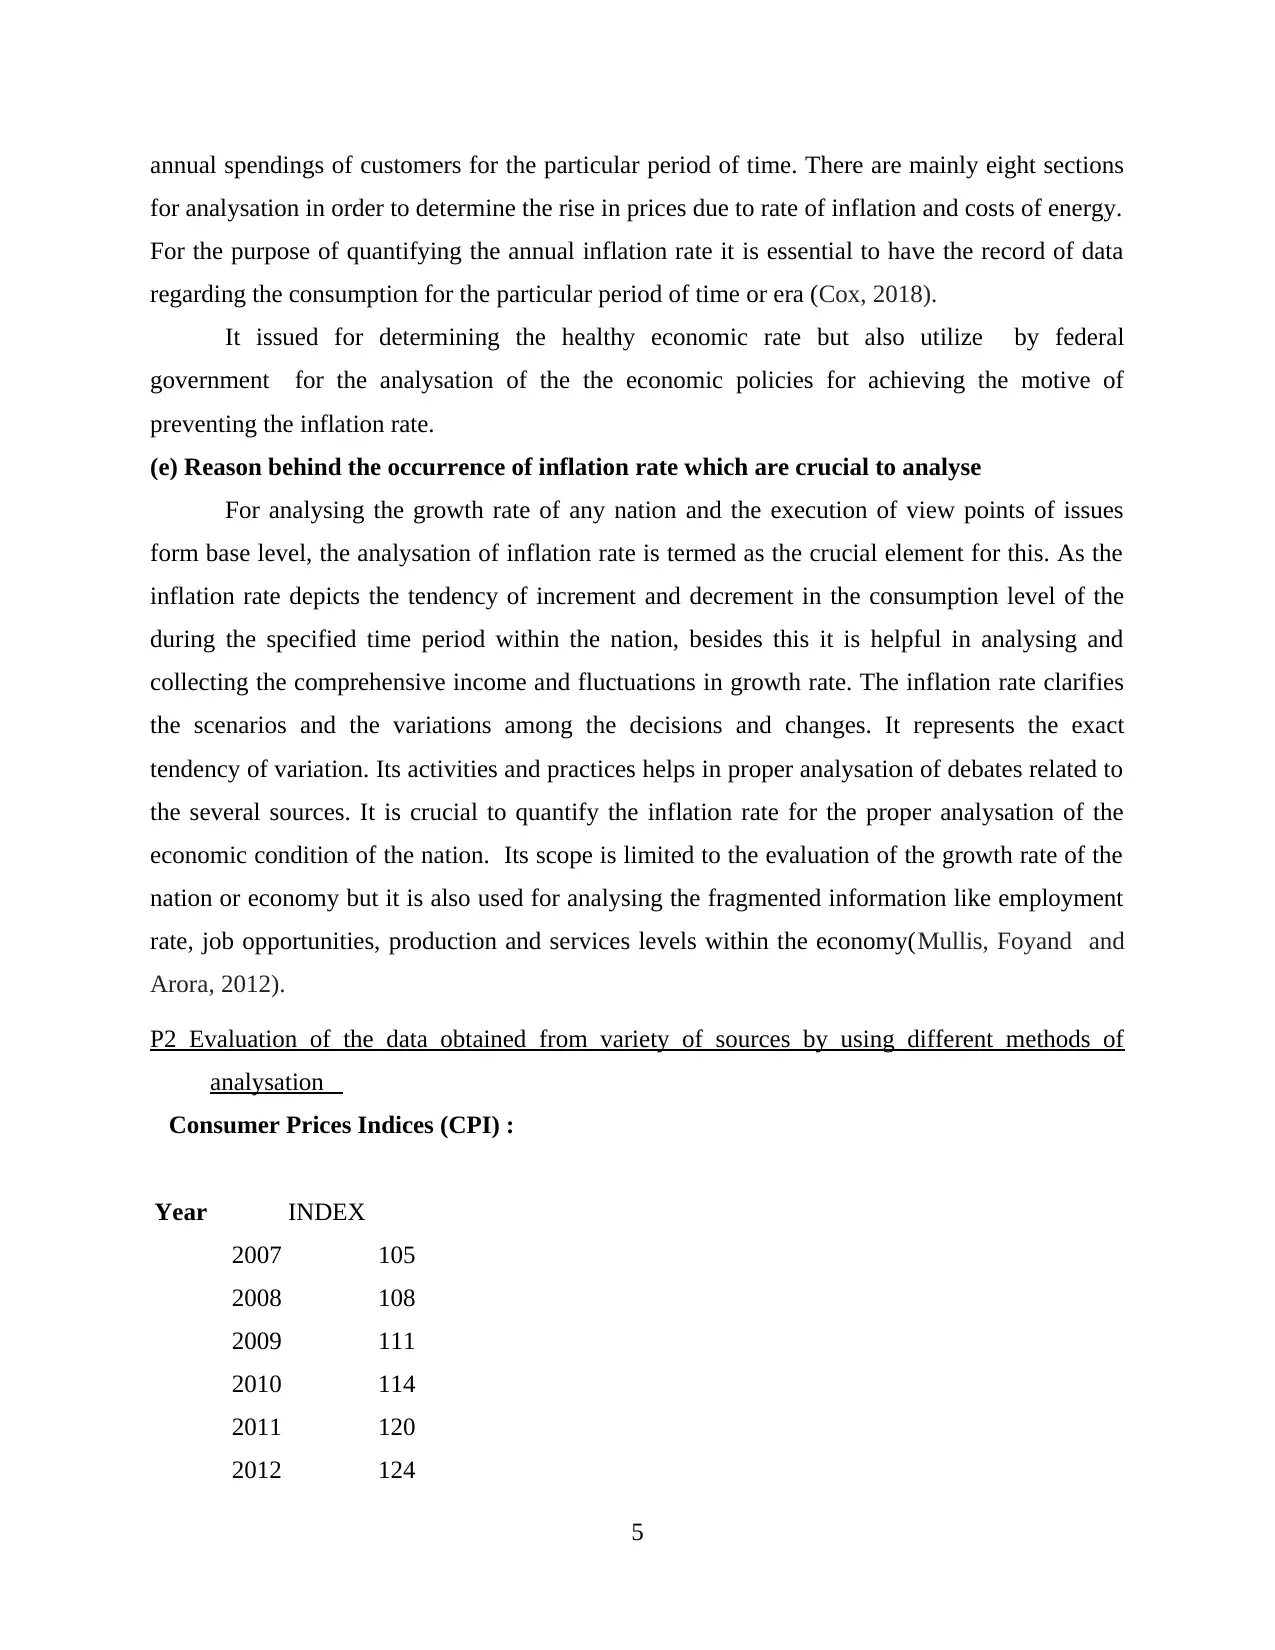
P2 Evaluation of the data obtained from variety of sources by using different methods of
analysation
Consumer Prices Indices (CPI) :
Year INDEX
2007 105
2008 108
2009 111
2010 114
2011 120
2012 124
5
for analysation in order to determine the rise in prices due to rate of inflation and costs of energy.
For the purpose of quantifying the annual inflation rate it is essential to have the record of data
regarding the consumption for the particular period of time or era (Cox, 2018).
It issued for determining the healthy economic rate but also utilize by federal
government for the analysation of the the economic policies for achieving the motive of
preventing the inflation rate.
(e) Reason behind the occurrence of inflation rate which are crucial to analyse
For analysing the growth rate of any nation and the execution of view points of issues
form base level, the analysation of inflation rate is termed as the crucial element for this. As the
inflation rate depicts the tendency of increment and decrement in the consumption level of the
during the specified time period within the nation, besides this it is helpful in analysing and
collecting the comprehensive income and fluctuations in growth rate. The inflation rate clarifies
the scenarios and the variations among the decisions and changes. It represents the exact
tendency of variation. Its activities and practices helps in proper analysation of debates related to
the several sources. It is crucial to quantify the inflation rate for the proper analysation of the
economic condition of the nation. Its scope is limited to the evaluation of the growth rate of the
nation or economy but it is also used for analysing the fragmented information like employment
rate, job opportunities, production and services levels within the economy(Mullis, Foyand and
Arora, 2012).
P2 Evaluation of the data obtained from variety of sources by using different methods of
analysation
Consumer Prices Indices (CPI) :
Year INDEX
2007 105
2008 108
2009 111
2010 114
2011 120
2012 124
5
Paraphrase This Document
Need a fresh take? Get an instant paraphrase of this document with our AI Paraphraser
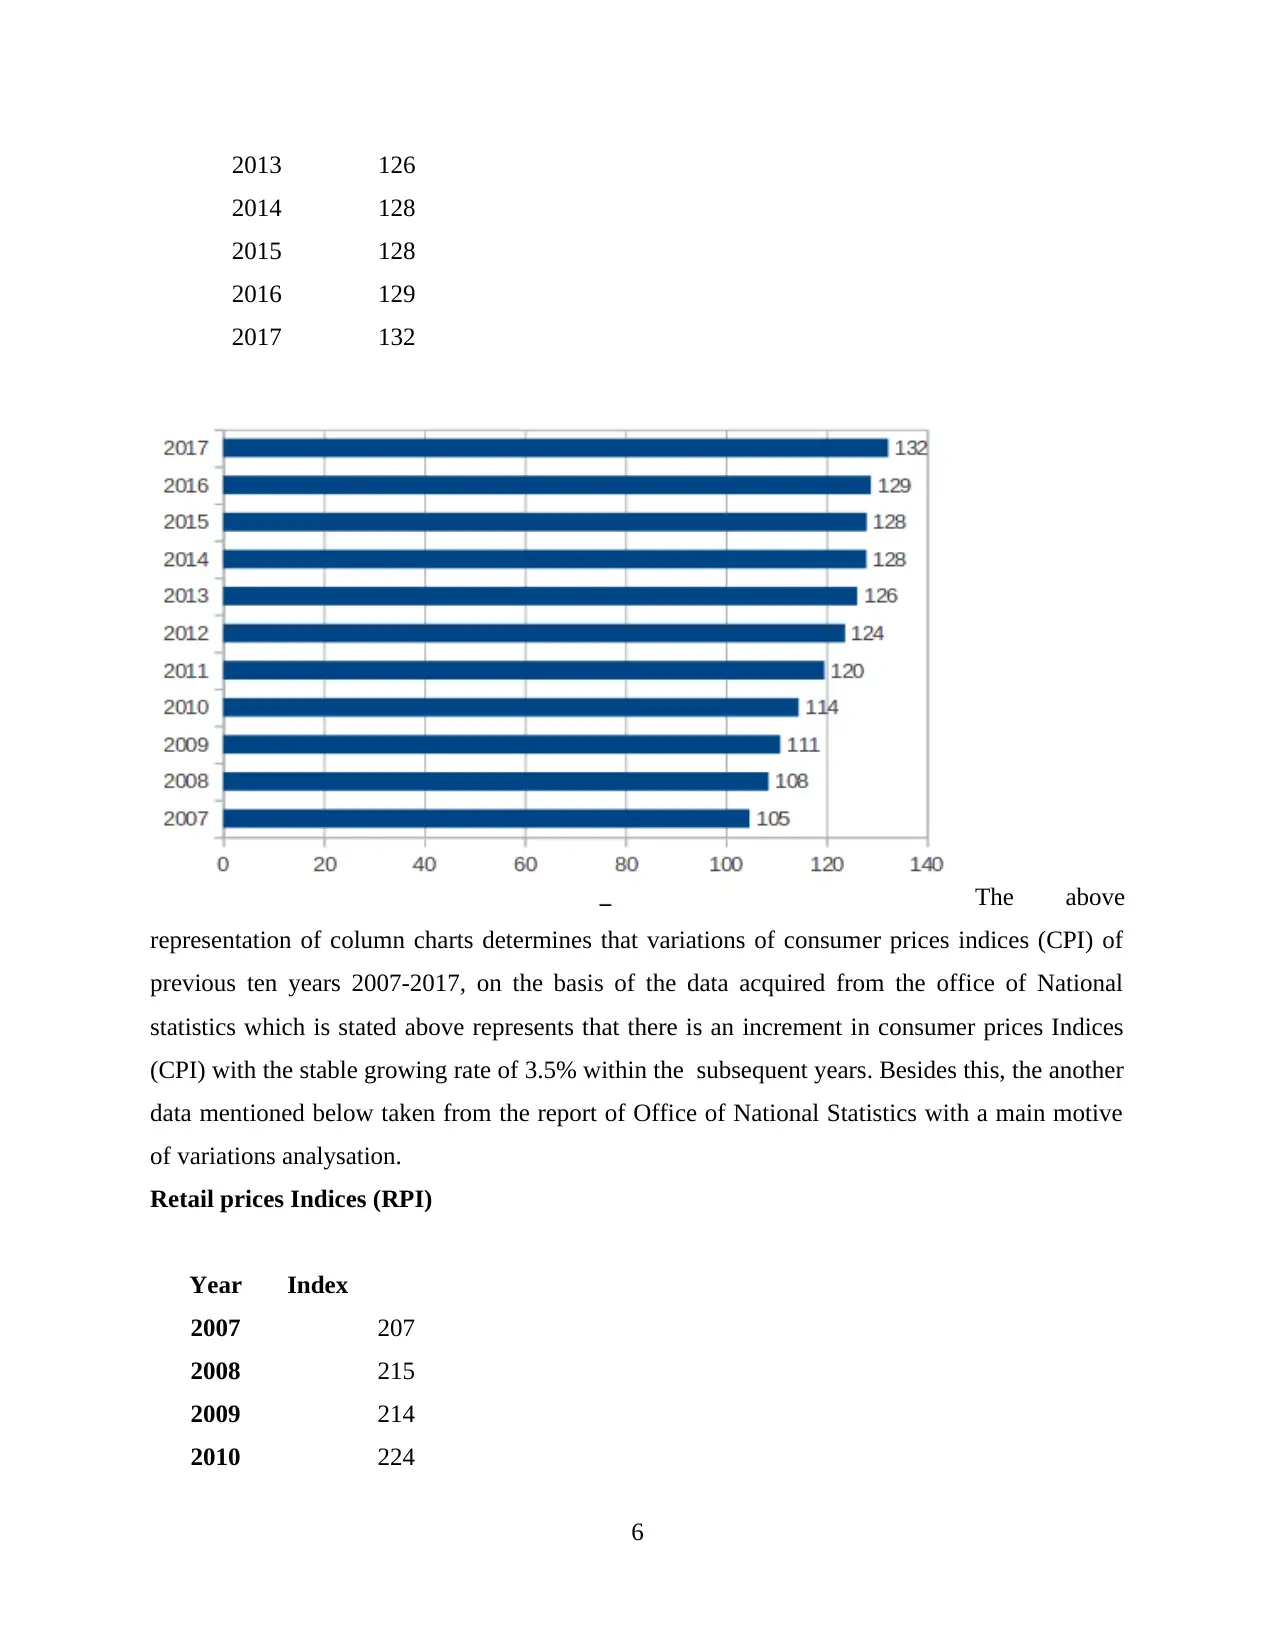
2013 126
2014 128
2015 128
2016 129
2017 132
The above
representation of column charts determines that variations of consumer prices indices (CPI) of
previous ten years 2007-2017, on the basis of the data acquired from the office of National
statistics which is stated above represents that there is an increment in consumer prices Indices
(CPI) with the stable growing rate of 3.5% within the subsequent years. Besides this, the another
data mentioned below taken from the report of Office of National Statistics with a main motive
of variations analysation.
Retail prices Indices (RPI)
Year Index
2007 207
2008 215
2009 214
2010 224
6
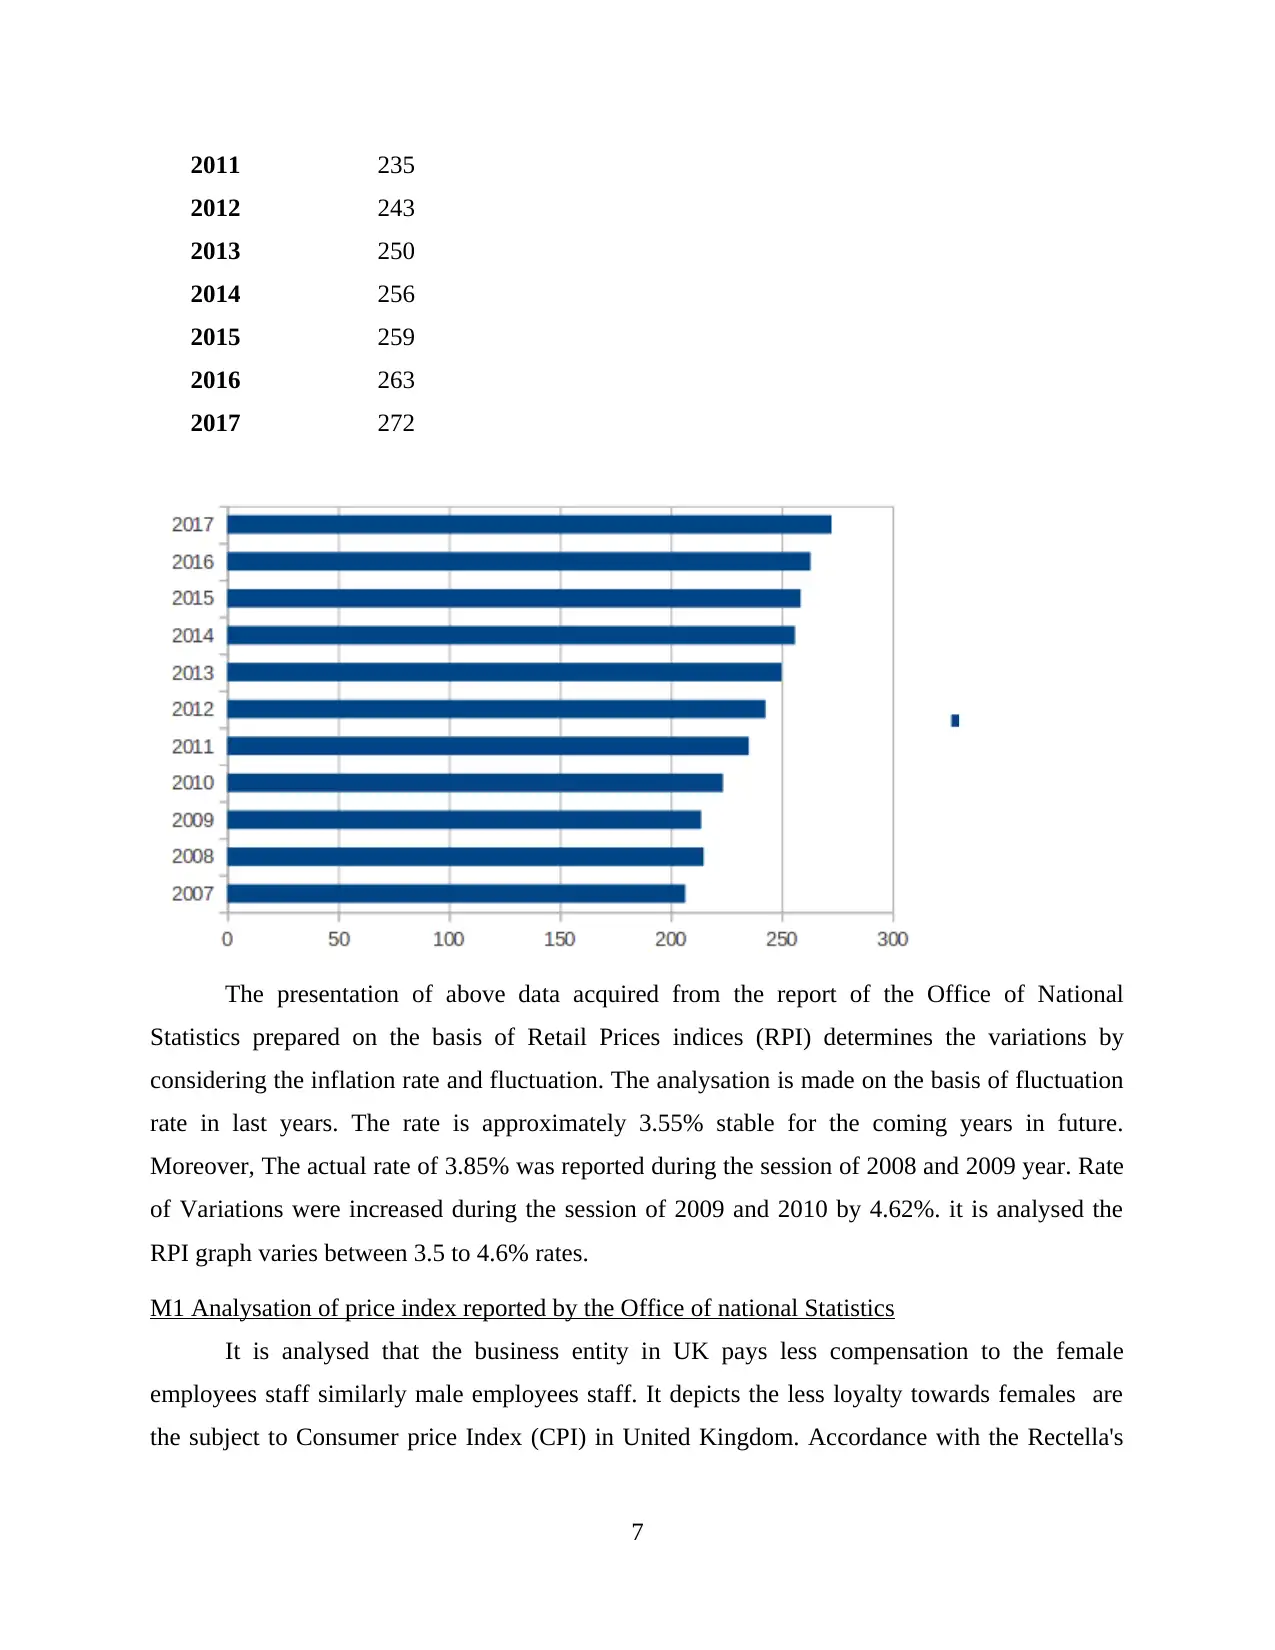
2011 235
2012 243
2013 250
2014 256
2015 259
2016 263
2017 272
The presentation of above data acquired from the report of the Office of National
Statistics prepared on the basis of Retail Prices indices (RPI) determines the variations by
considering the inflation rate and fluctuation. The analysation is made on the basis of fluctuation
rate in last years. The rate is approximately 3.55% stable for the coming years in future.
Moreover, The actual rate of 3.85% was reported during the session of 2008 and 2009 year. Rate
of Variations were increased during the session of 2009 and 2010 by 4.62%. it is analysed the
RPI graph varies between 3.5 to 4.6% rates.
M1 Analysation of price index reported by the Office of national Statistics
It is analysed that the business entity in UK pays less compensation to the female
employees staff similarly male employees staff. It depicts the less loyalty towards females are
the subject to Consumer price Index (CPI) in United Kingdom. Accordance with the Rectella's
7
⊘ This is a preview!⊘
Do you want full access?
Subscribe today to unlock all pages.
Trusted by 1+ million students worldwide
review as the material source that the sexual orientation pay hole was recorded as the 88%. the
middle quantified at 9.9% for the assumption as far as instalments. \
D1 Differentiation between the descriptive, Exploratory and Confirmatory analysis with
illustrations
Descriptive Exploratory Confirmatory
It is an systematic procedure
that represents the qualities,
features and capacities of
subjects. Probability and
analysed are used for the
peculiar reason.
It determines that what
information is necessary for
break down and how the it will
be outlined in most appropriate
manner for betterment in
execution(Slowiński, 2012)
It is type of analysis which
represents the information
regarding utilization by
conventional factual devices
like certainty, criticality and
surmising.
ACTIVITY 2
P3 Analysation of quantitative and qualitative data from the range of illustrations and suitable
statistical methods
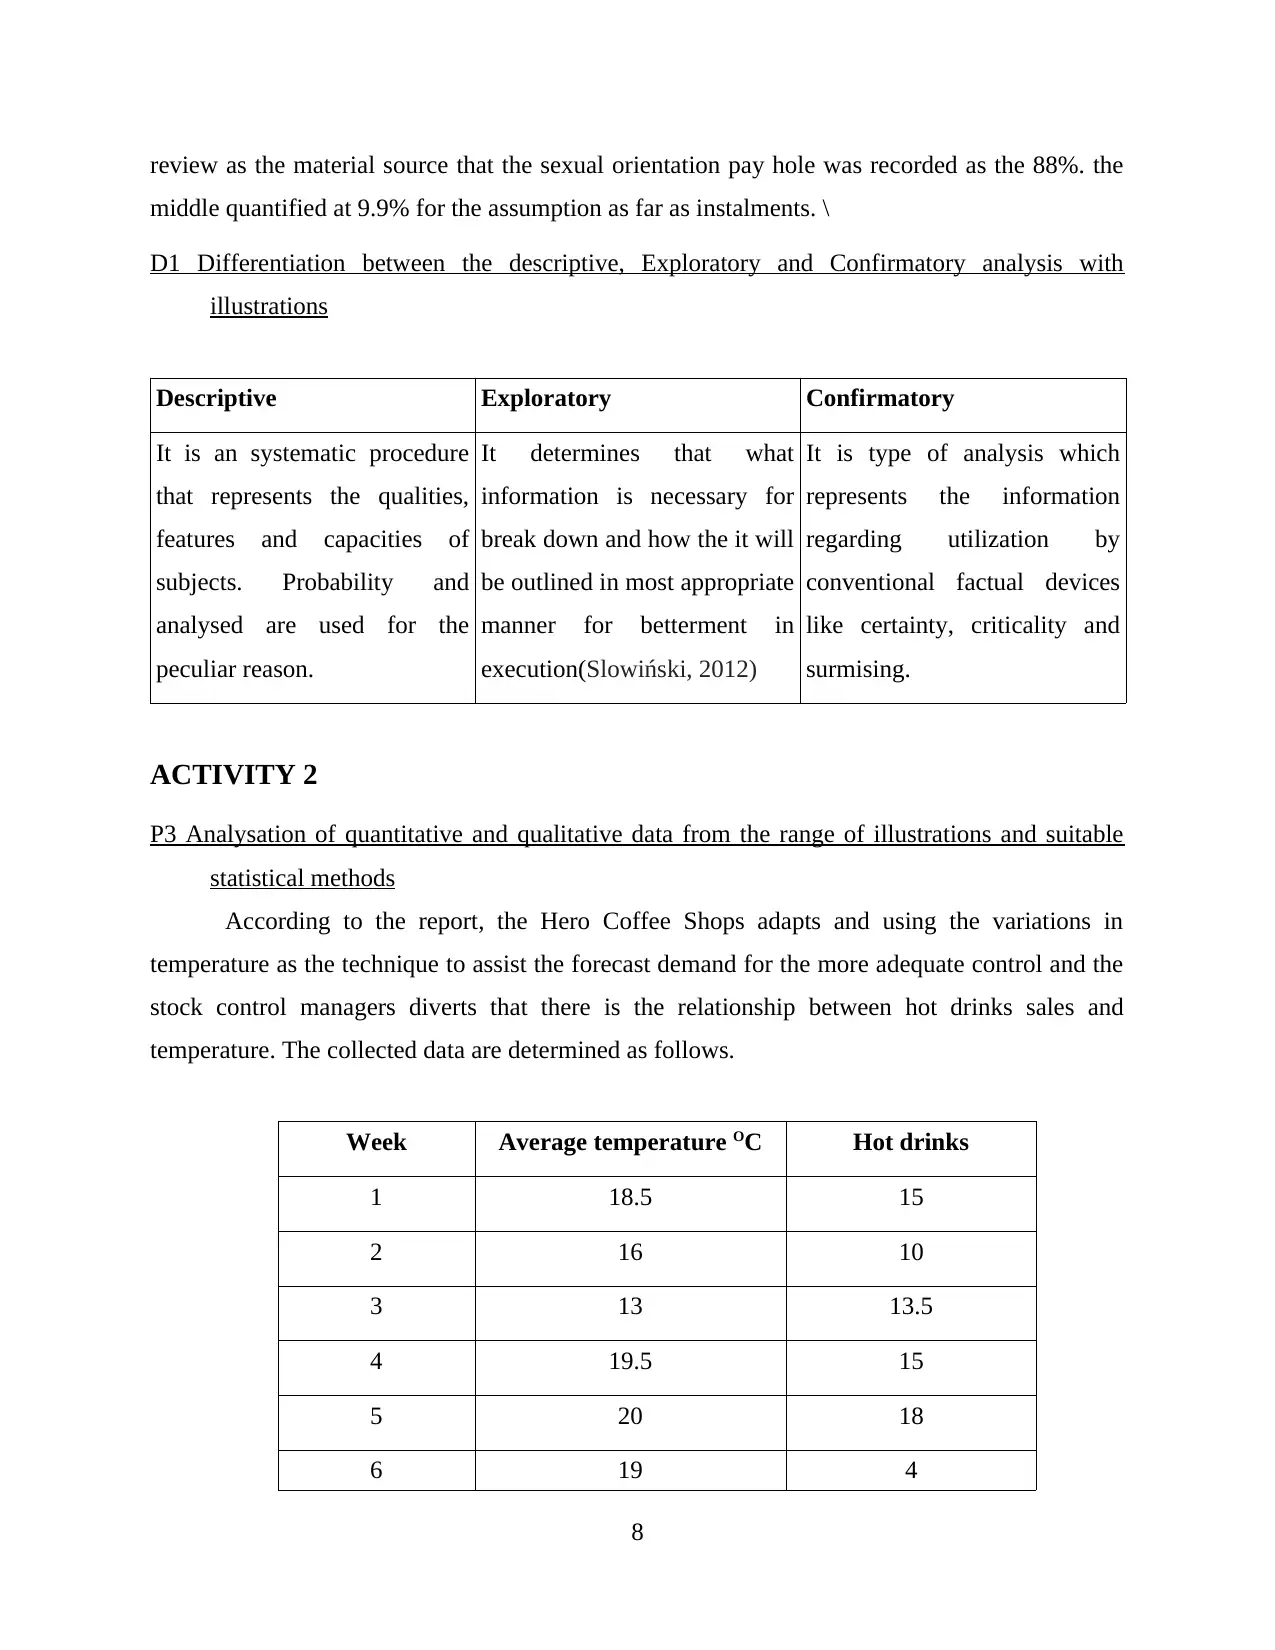
According to the report, the Hero Coffee Shops adapts and using the variations in
temperature as the technique to assist the forecast demand for the more adequate control and the
stock control managers diverts that there is the relationship between hot drinks sales and
temperature. The collected data are determined as follows.
Week Average temperature OC Hot drinks
1 18.5 15
2 16 10
3 13 13.5
4 19.5 15
5 20 18
6 19 4
8
middle quantified at 9.9% for the assumption as far as instalments. \
D1 Differentiation between the descriptive, Exploratory and Confirmatory analysis with
illustrations
Descriptive Exploratory Confirmatory
It is an systematic procedure
that represents the qualities,
features and capacities of
subjects. Probability and
analysed are used for the
peculiar reason.
It determines that what
information is necessary for
break down and how the it will
be outlined in most appropriate
manner for betterment in
execution(Slowiński, 2012)
It is type of analysis which
represents the information
regarding utilization by
conventional factual devices
like certainty, criticality and
surmising.
ACTIVITY 2
P3 Analysation of quantitative and qualitative data from the range of illustrations and suitable
statistical methods
According to the report, the Hero Coffee Shops adapts and using the variations in
temperature as the technique to assist the forecast demand for the more adequate control and the
stock control managers diverts that there is the relationship between hot drinks sales and
temperature. The collected data are determined as follows.
Week Average temperature OC Hot drinks
1 18.5 15
2 16 10
3 13 13.5
4 19.5 15
5 20 18
6 19 4
8
Paraphrase This Document
Need a fresh take? Get an instant paraphrase of this document with our AI Paraphraser
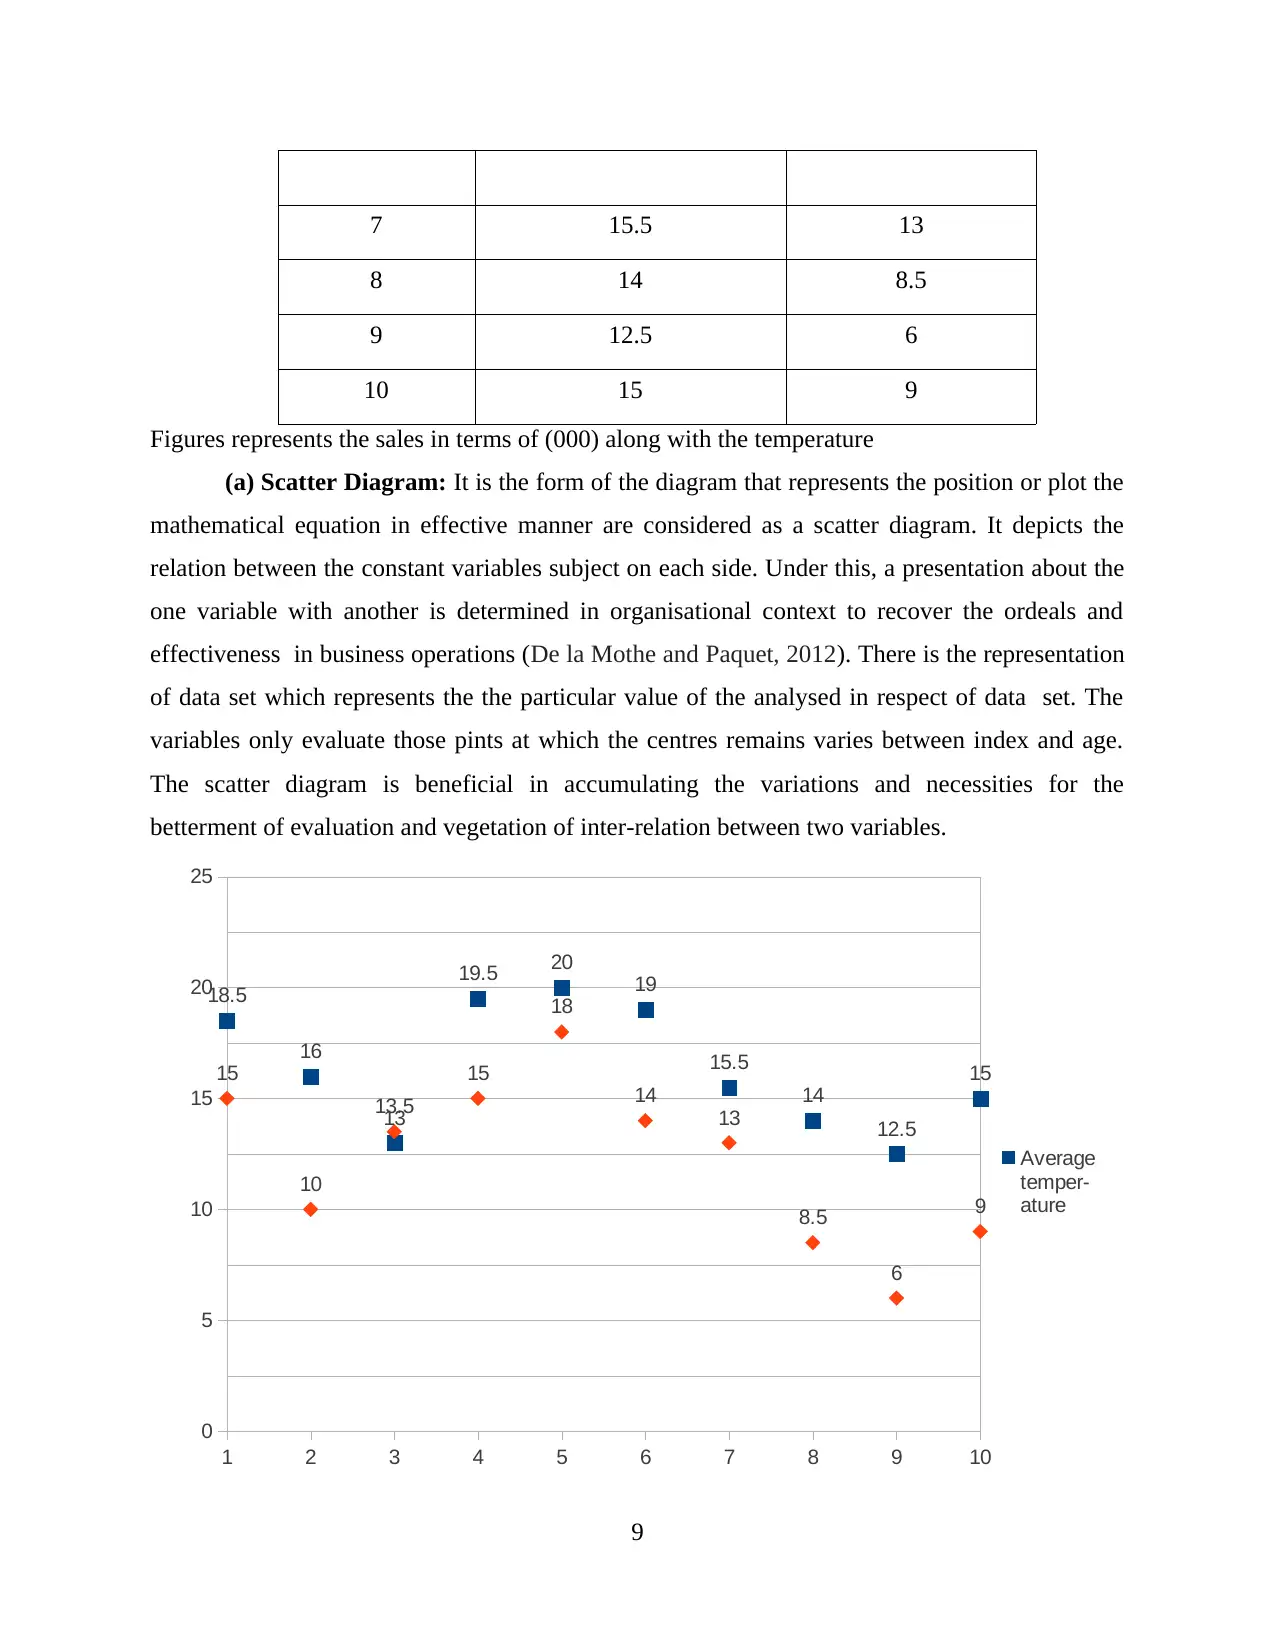
7 15.5 13
8 14 8.5
9 12.5 6
10 15 9
Figures represents the sales in terms of (000) along with the temperature
(a) Scatter Diagram: It is the form of the diagram that represents the position or plot the
mathematical equation in effective manner are considered as a scatter diagram. It depicts the
relation between the constant variables subject on each side. Under this, a presentation about the
one variable with another is determined in organisational context to recover the ordeals and
effectiveness in business operations (De la Mothe and Paquet, 2012). There is the representation
of data set which represents the the particular value of the analysed in respect of data set. The
variables only evaluate those pints at which the centres remains varies between index and age.
The scatter diagram is beneficial in accumulating the variations and necessities for the
betterment of evaluation and vegetation of inter-relation between two variables.
1 2 3 4 5 6 7 8 9 10
0
5
10
15
20
25
18.5
16
13
19.5 20
19
15.5
14
12.5
1515
10
13.5
15
18
14
13
8.5
6
9
Average
temper-
ature
9
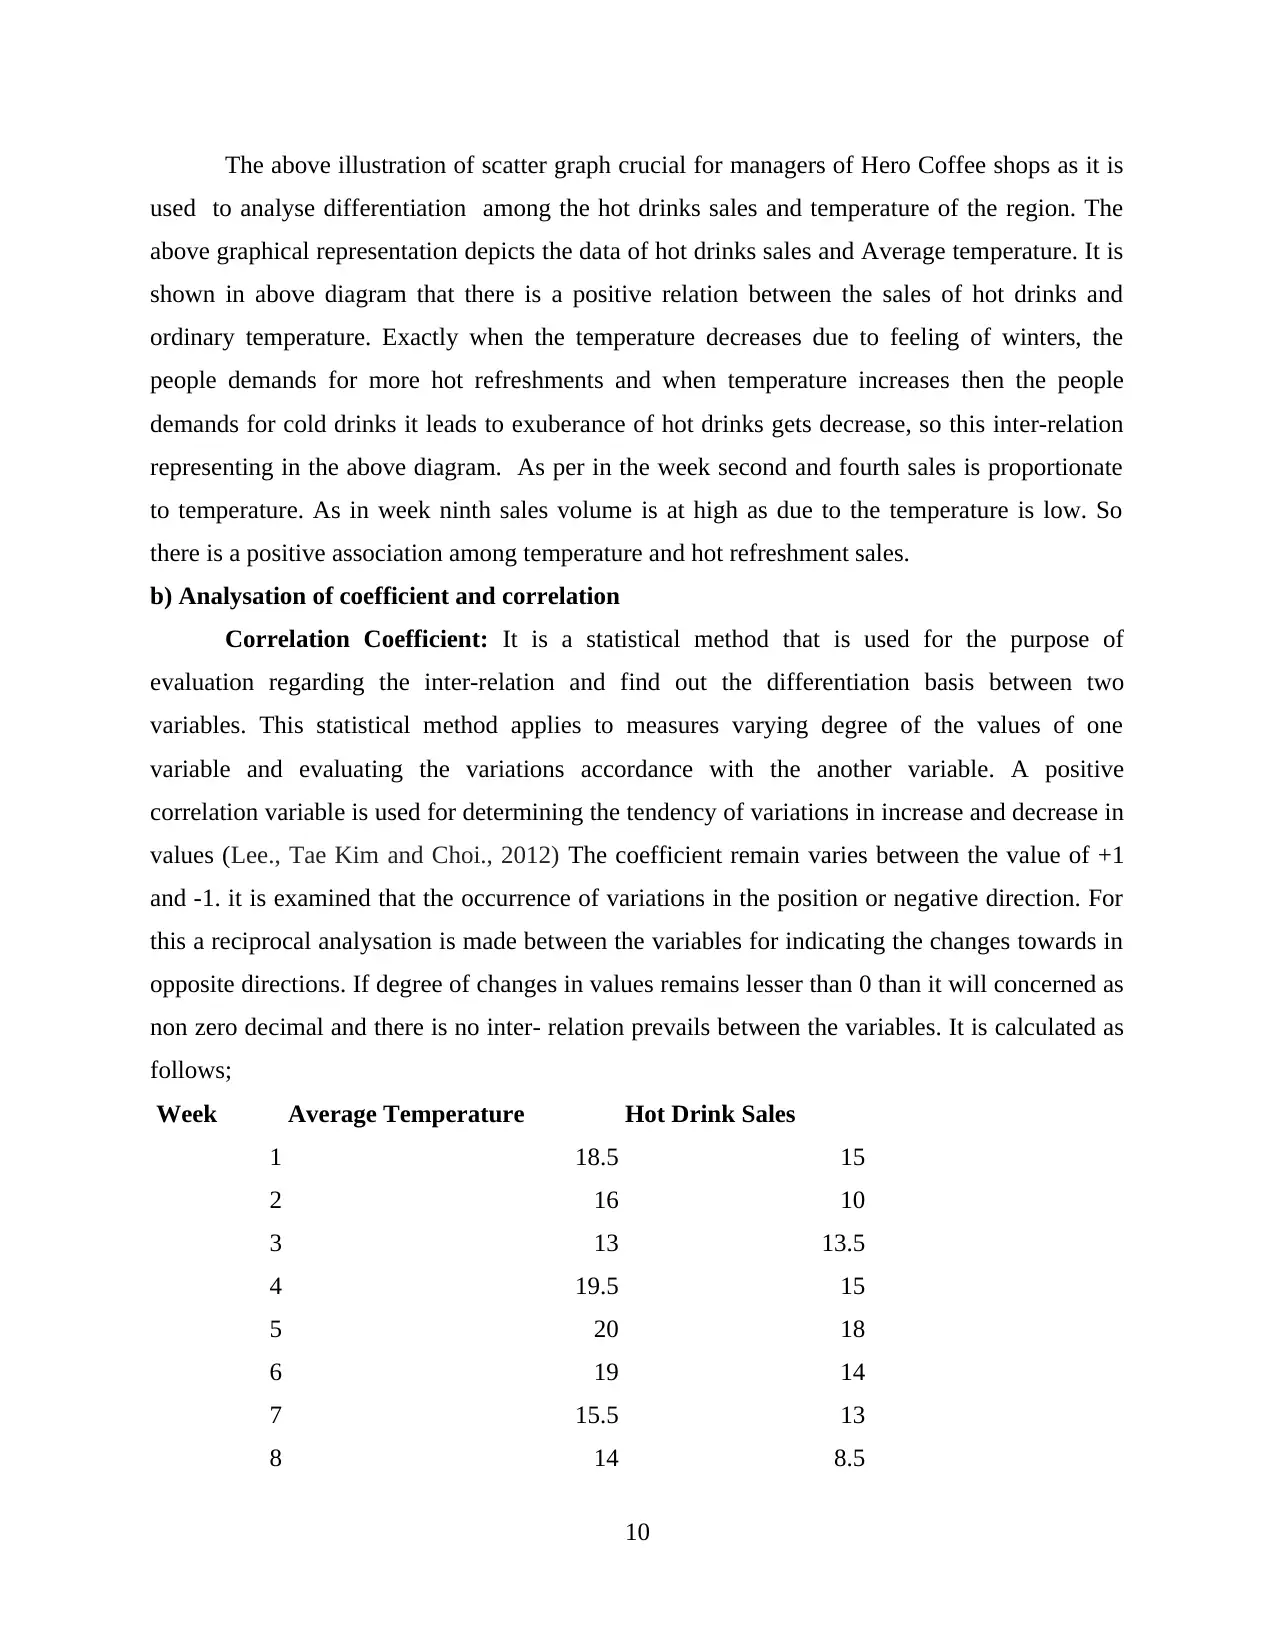
The above illustration of scatter graph crucial for managers of Hero Coffee shops as it is
used to analyse differentiation among the hot drinks sales and temperature of the region. The
above graphical representation depicts the data of hot drinks sales and Average temperature. It is
shown in above diagram that there is a positive relation between the sales of hot drinks and
ordinary temperature. Exactly when the temperature decreases due to feeling of winters, the
people demands for more hot refreshments and when temperature increases then the people
demands for cold drinks it leads to exuberance of hot drinks gets decrease, so this inter-relation
representing in the above diagram. As per in the week second and fourth sales is proportionate
to temperature. As in week ninth sales volume is at high as due to the temperature is low. So
there is a positive association among temperature and hot refreshment sales.
b) Analysation of coefficient and correlation
Correlation Coefficient: It is a statistical method that is used for the purpose of
evaluation regarding the inter-relation and find out the differentiation basis between two
variables. This statistical method applies to measures varying degree of the values of one
variable and evaluating the variations accordance with the another variable. A positive
correlation variable is used for determining the tendency of variations in increase and decrease in
values (Lee., Tae Kim and Choi., 2012) The coefficient remain varies between the value of +1
and -1. it is examined that the occurrence of variations in the position or negative direction. For
this a reciprocal analysation is made between the variables for indicating the changes towards in
opposite directions. If degree of changes in values remains lesser than 0 than it will concerned as
non zero decimal and there is no inter- relation prevails between the variables. It is calculated as
follows;
Week Average Temperature Hot Drink Sales
1 18.5 15
2 16 10
3 13 13.5
4 19.5 15
5 20 18
6 19 14
7 15.5 13
8 14 8.5
10
⊘ This is a preview!⊘
Do you want full access?
Subscribe today to unlock all pages.
Trusted by 1+ million students worldwide
1 out of 20
Related Documents


Your All-in-One AI-Powered Toolkit for Academic Success.
+13062052269
info@desklib.com
Available 24*7 on WhatsApp / Email
![[object Object]](/_next/static/media/star-bottom.7253800d.svg)
Unlock your academic potential
Copyright © 2020–2026 A2Z Services. All Rights Reserved. Developed and managed by ZUCOL.