Researching Business Data: UK Employment Trends (LSST Module)

Verified

Added on  2023/06/17

|2
|763
|63
Presentation
AI Summary
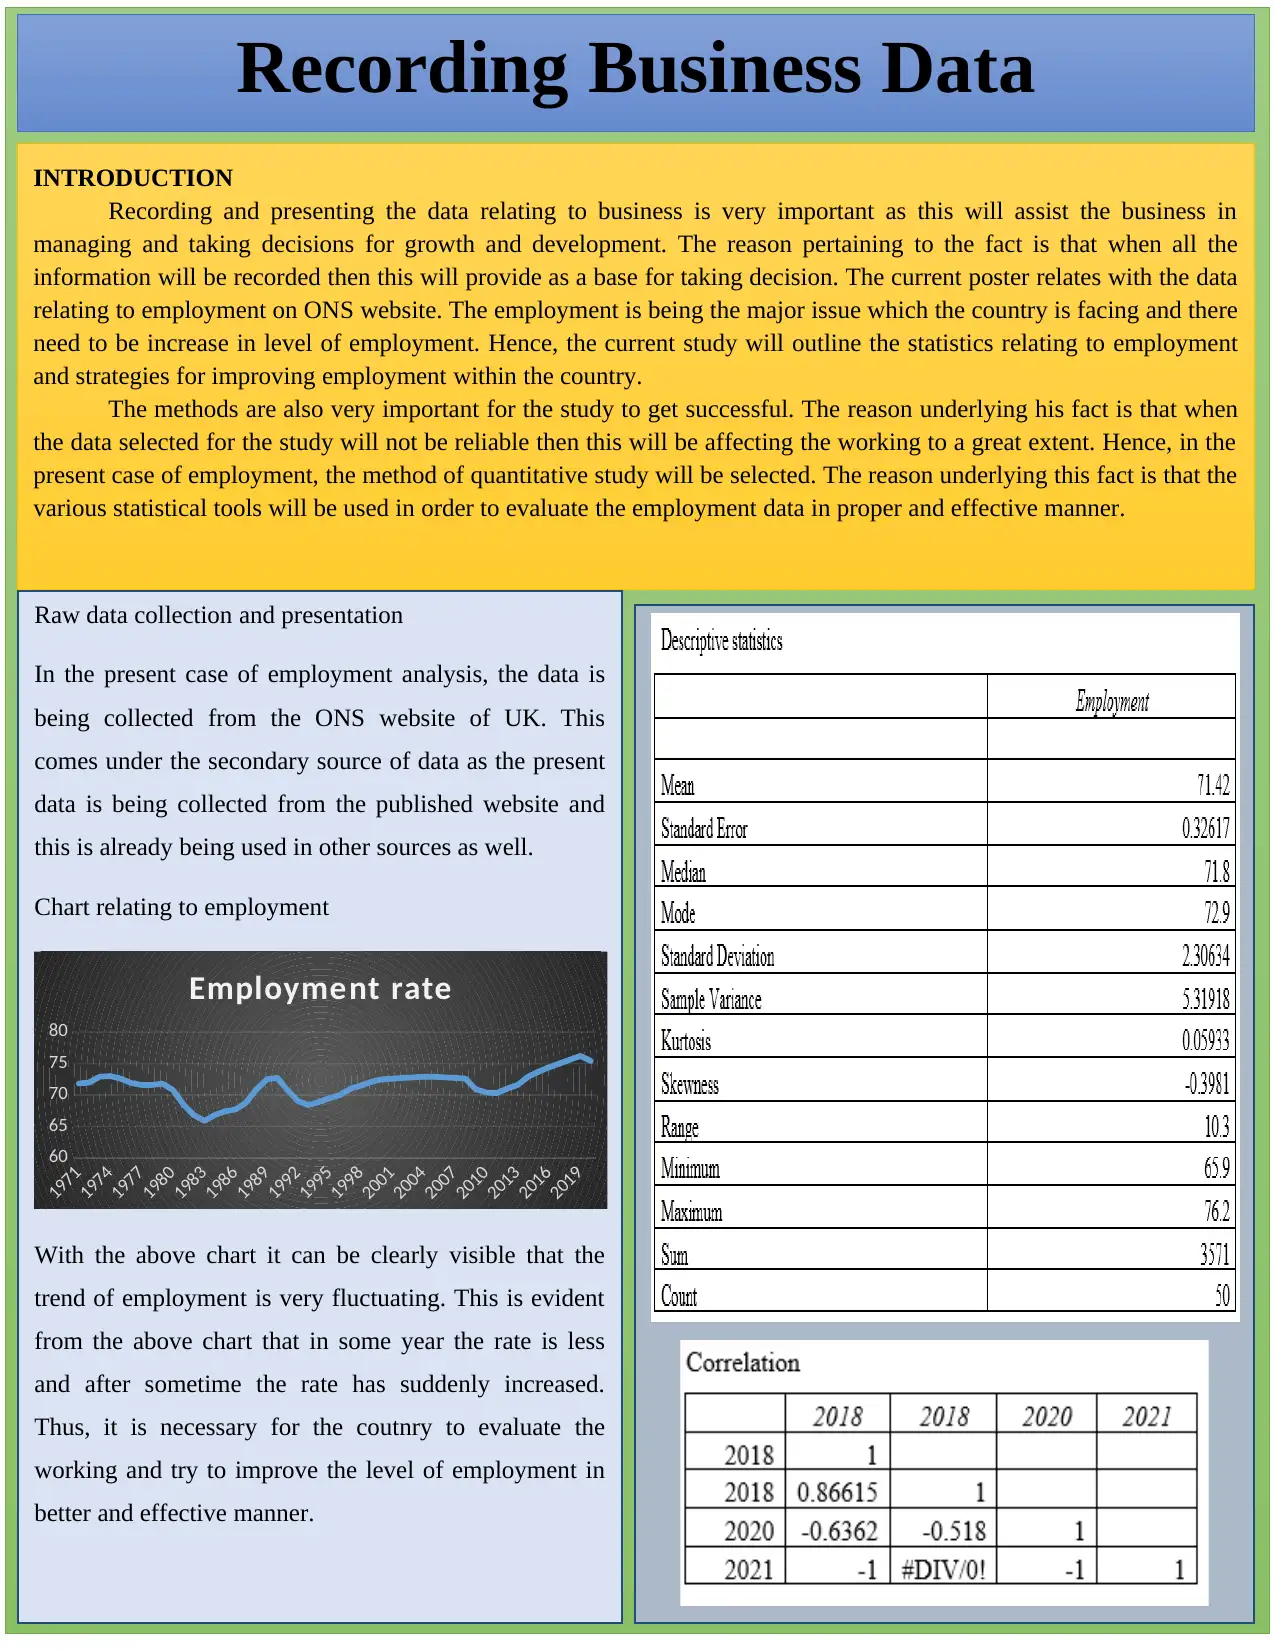
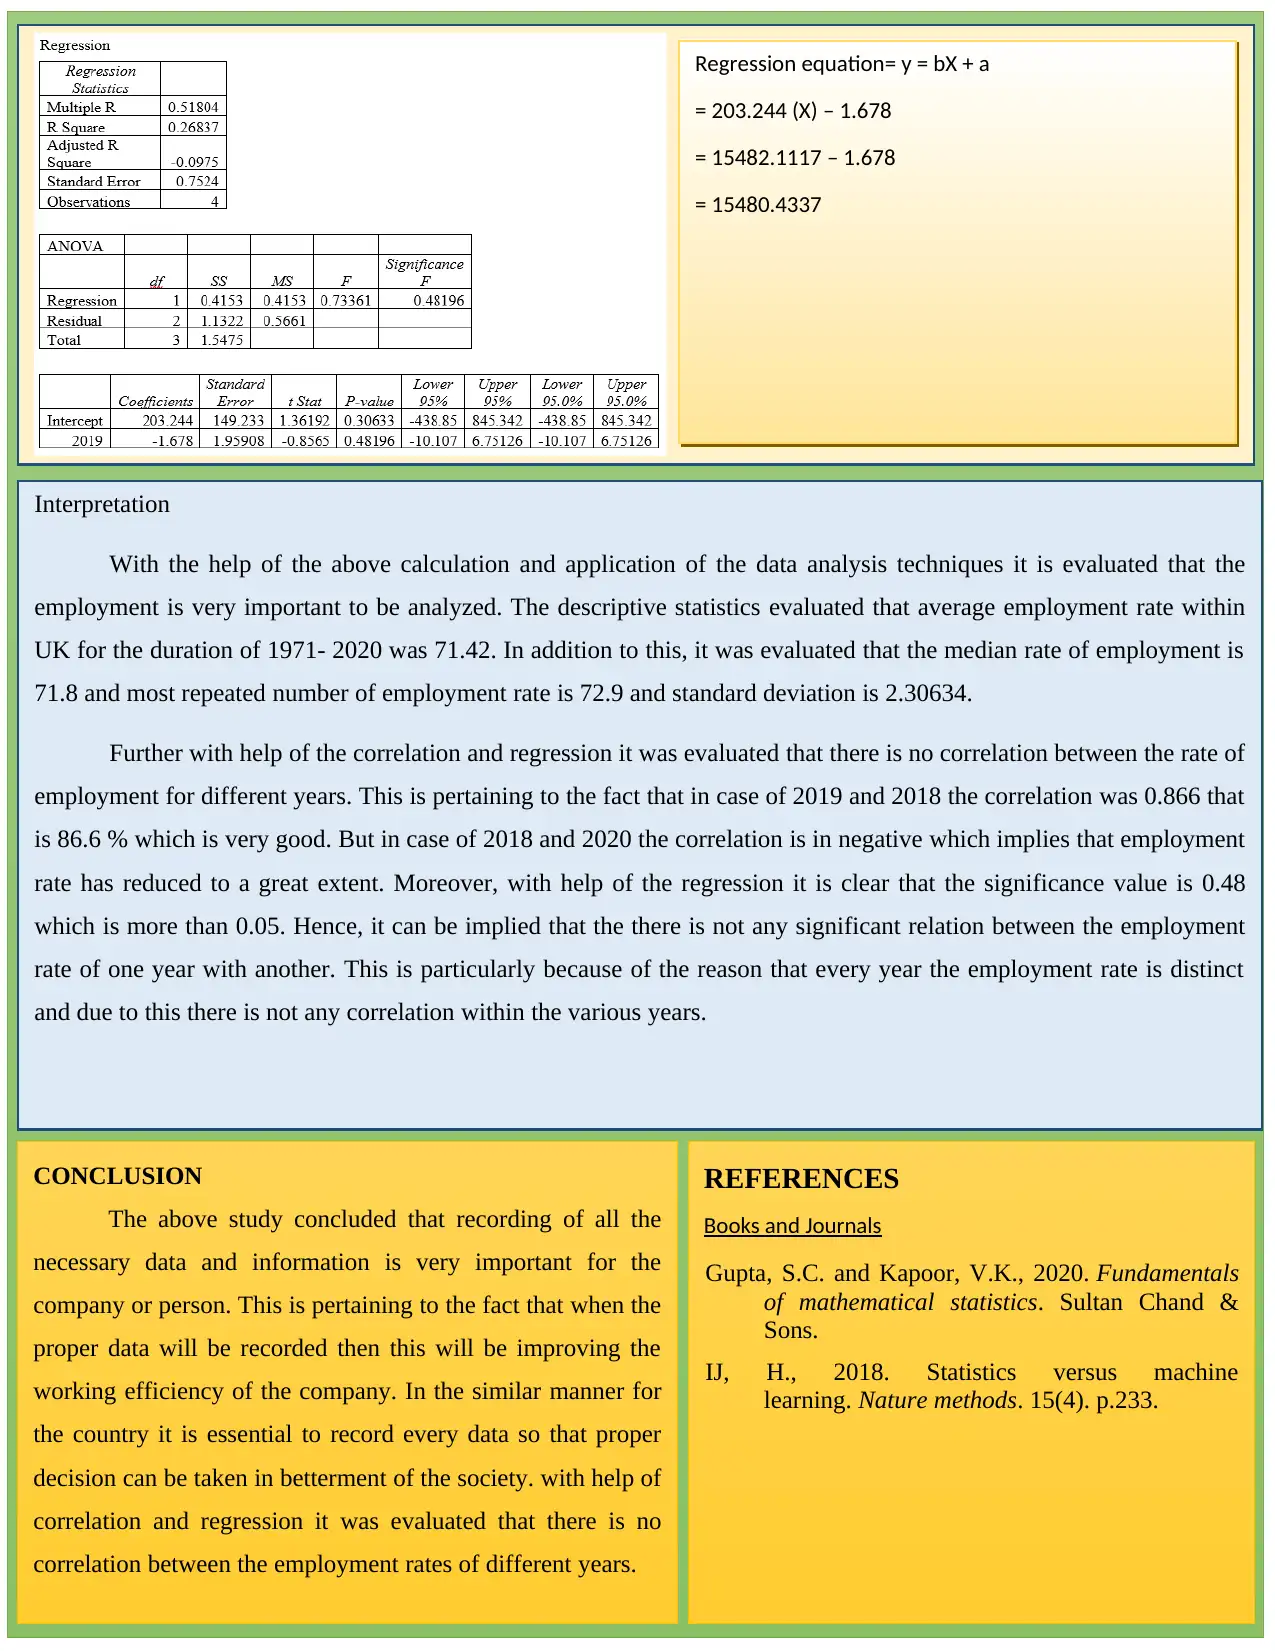
This presentation analyzes employment trends in the UK using data from the ONS website. It employs quantitative methods and descriptive statistics, including mean, median, mode, and standard deviation, to evaluate employment data from 1971 to 2020. Correlation and regression analyses are used to determine relationships between employment rates in different years. The study concludes that while recording data is crucial for informed decision-making, there is no significant correlation between employment rates across different years, highlighting the fluctuating nature of employment in the UK. Desklib is a platform where students can find similar solved assignments and past papers.
Document Page
Recording Business Data
INTRODUCTION
Recording and presenting the data relating to business is very important as this will assist the business in
managing and taking decisions for growth and development. The reason pertaining to the fact is that when all the
information will be recorded then this will provide as a base for taking decision. The current poster relates with the data
relating to employment on ONS website. The employment is being the major issue which the country is facing and there
need to be increase in level of employment. Hence, the current study will outline the statistics relating to employment
and strategies for improving employment within the country.
The methods are also very important for the study to get successful. The reason underlying his fact is that when
the data selected for the study will not be reliable then this will be affecting the working to a great extent. Hence, in the
present case of employment, the method of quantitative study will be selected. The reason underlying this fact is that the
various statistical tools will be used in order to evaluate the employment data in proper and effective manner.
Raw data collection and presentation
In the present case of employment analysis, the data is
being collected from the ONS website of UK. This
comes under the secondary source of data as the present
data is being collected from the published website and
this is already being used in other sources as well.
Chart relating to employment
1971
1974
1977
1980
1983
1986
1989
1992
1995
1998
2001
2004
2007
2010
2013
2016
2019
60
65
70
75
80
Employment rate
With the above chart it can be clearly visible that the
trend of employment is very fluctuating. This is evident
from the above chart that in some year the rate is less
and after sometime the rate has suddenly increased.
Thus, it is necessary for the coutnry to evaluate the
working and try to improve the level of employment in
better and effective manner.
tabler-icon-diamond-filled.svg

Secure Best Marks with AI Grader

Need help grading? Try our AI Grader for instant feedback on your assignments.
Document Page
Interpretation
With the help of the above calculation and application of the data analysis techniques it is evaluated that the
employment is very important to be analyzed. The descriptive statistics evaluated that average employment rate within
UK for the duration of 1971- 2020 was 71.42. In addition to this, it was evaluated that the median rate of employment is
71.8 and most repeated number of employment rate is 72.9 and standard deviation is 2.30634.
Further with help of the correlation and regression it was evaluated that there is no correlation between the rate of
employment for different years. This is pertaining to the fact that in case of 2019 and 2018 the correlation was 0.866 that
is 86.6 % which is very good. But in case of 2018 and 2020 the correlation is in negative which implies that employment
rate has reduced to a great extent. Moreover, with help of the regression it is clear that the significance value is 0.48
which is more than 0.05. Hence, it can be implied that the there is not any significant relation between the employment
rate of one year with another. This is particularly because of the reason that every year the employment rate is distinct
and due to this there is not any correlation within the various years.
CONCLUSION
The above study concluded that recording of all the
necessary data and information is very important for the
company or person. This is pertaining to the fact that when the
proper data will be recorded then this will be improving the
working efficiency of the company. In the similar manner for
the country it is essential to record every data so that proper
decision can be taken in betterment of the society. with help of
correlation and regression it was evaluated that there is no
correlation between the employment rates of different years.
REFERENCES
Books and Journals
Gupta, S.C. and Kapoor, V.K., 2020. Fundamentals
of mathematical statistics. Sultan Chand &
Sons.
IJ, H., 2018. Statistics versus machine
learning. Nature methods. 15(4). p.233.
Regression equation= y = bX + a
= 203.244 (X) – 1.678
= 15482.1117 – 1.678
= 15480.4337
chevron_up_icon
1 out of 2
circle_padding
hide_on_mobile
zoom_out_icon
[object Object]