Decision Analysis Assignment Solution - Business Development Module
VerifiedAdded on 2023/03/17
|14
|5606
|55
Homework Assignment
AI Summary
This assignment solution covers several key aspects of decision analysis, including the use of payoff matrices and decision trees, and their advantages in different scenarios. It analyzes a case study involving industrial robots, constructing a payoff matrix to evaluate different investment strategies under varying market conditions. The solution explores decision-making criteria such as maximax, maximin, Laplace, and regret, along with expected value calculations. Furthermore, it presents a simulation model for an airline, analyzing overbooking scenarios and their impact on profitability, as well as regression analysis, to determine the relationship between GPA and GMAT scores, and GPA and age. The assignment provides a thorough understanding of decision-making techniques and their applications in business contexts.
Running head: INFORMATION AND DECISION ANALYSIS
Information and Decision Analysis
Name of the Student:
Name of the University:
Author Note:
Information and Decision Analysis
Name of the Student:
Name of the University:
Author Note:
Paraphrase This Document
Need a fresh take? Get an instant paraphrase of this document with our AI Paraphraser
1INFORMATION AND DECISION ANALYSIS
Table of Contents
Answer 1.A................................................................................................................................3
Advantage of using payoff matrix..............................................................................................3
Answer 1.B.................................................................................................................................3
Advantage of using decision trees..............................................................................................3
Answer 1.C.1..............................................................................................................................3
Answer 1.C.2..............................................................................................................................3
Answer 1.C.3..............................................................................................................................4
Answer 1.C.4..............................................................................................................................4
Answer 1.C.5..............................................................................................................................4
Answer 1.C.6..............................................................................................................................4
Answer 1.C.7..............................................................................................................................4
Answer 2.a..................................................................................................................................5
Answer 2.b.................................................................................................................................5
Answer 2.c..................................................................................................................................5
Answer 2.d.................................................................................................................................5
Answer 3.1.................................................................................................................................5
Answer 3.2.................................................................................................................................7
Answer 3.3.................................................................................................................................7
Answer 4.1.................................................................................................................................7
Answer 4.2...............................................................................................................................10
Answer 4.3...............................................................................................................................10
2INFORMATION AND DECISION ANALYSIS
Answer 5.1.1............................................................................................................................11
Answer 5.1.2............................................................................................................................11
Answer 5.2...............................................................................................................................11
Answer 5.3...............................................................................................................................11
Answer 5.4...............................................................................................................................11
Reference..................................................................................................................................13
⊘ This is a preview!⊘
Do you want full access?
Subscribe today to unlock all pages.
Trusted by 1+ million students worldwide
3INFORMATION AND DECISION ANALYSIS
Answer 1.A
Advantage of using payoff matrix
The payoff matrix is useful in case of simultaneous moves with symmetric or
asymmetric information in one or more given condition (Bradley, 2017).
Answer 1.B
Advantage of using decision trees
The decision trees are very help full in case of sequential moves with full or
asymmetric information and one or more existing condition. The decision trees are preferred
to a payoff matrix in case of repetitive or sequential moves for taking decisions (White,
2018).
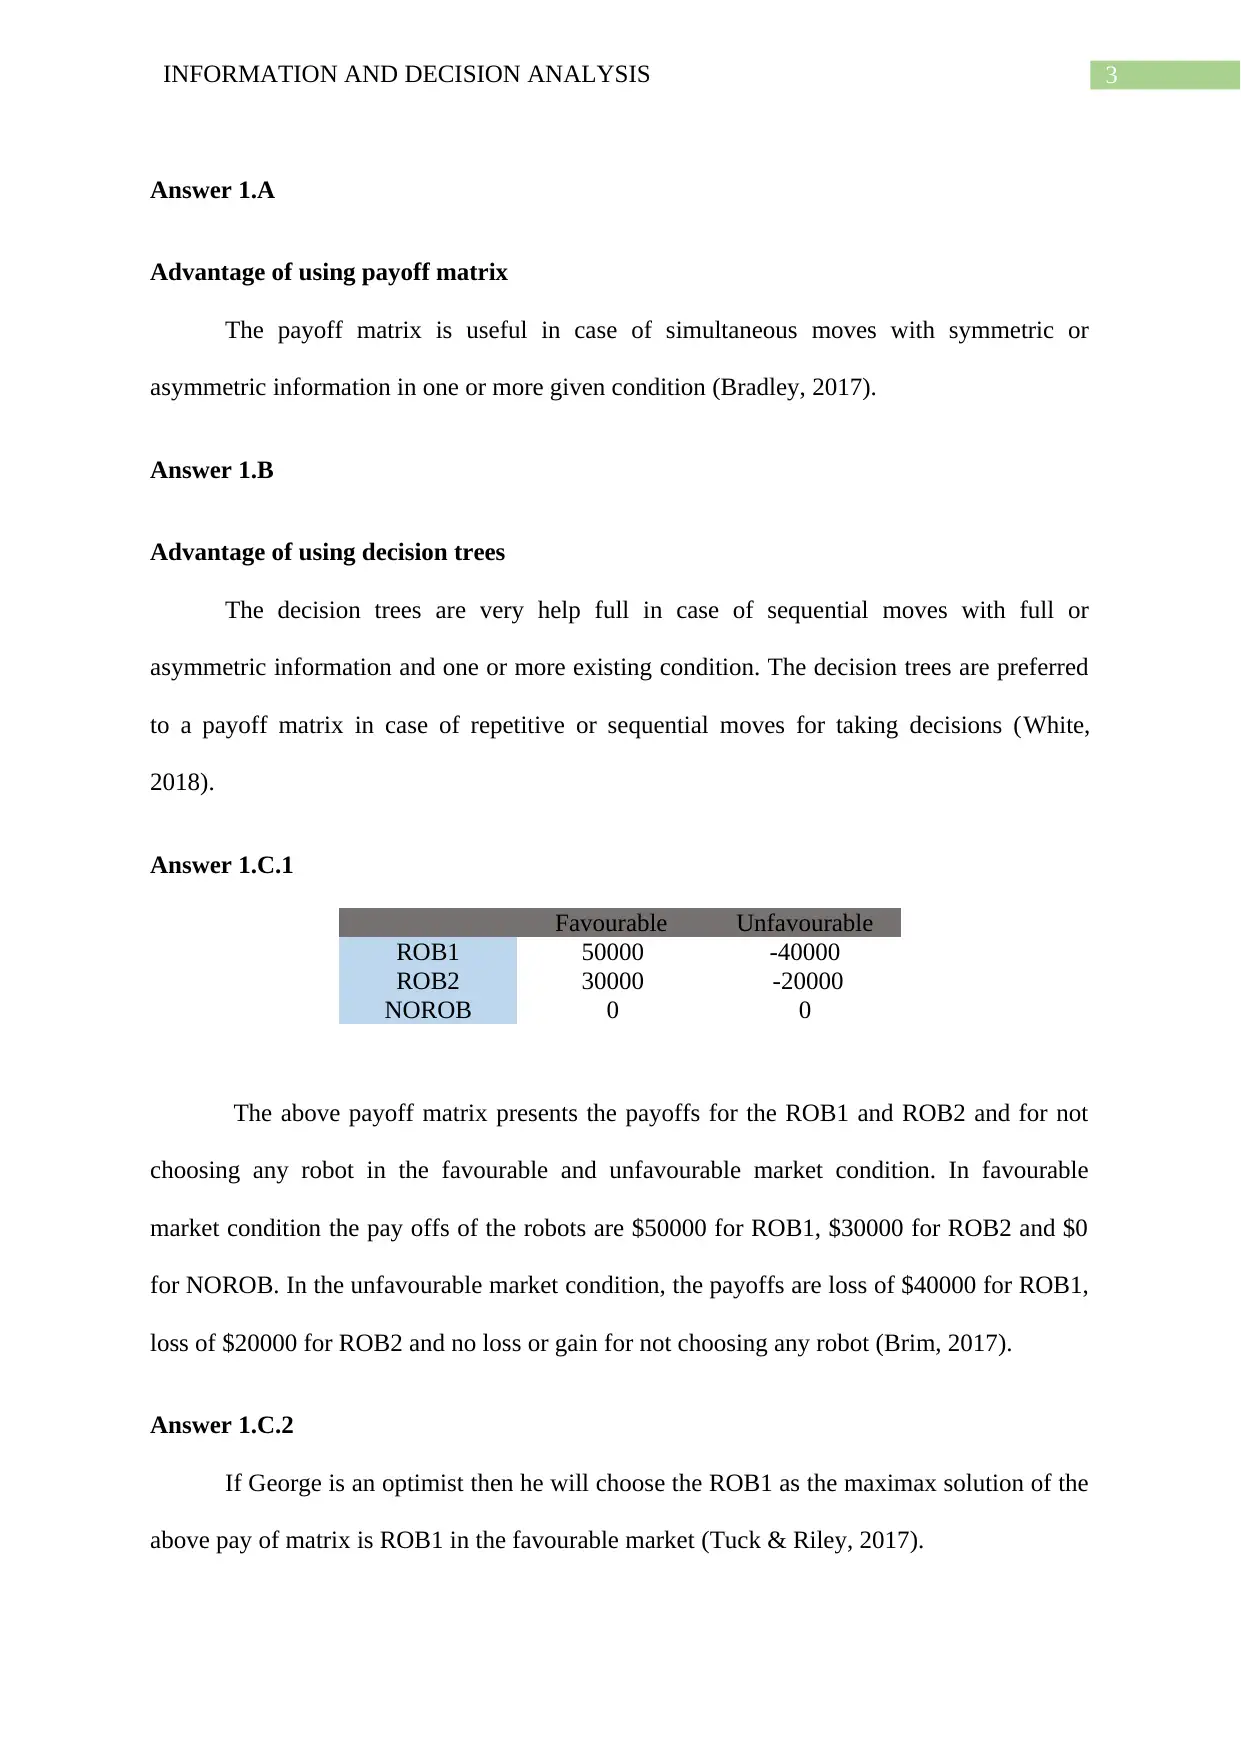
Answer 1.C.1
Favourable Unfavourable
ROB1 50000 -40000
ROB2 30000 -20000
NOROB 0 0
The above payoff matrix presents the payoffs for the ROB1 and ROB2 and for not
choosing any robot in the favourable and unfavourable market condition. In favourable
market condition the pay offs of the robots are $50000 for ROB1, $30000 for ROB2 and $0
for NOROB. In the unfavourable market condition, the payoffs are loss of $40000 for ROB1,
loss of $20000 for ROB2 and no loss or gain for not choosing any robot (Brim, 2017).
Answer 1.C.2
If George is an optimist then he will choose the ROB1 as the maximax solution of the
above pay of matrix is ROB1 in the favourable market (Tuck & Riley, 2017).
Answer 1.A
Advantage of using payoff matrix
The payoff matrix is useful in case of simultaneous moves with symmetric or
asymmetric information in one or more given condition (Bradley, 2017).
Answer 1.B
Advantage of using decision trees
The decision trees are very help full in case of sequential moves with full or
asymmetric information and one or more existing condition. The decision trees are preferred
to a payoff matrix in case of repetitive or sequential moves for taking decisions (White,
2018).
Answer 1.C.1
Favourable Unfavourable
ROB1 50000 -40000
ROB2 30000 -20000
NOROB 0 0
The above payoff matrix presents the payoffs for the ROB1 and ROB2 and for not
choosing any robot in the favourable and unfavourable market condition. In favourable
market condition the pay offs of the robots are $50000 for ROB1, $30000 for ROB2 and $0
for NOROB. In the unfavourable market condition, the payoffs are loss of $40000 for ROB1,
loss of $20000 for ROB2 and no loss or gain for not choosing any robot (Brim, 2017).
Answer 1.C.2
If George is an optimist then he will choose the ROB1 as the maximax solution of the
above pay of matrix is ROB1 in the favourable market (Tuck & Riley, 2017).
Paraphrase This Document
Need a fresh take? Get an instant paraphrase of this document with our AI Paraphraser
4INFORMATION AND DECISION ANALYSIS
Answer 1.C.3
If George is a pessimist then he will not choose any robot as the maximin solution of
the above pay of matrix is NOROB in the favourable and unfavourable market (Thompson,
2017).
Answer 1.C.4
Payoff for the ROB1 according to the Laplace criterion: (50000*0.5) + (-40000*0.5) =
$5000.
Payoff for the ROB1 according to the Laplace criterion: (30000*0.5) + (-20000*0.5) =
$5000.
Payoff for the NOROB according to the Laplace criterion: (0*0.5) + (0*0.5) = $0.
The optimum solution according to the Laplace criterion is choosing ROB1 and
ROB2 as the expected payoff for ROB1 and ROB2 (Peterson, 2017).
Answer 1.C.5
According to the criterion of regret the optimum solution is choosing NOROB as the
regret for NOROB is minimum.
Answer 1.C.6
When the probability of favourable market is 0.6 then:
Expected return for ROB1: (50000*0.6) + (-40000*0.4) = $14000
Expected return for ROB1: (30000*0.6) + (-20000*0.4) = $10000
Expected return for NOROB: (0*0.6) + (0*0.4) = $0
Therefore, the optimum solution is choosing the ROB1 as the expected value of
ROB1 is higher than the other strategies (Kreps, 2018).
5INFORMATION AND DECISION ANALYSIS
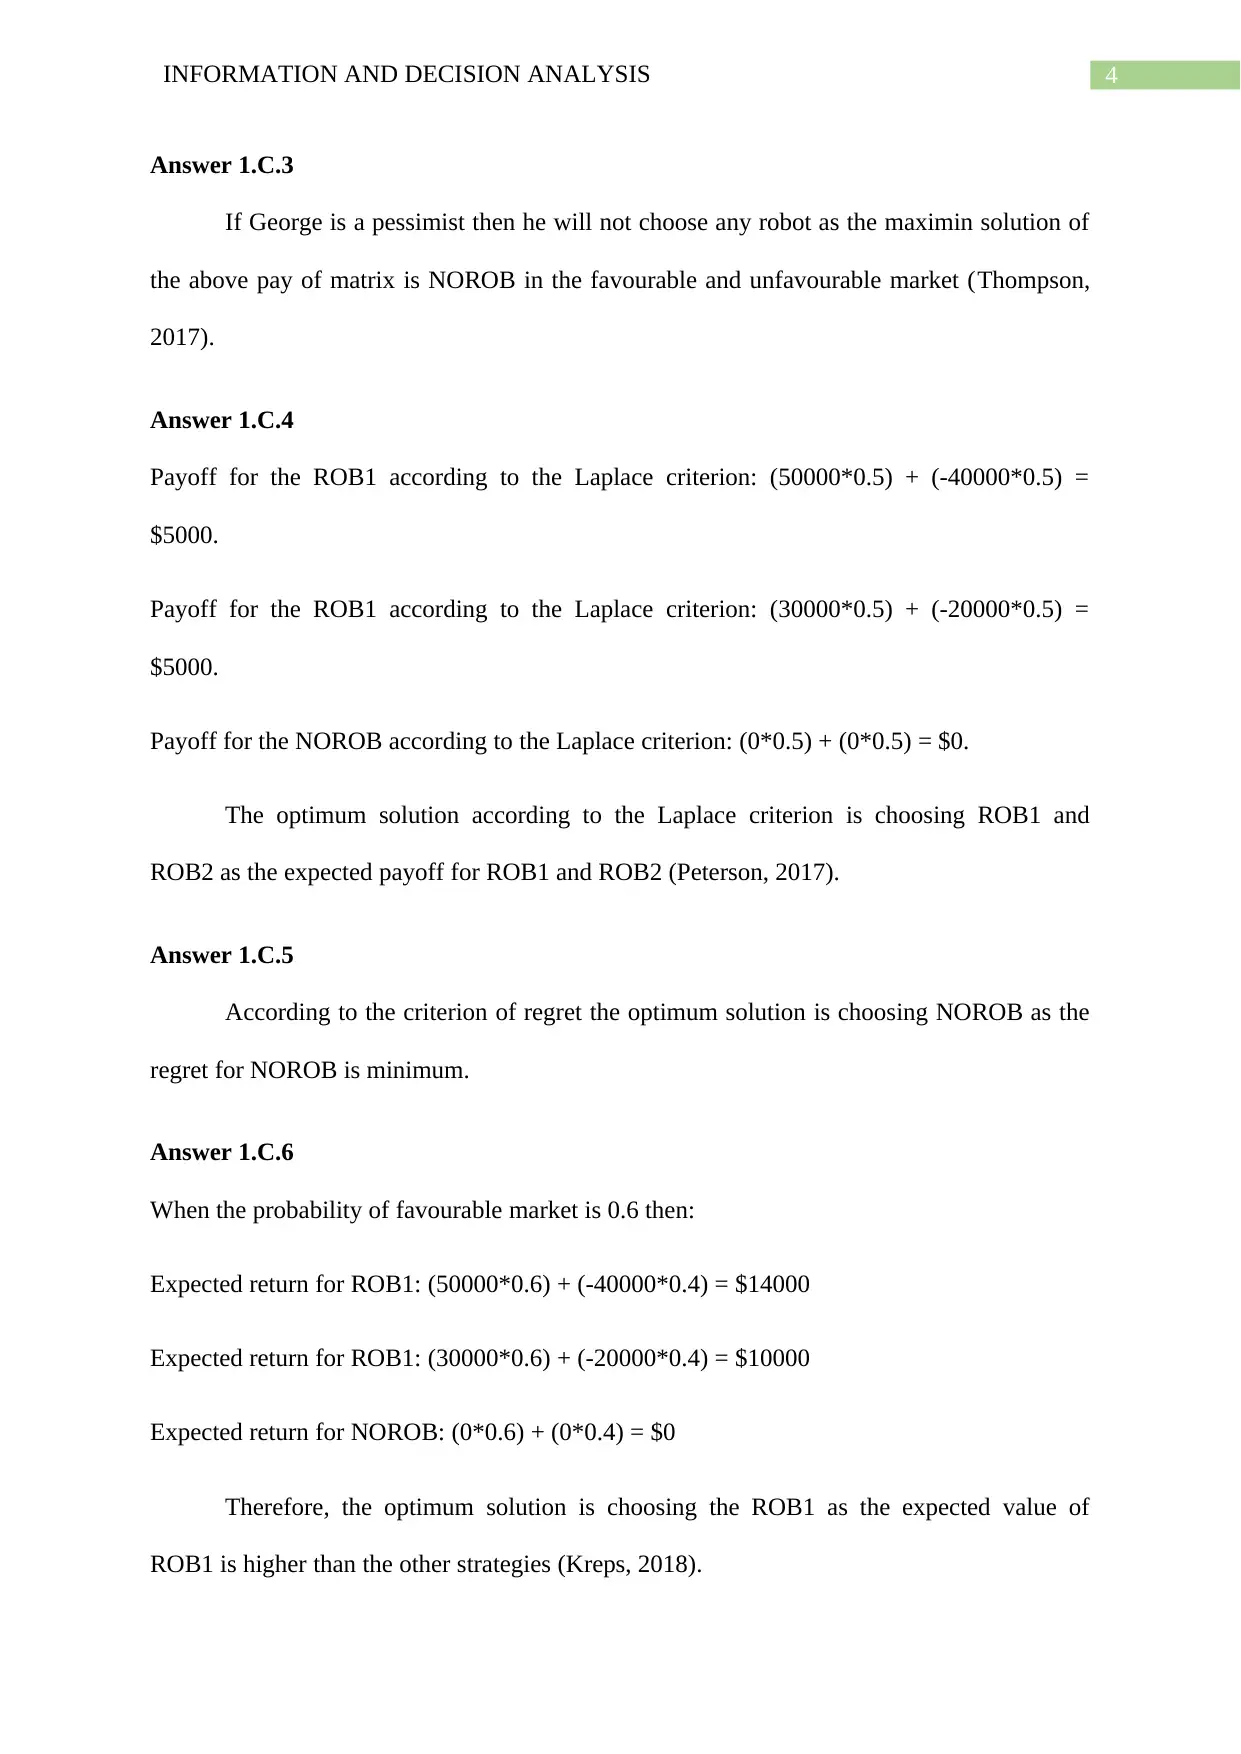
Answer 1.C.7
Favourable Unfavourable Expected Return
ROB1 50000 -40000 14000
ROB2 30000 -20000 10000
NOROB 0 0 00
Probability 0.6 0.4 1
Best Decision 50000 0 50000
The expected value under perfect condition: (50000 – 14000) = $ 36000
Answer 2.a
+ signal
Favourable
-Signal
Favourable
+ signal
Unfavourable
-Signal
Unfavourable
Cost of
Survey
Expected
Return
ROB1 50000*0.9 50000*0.1 -40000*0.8 -40000*0.2 5000 5000
ROB2 30000*0.9 30000*0.1 -20000*0.8 -20000*0.2 5000 5000
NOROB 0*0.9 0*0.1 0*0.8 0*0.2 5000 -5000
Probability 0.9 0.1 0.8 0.2 1.7
Answer 2.b
Posterior probability of favourable market after a positive result of survey is (0.9*0.6)
/ (0.9*0.6) +(0.8*0.4)= 0.54/0.86 = 0.63
Answer 2.c
EVSI = 50000-14000 = $36000
ENGSI = (50000*0.63)+(-40000*0.37) = $16700
Answer 2.d
The maximum survey cost could be (50000-40000) = $10000.
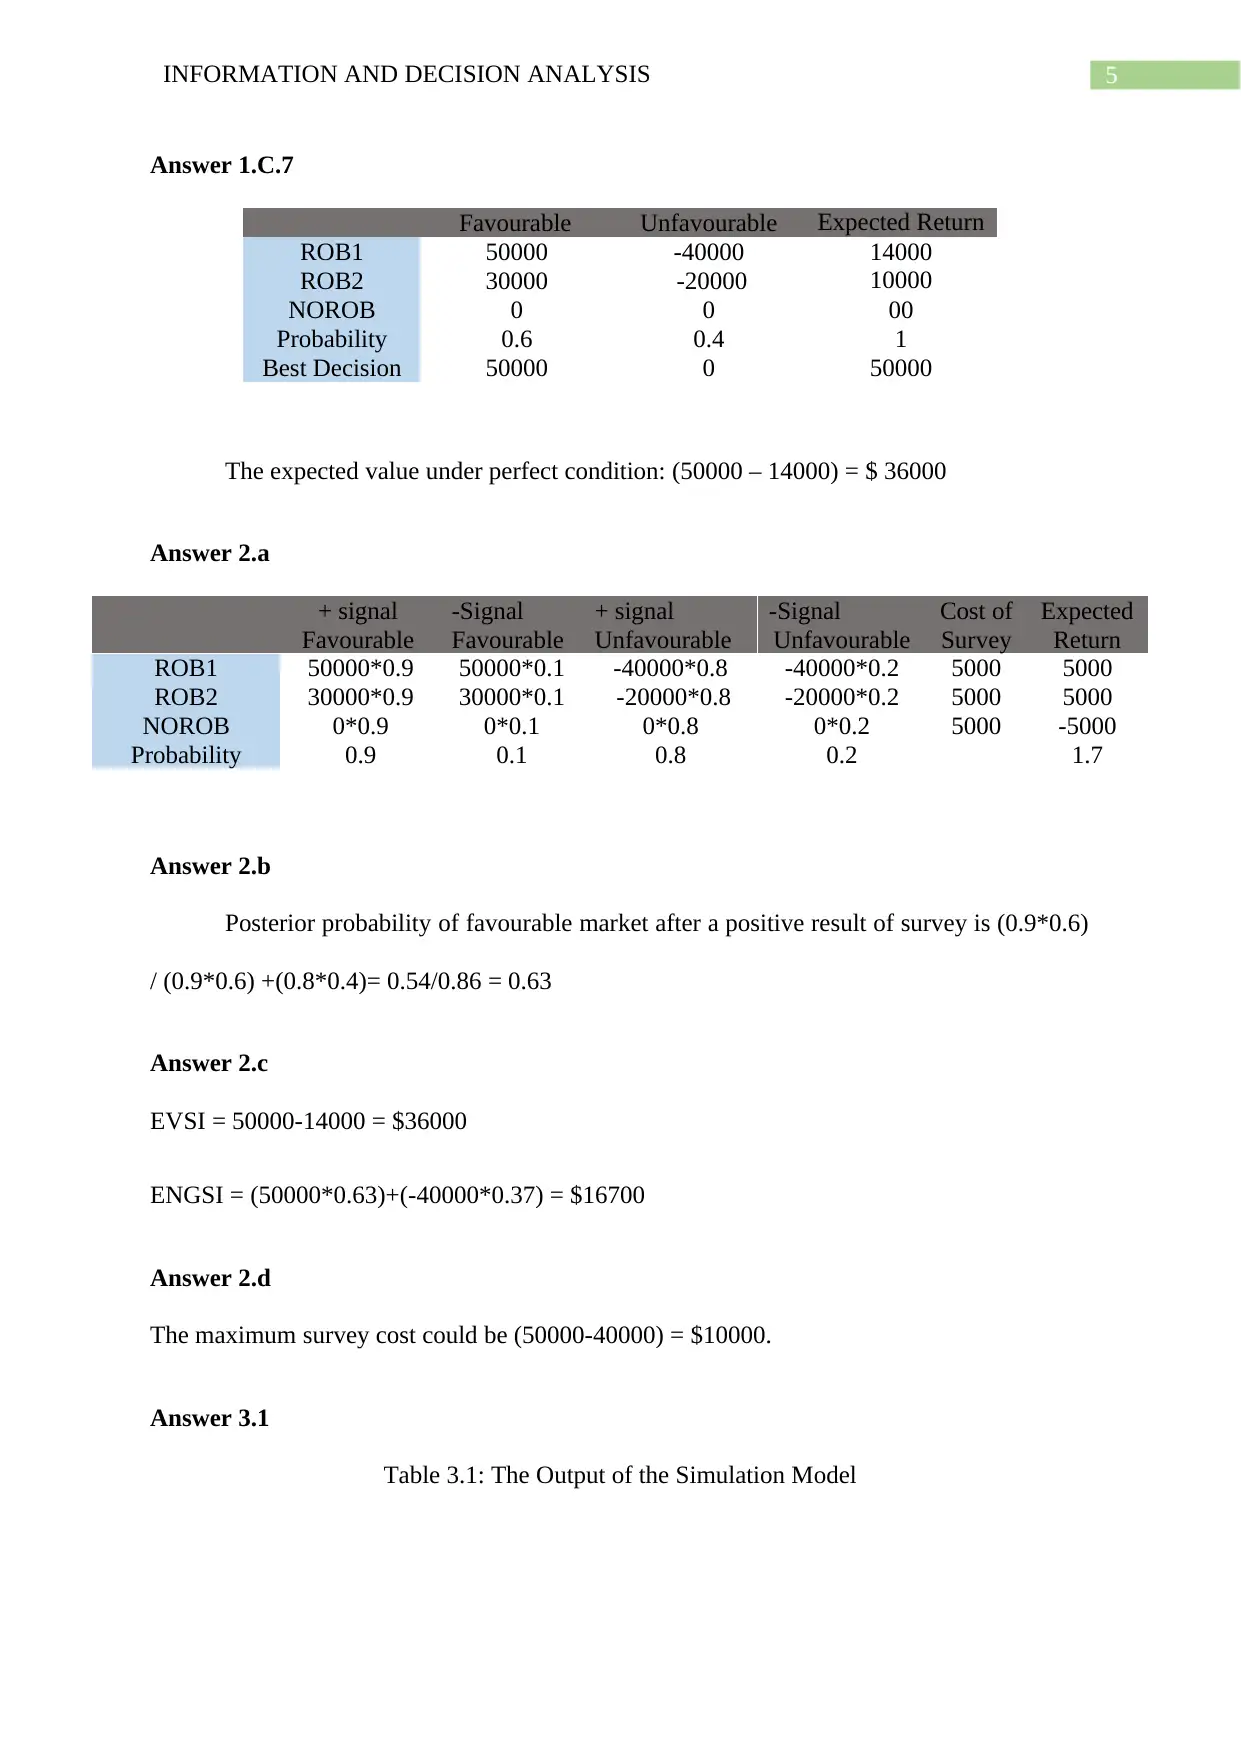
Answer 3.1
Table 3.1: The Output of the Simulation Model
Answer 1.C.7
Favourable Unfavourable Expected Return
ROB1 50000 -40000 14000
ROB2 30000 -20000 10000
NOROB 0 0 00
Probability 0.6 0.4 1
Best Decision 50000 0 50000
The expected value under perfect condition: (50000 – 14000) = $ 36000
Answer 2.a
+ signal
Favourable
-Signal
Favourable
+ signal
Unfavourable
-Signal
Unfavourable
Cost of
Survey
Expected
Return
ROB1 50000*0.9 50000*0.1 -40000*0.8 -40000*0.2 5000 5000
ROB2 30000*0.9 30000*0.1 -20000*0.8 -20000*0.2 5000 5000
NOROB 0*0.9 0*0.1 0*0.8 0*0.2 5000 -5000
Probability 0.9 0.1 0.8 0.2 1.7
Answer 2.b
Posterior probability of favourable market after a positive result of survey is (0.9*0.6)
/ (0.9*0.6) +(0.8*0.4)= 0.54/0.86 = 0.63
Answer 2.c
EVSI = 50000-14000 = $36000
ENGSI = (50000*0.63)+(-40000*0.37) = $16700
Answer 2.d
The maximum survey cost could be (50000-40000) = $10000.
Answer 3.1
Table 3.1: The Output of the Simulation Model
⊘ This is a preview!⊘
Do you want full access?
Subscribe today to unlock all pages.
Trusted by 1+ million students worldwide
6INFORMATION AND DECISION ANALYSIS
Probability Cumulative
Probablity
Demand Probability Cumulative
Probablity
No Shows
Available Seats 6
0.05 0.00 5 0.15 0.00 0 Reservation Cost 79.00$
0.11 0.05 6 0.25 0.15 1 Compensation 50.00$
0.20 0.16 7 0.26 0.40 2 FC Flight 350.00$
0.18 0.36 8 0.23 0.66 3
0.16 0.54 9 0.11 0.89 4
0.12 0.70 10
0.10 0.82 11
0.08 0.92 12
Daily Demand No Shows
ABC Airlines
Day RN Dem Demand RN No Shows Number No
Shows
Number
Overbooked
Fare Rev Compensation FC Profit per
Flight
1 0.5230 8 0.0145 0 2 632.00$ 258.00$ 350.00$ 24.00$
2 0.3550 7 0.4597 2 1 553.00$ 129.00$ 350.00$ 74.00$
3 0.1197 6 0.4251 2 0 474.00$ -$ 350.00$ 124.00$
4 0.5940 9 0.6202 2 3 711.00$ 387.00$ 350.00$ 26.00-$
5 0.0122 5 0.0979 0 0 395.00$ -$ 350.00$ 45.00$
6 0.0943 6 0.0269 0 0 474.00$ -$ 350.00$ 124.00$
7 0.4764 8 0.7337 3 2 632.00$ 258.00$ 350.00$ 24.00$
8 0.1494 6 0.3758 1 0 474.00$ -$ 350.00$ 124.00$
9 0.1804 7 0.0398 0 1 553.00$ 129.00$ 350.00$ 74.00$
10 0.5456 9 0.9918 4 3 711.00$ 387.00$ 350.00$ 26.00-$
11 0.9001 11 0.3028 1 5 869.00$ 645.00$ 350.00$ 126.00-$
12 0.7765 10 0.3243 1 4 790.00$ 516.00$ 350.00$ 76.00-$
13 0.8489 11 0.3915 1 5 869.00$ 645.00$ 350.00$ 126.00-$
14 0.9252 12 0.9234 4 6 948.00$ 774.00$ 350.00$ 176.00-$
15 0.9377 12 0.2514 1 6 948.00$ 774.00$ 350.00$ 176.00-$
16 0.6132 9 0.8091 3 3 711.00$ 387.00$ 350.00$ 26.00-$
17 0.2686 7 0.4855 2 1 553.00$ 129.00$ 350.00$ 74.00$
18 0.6227 9 0.3990 1 3 711.00$ 387.00$ 350.00$ 26.00-$
19 0.2212 7 0.7091 3 1 553.00$ 129.00$ 350.00$ 74.00$
20 0.6004 9 0.7156 3 3 711.00$ 387.00$ 350.00$ 26.00-$
21 0.7526 10 0.6884 3 4 790.00$ 516.00$ 350.00$ 76.00-$
22 0.6119 9 0.4549 2 3 711.00$ 387.00$ 350.00$ 26.00-$
23 0.3139 7 0.7698 3 1 553.00$ 129.00$ 350.00$ 74.00$
24 0.9223 12 0.7059 3 6 948.00$ 774.00$ 350.00$ 176.00-$
25 0.8984 11 0.1579 1 5 869.00$ 645.00$ 350.00$ 126.00-$
26 0.9771 12 0.3796 1 6 948.00$ 774.00$ 350.00$ 176.00-$
27 0.0910 6 0.9848 4 0 474.00$ -$ 350.00$ 124.00$
28 0.4383 8 0.0042 0 2 632.00$ 258.00$ 350.00$ 24.00$
29 0.3859 8 0.2389 1 2 632.00$ 258.00$ 350.00$ 24.00$
30 0.5100 8 0.6886 3 2 632.00$ 258.00$ 350.00$ 24.00$
Table 3.1: The Output formula of the Simulation Model
Probability Cumulative Probablity Demand Probability Cumulative
Probablity
No Shows
Available Seats 6
0.05 0 5 0.15 0 0 Reservation Cost 79
0.11 =A4 6 0.25 =E4 1 Compensation 50
0.2 =B5+A5 7 0.26 =F5+E5 2 FC Flight 350
0.18 =B6+A6 8 0.23 =F6+E6 3
0.16 =B7+A7 9 0.11 =F7+E7 4
0.12 =B8+A8 10
0.1 =B9+A9 11
0.08 =B10+A10 12
Daily Demand No Shows
ABC Airlines
Paraphrase This Document
Need a fresh take? Get an instant paraphrase of this document with our AI Paraphraser
7INFORMATION AND DECISION ANALYSIS
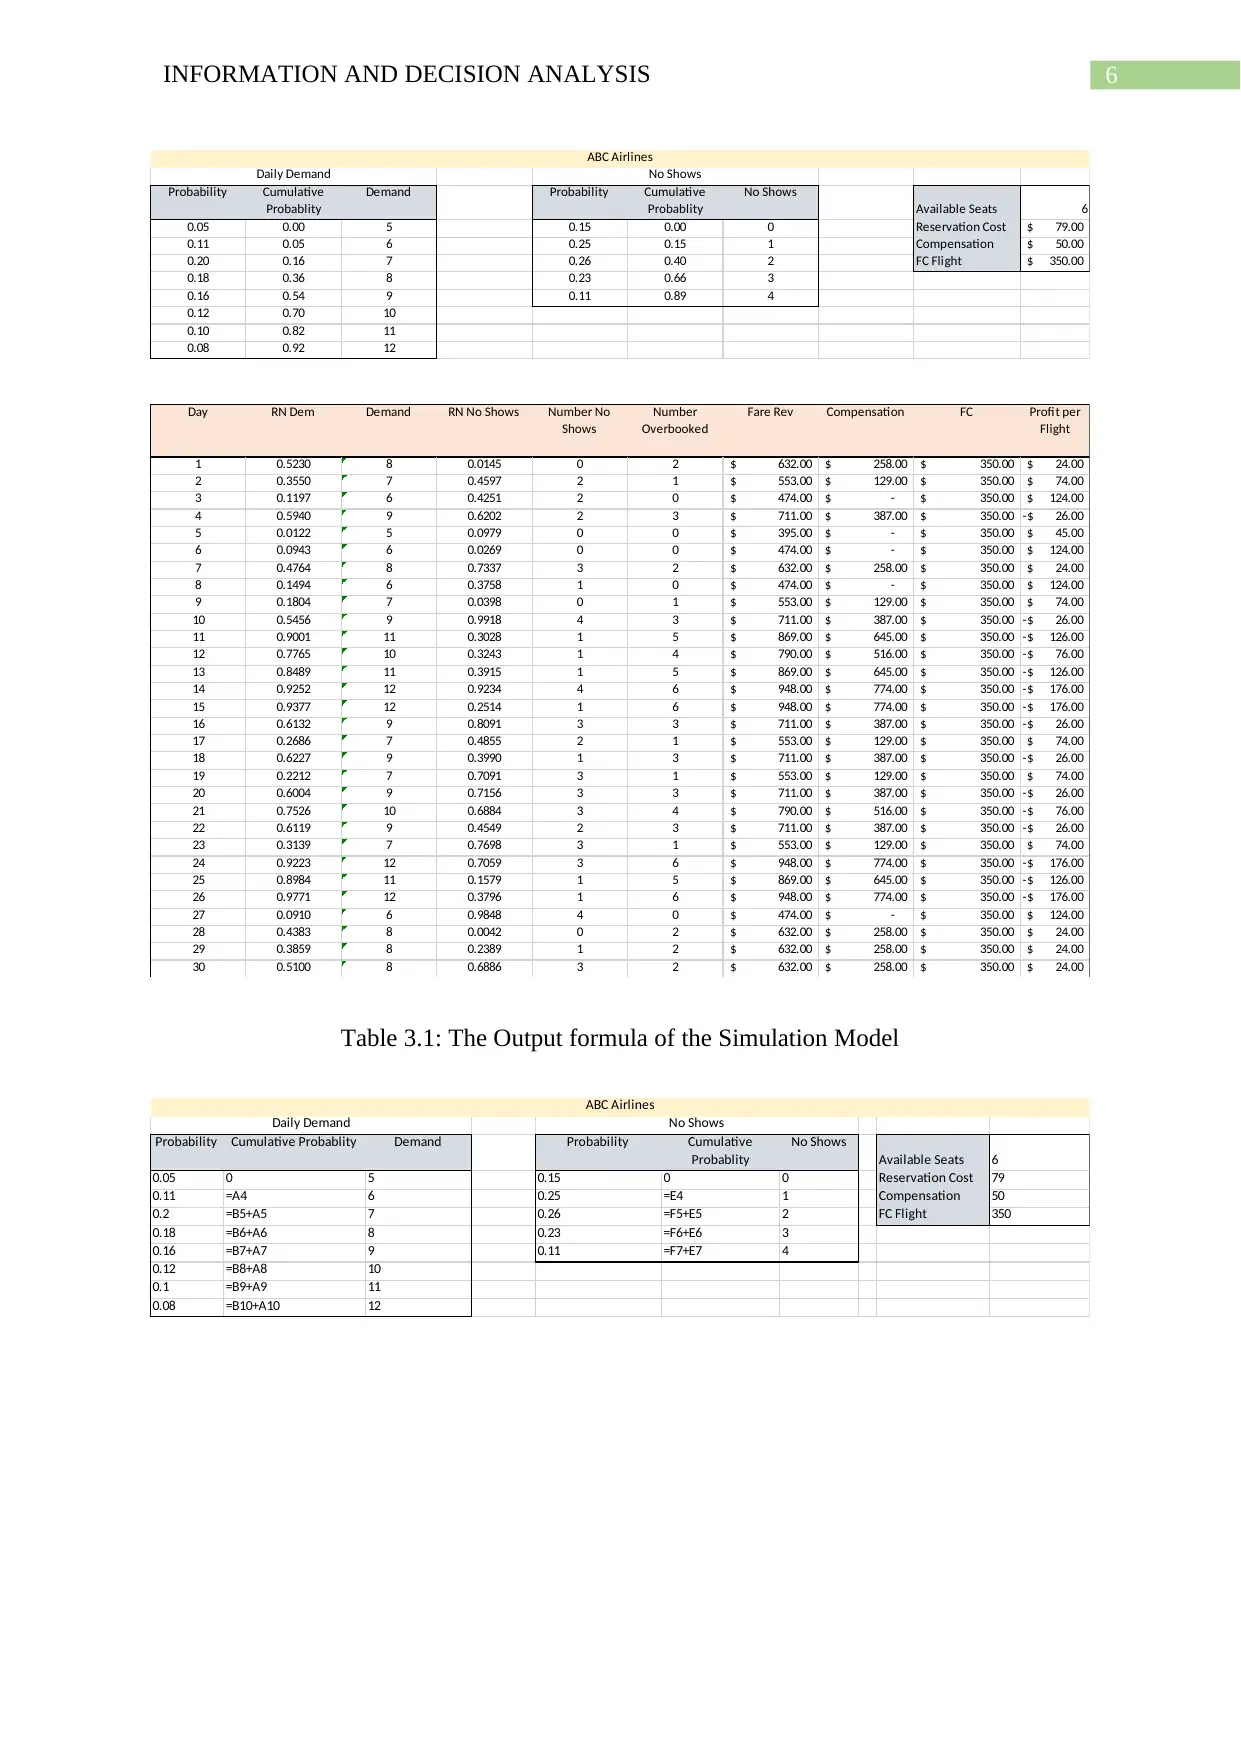
Day RN Dem Demand RN No Shows Number No Shows Number Overbooked Fare Rev Compensation FC Profit per Flight
1 =RAND() =IF(B15<0.05,5,VLOOKUP(B15,$B$4:$C$11,2,TRUE)) =RAND() =IF(D15<0.15,0,VLOOKUP(D15,$F$4:$G$8,2,TRUE)) =IF(C15<=$J$3,0,C15-$J$3) =C15*$J$4 =IF(C15<=6,0,F15*($J$4+$J$5)) =$J$6 =G15-H15-I15
2 =RAND() =IF(B16<0.05,5,VLOOKUP(B16,$B$4:$C$11,2,TRUE)) =RAND() =IF(D16<0.15,0,VLOOKUP(D16,$F$4:$G$8,2,TRUE)) =IF(C16<=$J$3,0,C16-$J$3) =C16*$J$4 =IF(C16<=6,0,F16*($J$4+$J$5)) =$J$6 =G16-H16-I16
3 =RAND() =IF(B17<0.05,5,VLOOKUP(B17,$B$4:$C$11,2,TRUE)) =RAND() =IF(D17<0.15,0,VLOOKUP(D17,$F$4:$G$8,2,TRUE)) =IF(C17<=$J$3,0,C17-$J$3) =C17*$J$4 =IF(C17<=6,0,F17*($J$4+$J$5)) =$J$6 =G17-H17-I17
4 =RAND() =IF(B18<0.05,5,VLOOKUP(B18,$B$4:$C$11,2,TRUE)) =RAND() =IF(D18<0.15,0,VLOOKUP(D18,$F$4:$G$8,2,TRUE)) =IF(C18<=$J$3,0,C18-$J$3) =C18*$J$4 =IF(C18<=6,0,F18*($J$4+$J$5)) =$J$6 =G18-H18-I18
5 =RAND() =IF(B19<0.05,5,VLOOKUP(B19,$B$4:$C$11,2,TRUE)) =RAND() =IF(D19<0.15,0,VLOOKUP(D19,$F$4:$G$8,2,TRUE)) =IF(C19<=$J$3,0,C19-$J$3) =C19*$J$4 =IF(C19<=6,0,F19*($J$4+$J$5)) =$J$6 =G19-H19-I19
6 =RAND() =IF(B20<0.05,5,VLOOKUP(B20,$B$4:$C$11,2,TRUE)) =RAND() =IF(D20<0.15,0,VLOOKUP(D20,$F$4:$G$8,2,TRUE)) =IF(C20<=$J$3,0,C20-$J$3) =C20*$J$4 =IF(C20<=6,0,F20*($J$4+$J$5)) =$J$6 =G20-H20-I20
7 =RAND() =IF(B21<0.05,5,VLOOKUP(B21,$B$4:$C$11,2,TRUE)) =RAND() =IF(D21<0.15,0,VLOOKUP(D21,$F$4:$G$8,2,TRUE)) =IF(C21<=$J$3,0,C21-$J$3) =C21*$J$4 =IF(C21<=6,0,F21*($J$4+$J$5)) =$J$6 =G21-H21-I21
8 =RAND() =IF(B22<0.05,5,VLOOKUP(B22,$B$4:$C$11,2,TRUE)) =RAND() =IF(D22<0.15,0,VLOOKUP(D22,$F$4:$G$8,2,TRUE)) =IF(C22<=$J$3,0,C22-$J$3) =C22*$J$4 =IF(C22<=6,0,F22*($J$4+$J$5)) =$J$6 =G22-H22-I22
9 =RAND() =IF(B23<0.05,5,VLOOKUP(B23,$B$4:$C$11,2,TRUE)) =RAND() =IF(D23<0.15,0,VLOOKUP(D23,$F$4:$G$8,2,TRUE)) =IF(C23<=$J$3,0,C23-$J$3) =C23*$J$4 =IF(C23<=6,0,F23*($J$4+$J$5)) =$J$6 =G23-H23-I23
10 =RAND() =IF(B24<0.05,5,VLOOKUP(B24,$B$4:$C$11,2,TRUE)) =RAND() =IF(D24<0.15,0,VLOOKUP(D24,$F$4:$G$8,2,TRUE)) =IF(C24<=$J$3,0,C24-$J$3) =C24*$J$4 =IF(C24<=6,0,F24*($J$4+$J$5)) =$J$6 =G24-H24-I24
11 =RAND() =IF(B25<0.05,5,VLOOKUP(B25,$B$4:$C$11,2,TRUE)) =RAND() =IF(D25<0.15,0,VLOOKUP(D25,$F$4:$G$8,2,TRUE)) =IF(C25<=$J$3,0,C25-$J$3) =C25*$J$4 =IF(C25<=6,0,F25*($J$4+$J$5)) =$J$6 =G25-H25-I25
12 =RAND() =IF(B26<0.05,5,VLOOKUP(B26,$B$4:$C$11,2,TRUE)) =RAND() =IF(D26<0.15,0,VLOOKUP(D26,$F$4:$G$8,2,TRUE)) =IF(C26<=$J$3,0,C26-$J$3) =C26*$J$4 =IF(C26<=6,0,F26*($J$4+$J$5)) =$J$6 =G26-H26-I26
13 =RAND() =IF(B27<0.05,5,VLOOKUP(B27,$B$4:$C$11,2,TRUE)) =RAND() =IF(D27<0.15,0,VLOOKUP(D27,$F$4:$G$8,2,TRUE)) =IF(C27<=$J$3,0,C27-$J$3) =C27*$J$4 =IF(C27<=6,0,F27*($J$4+$J$5)) =$J$6 =G27-H27-I27
14 =RAND() =IF(B28<0.05,5,VLOOKUP(B28,$B$4:$C$11,2,TRUE)) =RAND() =IF(D28<0.15,0,VLOOKUP(D28,$F$4:$G$8,2,TRUE)) =IF(C28<=$J$3,0,C28-$J$3) =C28*$J$4 =IF(C28<=6,0,F28*($J$4+$J$5)) =$J$6 =G28-H28-I28
15 =RAND() =IF(B29<0.05,5,VLOOKUP(B29,$B$4:$C$11,2,TRUE)) =RAND() =IF(D29<0.15,0,VLOOKUP(D29,$F$4:$G$8,2,TRUE)) =IF(C29<=$J$3,0,C29-$J$3) =C29*$J$4 =IF(C29<=6,0,F29*($J$4+$J$5)) =$J$6 =G29-H29-I29
16 =RAND() =IF(B30<0.05,5,VLOOKUP(B30,$B$4:$C$11,2,TRUE)) =RAND() =IF(D30<0.15,0,VLOOKUP(D30,$F$4:$G$8,2,TRUE)) =IF(C30<=$J$3,0,C30-$J$3) =C30*$J$4 =IF(C30<=6,0,F30*($J$4+$J$5)) =$J$6 =G30-H30-I30
17 =RAND() =IF(B31<0.05,5,VLOOKUP(B31,$B$4:$C$11,2,TRUE)) =RAND() =IF(D31<0.15,0,VLOOKUP(D31,$F$4:$G$8,2,TRUE)) =IF(C31<=$J$3,0,C31-$J$3) =C31*$J$4 =IF(C31<=6,0,F31*($J$4+$J$5)) =$J$6 =G31-H31-I31
18 =RAND() =IF(B32<0.05,5,VLOOKUP(B32,$B$4:$C$11,2,TRUE)) =RAND() =IF(D32<0.15,0,VLOOKUP(D32,$F$4:$G$8,2,TRUE)) =IF(C32<=$J$3,0,C32-$J$3) =C32*$J$4 =IF(C32<=6,0,F32*($J$4+$J$5)) =$J$6 =G32-H32-I32
19 =RAND() =IF(B33<0.05,5,VLOOKUP(B33,$B$4:$C$11,2,TRUE)) =RAND() =IF(D33<0.15,0,VLOOKUP(D33,$F$4:$G$8,2,TRUE)) =IF(C33<=$J$3,0,C33-$J$3) =C33*$J$4 =IF(C33<=6,0,F33*($J$4+$J$5)) =$J$6 =G33-H33-I33
20 =RAND() =IF(B34<0.05,5,VLOOKUP(B34,$B$4:$C$11,2,TRUE)) =RAND() =IF(D34<0.15,0,VLOOKUP(D34,$F$4:$G$8,2,TRUE)) =IF(C34<=$J$3,0,C34-$J$3) =C34*$J$4 =IF(C34<=6,0,F34*($J$4+$J$5)) =$J$6 =G34-H34-I34
21 =RAND() =IF(B35<0.05,5,VLOOKUP(B35,$B$4:$C$11,2,TRUE)) =RAND() =IF(D35<0.15,0,VLOOKUP(D35,$F$4:$G$8,2,TRUE)) =IF(C35<=$J$3,0,C35-$J$3) =C35*$J$4 =IF(C35<=6,0,F35*($J$4+$J$5)) =$J$6 =G35-H35-I35
22 =RAND() =IF(B36<0.05,5,VLOOKUP(B36,$B$4:$C$11,2,TRUE)) =RAND() =IF(D36<0.15,0,VLOOKUP(D36,$F$4:$G$8,2,TRUE)) =IF(C36<=$J$3,0,C36-$J$3) =C36*$J$4 =IF(C36<=6,0,F36*($J$4+$J$5)) =$J$6 =G36-H36-I36
23 =RAND() =IF(B37<0.05,5,VLOOKUP(B37,$B$4:$C$11,2,TRUE)) =RAND() =IF(D37<0.15,0,VLOOKUP(D37,$F$4:$G$8,2,TRUE)) =IF(C37<=$J$3,0,C37-$J$3) =C37*$J$4 =IF(C37<=6,0,F37*($J$4+$J$5)) =$J$6 =G37-H37-I37
24 =RAND() =IF(B38<0.05,5,VLOOKUP(B38,$B$4:$C$11,2,TRUE)) =RAND() =IF(D38<0.15,0,VLOOKUP(D38,$F$4:$G$8,2,TRUE)) =IF(C38<=$J$3,0,C38-$J$3) =C38*$J$4 =IF(C38<=6,0,F38*($J$4+$J$5)) =$J$6 =G38-H38-I38
25 =RAND() =IF(B39<0.05,5,VLOOKUP(B39,$B$4:$C$11,2,TRUE)) =RAND() =IF(D39<0.15,0,VLOOKUP(D39,$F$4:$G$8,2,TRUE)) =IF(C39<=$J$3,0,C39-$J$3) =C39*$J$4 =IF(C39<=6,0,F39*($J$4+$J$5)) =$J$6 =G39-H39-I39
26 =RAND() =IF(B40<0.05,5,VLOOKUP(B40,$B$4:$C$11,2,TRUE)) =RAND() =IF(D40<0.15,0,VLOOKUP(D40,$F$4:$G$8,2,TRUE)) =IF(C40<=$J$3,0,C40-$J$3) =C40*$J$4 =IF(C40<=6,0,F40*($J$4+$J$5)) =$J$6 =G40-H40-I40
27 =RAND() =IF(B41<0.05,5,VLOOKUP(B41,$B$4:$C$11,2,TRUE)) =RAND() =IF(D41<0.15,0,VLOOKUP(D41,$F$4:$G$8,2,TRUE)) =IF(C41<=$J$3,0,C41-$J$3) =C41*$J$4 =IF(C41<=6,0,F41*($J$4+$J$5)) =$J$6 =G41-H41-I41
28 =RAND() =IF(B42<0.05,5,VLOOKUP(B42,$B$4:$C$11,2,TRUE)) =RAND() =IF(D42<0.15,0,VLOOKUP(D42,$F$4:$G$8,2,TRUE)) =IF(C42<=$J$3,0,C42-$J$3) =C42*$J$4 =IF(C42<=6,0,F42*($J$4+$J$5)) =$J$6 =G42-H42-I42
29 =RAND() =IF(B43<0.05,5,VLOOKUP(B43,$B$4:$C$11,2,TRUE)) =RAND() =IF(D43<0.15,0,VLOOKUP(D43,$F$4:$G$8,2,TRUE)) =IF(C43<=$J$3,0,C43-$J$3) =C43*$J$4 =IF(C43<=6,0,F43*($J$4+$J$5)) =$J$6 =G43-H43-I43
30 =RAND() =IF(B44<0.05,5,VLOOKUP(B44,$B$4:$C$11,2,TRUE)) =RAND() =IF(D44<0.15,0,VLOOKUP(D44,$F$4:$G$8,2,TRUE)) =IF(C44<=$J$3,0,C44-$J$3) =C44*$J$4 =IF(C44<=6,0,F44*($J$4+$J$5)) =$J$6 =G44-H44-I44
Answer 3.2
The profitability of the ABC is negative when the number of overbooking is greater or
equal to 3.
Answer 3.3
The ABC airlines profitability mainly comes from the exact fare of the seats and the
reservation of the overbooking of the seats. However, it is seen that when the overbooking
exceeds the number of seats that is 3 or equals to 3, it faces a negative profit that is loss. The
loss comes from the high reservation and compensation fare. Hence, the ABC airline
company should focus on the overbooking and should set a barrier on the over booking.
Moreover, the airline company should check the compensation policy to reduce the uncertain
losses. Except this the demand and the supply of the service seems to be well-meet at
equilibrium if the policies are checked and introduced in order to reduce the losses.
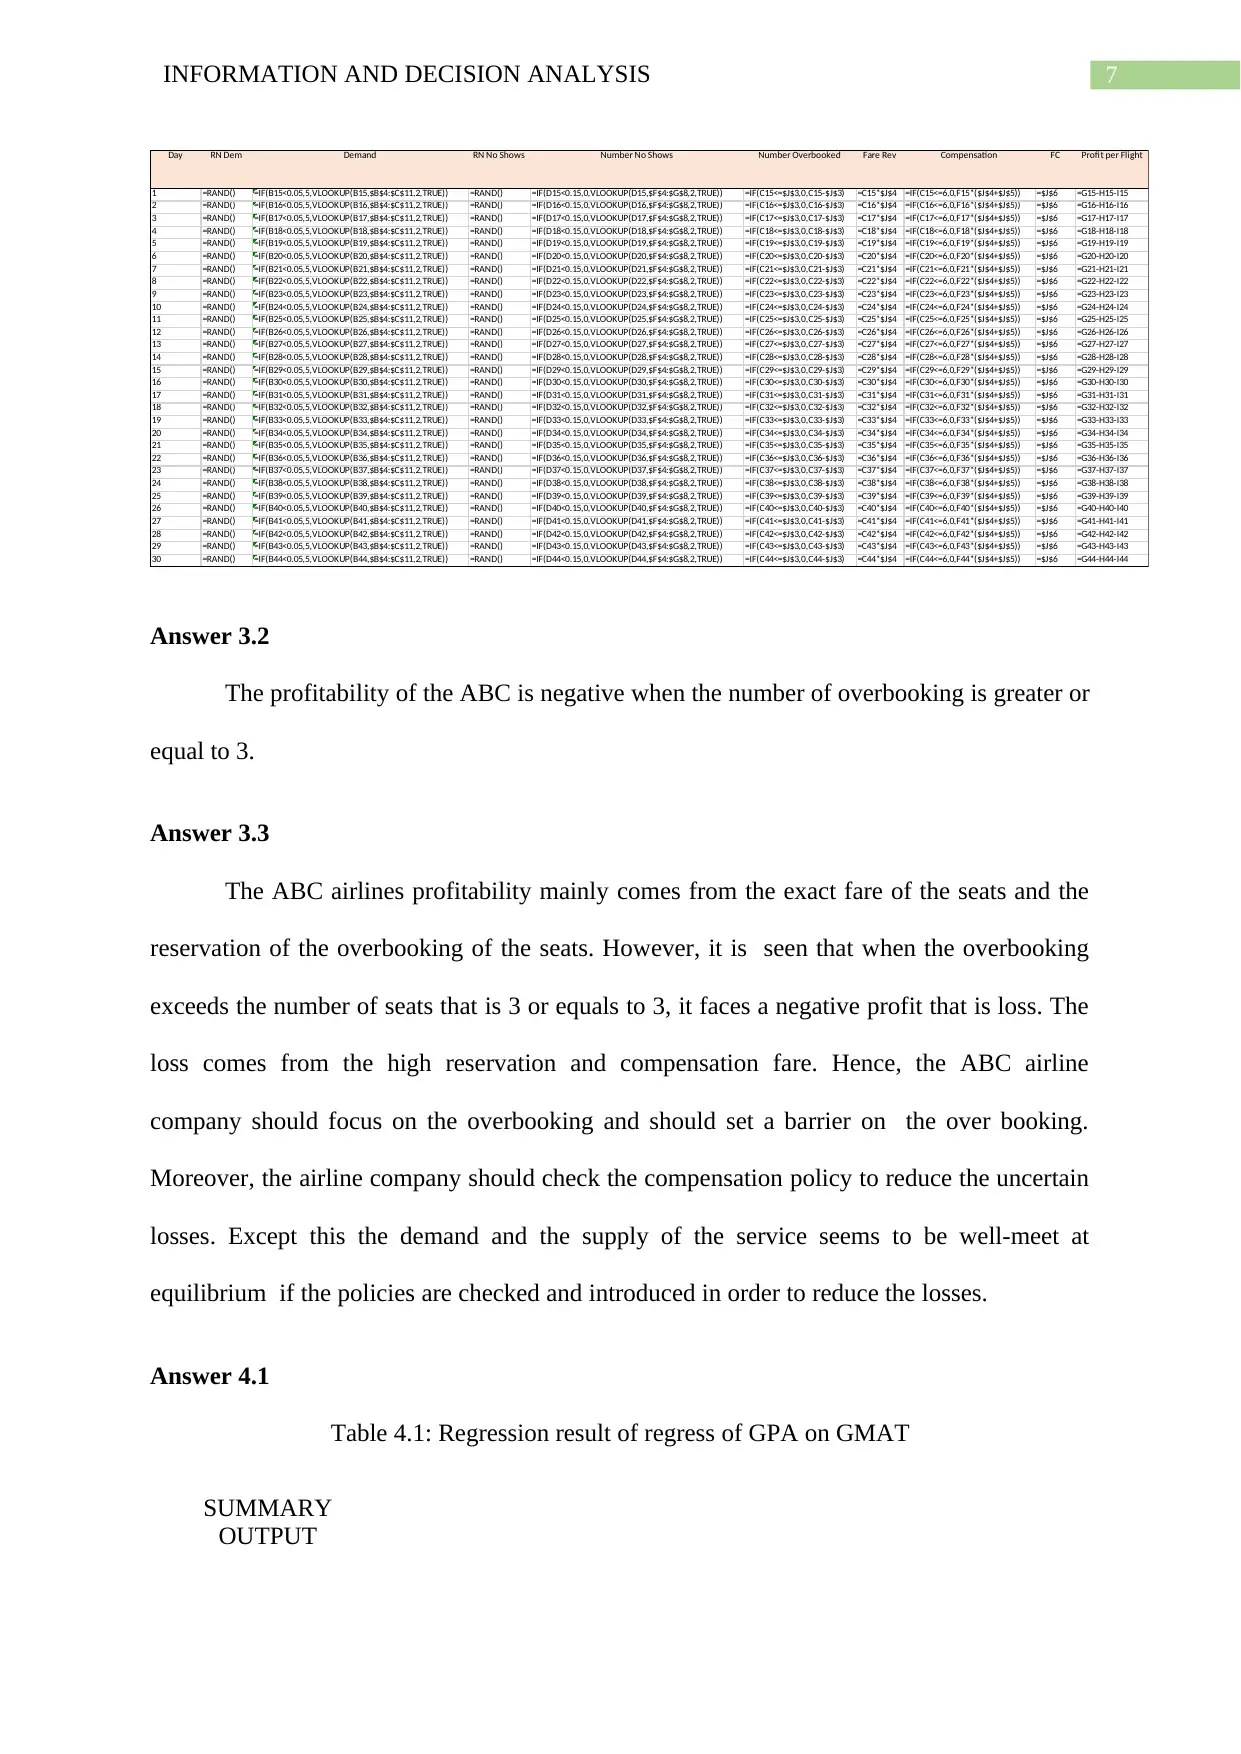
Answer 4.1
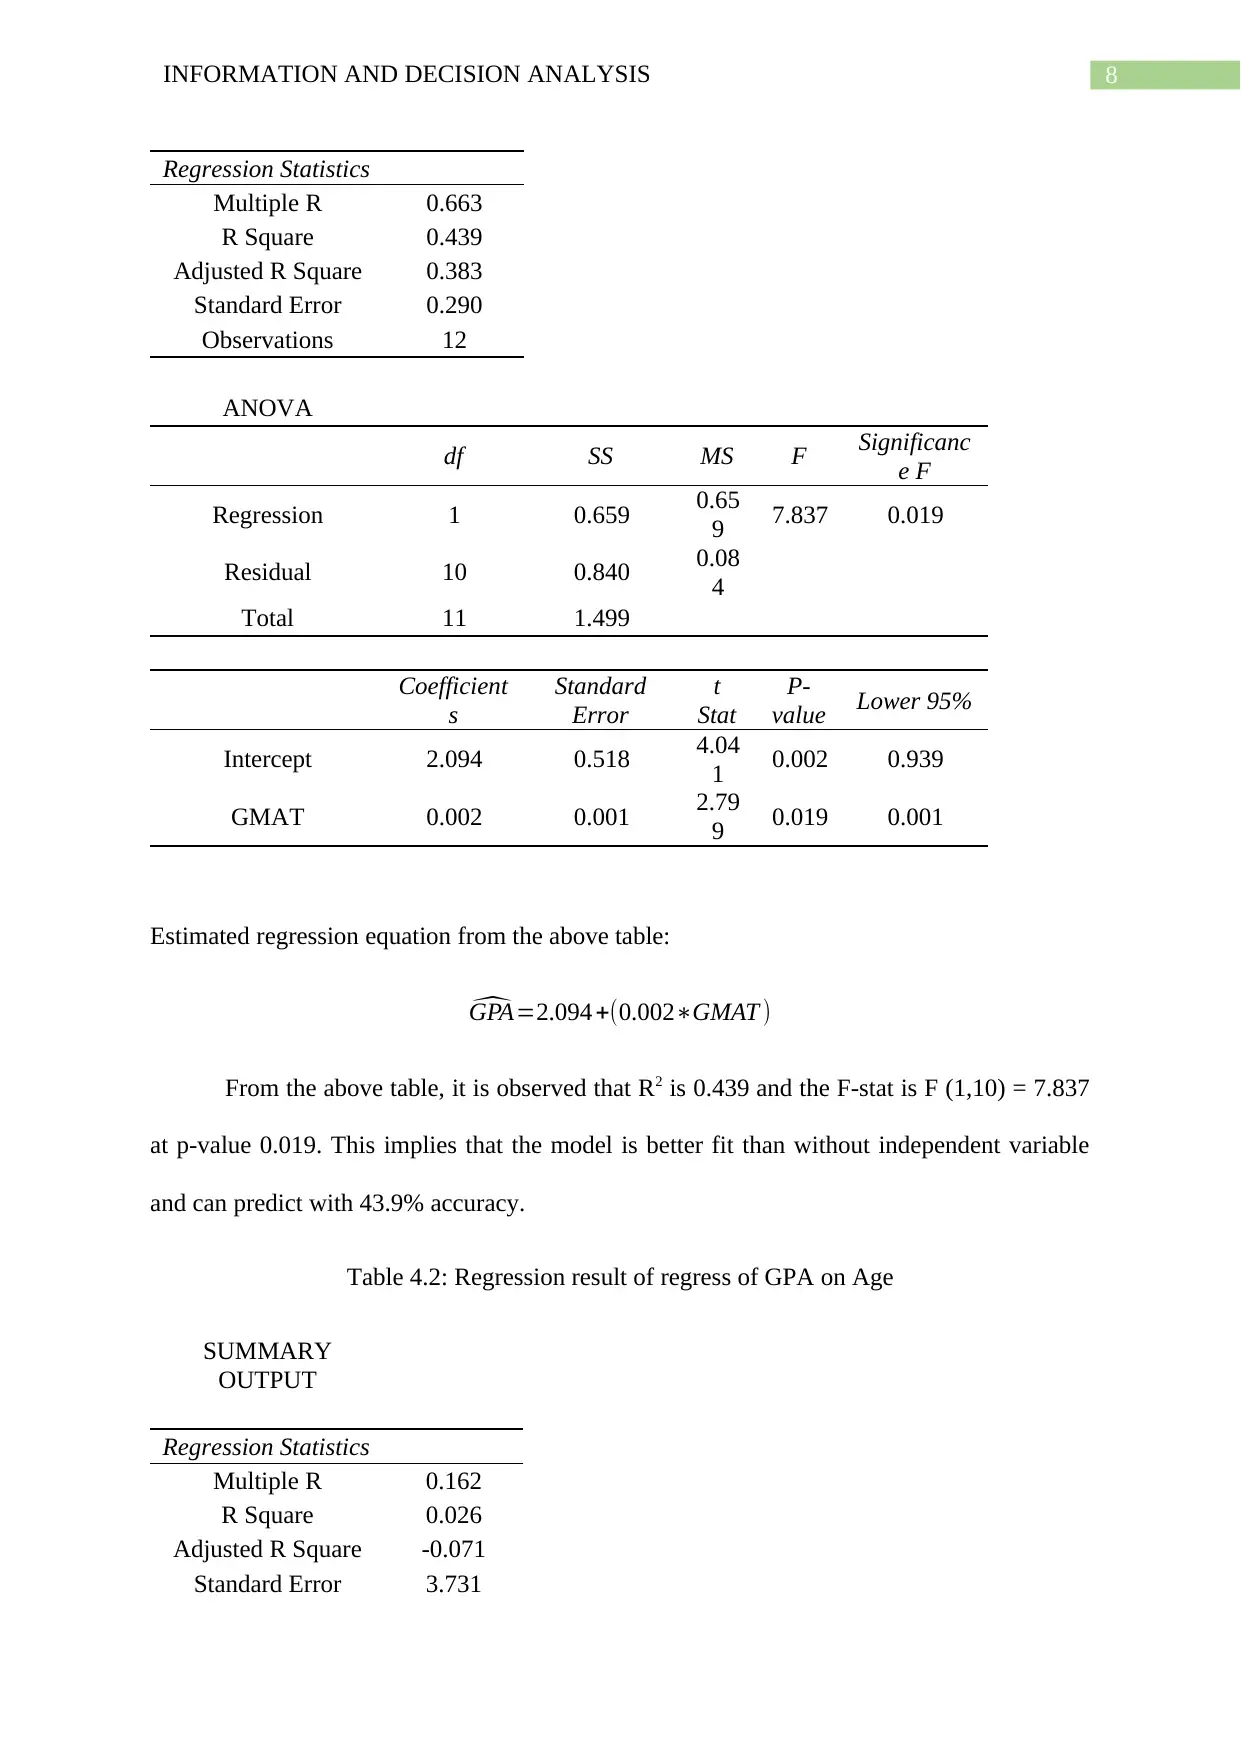
Table 4.1: Regression result of regress of GPA on GMAT
SUMMARY
OUTPUT
Day RN Dem Demand RN No Shows Number No Shows Number Overbooked Fare Rev Compensation FC Profit per Flight
1 =RAND() =IF(B15<0.05,5,VLOOKUP(B15,$B$4:$C$11,2,TRUE)) =RAND() =IF(D15<0.15,0,VLOOKUP(D15,$F$4:$G$8,2,TRUE)) =IF(C15<=$J$3,0,C15-$J$3) =C15*$J$4 =IF(C15<=6,0,F15*($J$4+$J$5)) =$J$6 =G15-H15-I15
2 =RAND() =IF(B16<0.05,5,VLOOKUP(B16,$B$4:$C$11,2,TRUE)) =RAND() =IF(D16<0.15,0,VLOOKUP(D16,$F$4:$G$8,2,TRUE)) =IF(C16<=$J$3,0,C16-$J$3) =C16*$J$4 =IF(C16<=6,0,F16*($J$4+$J$5)) =$J$6 =G16-H16-I16
3 =RAND() =IF(B17<0.05,5,VLOOKUP(B17,$B$4:$C$11,2,TRUE)) =RAND() =IF(D17<0.15,0,VLOOKUP(D17,$F$4:$G$8,2,TRUE)) =IF(C17<=$J$3,0,C17-$J$3) =C17*$J$4 =IF(C17<=6,0,F17*($J$4+$J$5)) =$J$6 =G17-H17-I17
4 =RAND() =IF(B18<0.05,5,VLOOKUP(B18,$B$4:$C$11,2,TRUE)) =RAND() =IF(D18<0.15,0,VLOOKUP(D18,$F$4:$G$8,2,TRUE)) =IF(C18<=$J$3,0,C18-$J$3) =C18*$J$4 =IF(C18<=6,0,F18*($J$4+$J$5)) =$J$6 =G18-H18-I18
5 =RAND() =IF(B19<0.05,5,VLOOKUP(B19,$B$4:$C$11,2,TRUE)) =RAND() =IF(D19<0.15,0,VLOOKUP(D19,$F$4:$G$8,2,TRUE)) =IF(C19<=$J$3,0,C19-$J$3) =C19*$J$4 =IF(C19<=6,0,F19*($J$4+$J$5)) =$J$6 =G19-H19-I19
6 =RAND() =IF(B20<0.05,5,VLOOKUP(B20,$B$4:$C$11,2,TRUE)) =RAND() =IF(D20<0.15,0,VLOOKUP(D20,$F$4:$G$8,2,TRUE)) =IF(C20<=$J$3,0,C20-$J$3) =C20*$J$4 =IF(C20<=6,0,F20*($J$4+$J$5)) =$J$6 =G20-H20-I20
7 =RAND() =IF(B21<0.05,5,VLOOKUP(B21,$B$4:$C$11,2,TRUE)) =RAND() =IF(D21<0.15,0,VLOOKUP(D21,$F$4:$G$8,2,TRUE)) =IF(C21<=$J$3,0,C21-$J$3) =C21*$J$4 =IF(C21<=6,0,F21*($J$4+$J$5)) =$J$6 =G21-H21-I21
8 =RAND() =IF(B22<0.05,5,VLOOKUP(B22,$B$4:$C$11,2,TRUE)) =RAND() =IF(D22<0.15,0,VLOOKUP(D22,$F$4:$G$8,2,TRUE)) =IF(C22<=$J$3,0,C22-$J$3) =C22*$J$4 =IF(C22<=6,0,F22*($J$4+$J$5)) =$J$6 =G22-H22-I22
9 =RAND() =IF(B23<0.05,5,VLOOKUP(B23,$B$4:$C$11,2,TRUE)) =RAND() =IF(D23<0.15,0,VLOOKUP(D23,$F$4:$G$8,2,TRUE)) =IF(C23<=$J$3,0,C23-$J$3) =C23*$J$4 =IF(C23<=6,0,F23*($J$4+$J$5)) =$J$6 =G23-H23-I23
10 =RAND() =IF(B24<0.05,5,VLOOKUP(B24,$B$4:$C$11,2,TRUE)) =RAND() =IF(D24<0.15,0,VLOOKUP(D24,$F$4:$G$8,2,TRUE)) =IF(C24<=$J$3,0,C24-$J$3) =C24*$J$4 =IF(C24<=6,0,F24*($J$4+$J$5)) =$J$6 =G24-H24-I24
11 =RAND() =IF(B25<0.05,5,VLOOKUP(B25,$B$4:$C$11,2,TRUE)) =RAND() =IF(D25<0.15,0,VLOOKUP(D25,$F$4:$G$8,2,TRUE)) =IF(C25<=$J$3,0,C25-$J$3) =C25*$J$4 =IF(C25<=6,0,F25*($J$4+$J$5)) =$J$6 =G25-H25-I25
12 =RAND() =IF(B26<0.05,5,VLOOKUP(B26,$B$4:$C$11,2,TRUE)) =RAND() =IF(D26<0.15,0,VLOOKUP(D26,$F$4:$G$8,2,TRUE)) =IF(C26<=$J$3,0,C26-$J$3) =C26*$J$4 =IF(C26<=6,0,F26*($J$4+$J$5)) =$J$6 =G26-H26-I26
13 =RAND() =IF(B27<0.05,5,VLOOKUP(B27,$B$4:$C$11,2,TRUE)) =RAND() =IF(D27<0.15,0,VLOOKUP(D27,$F$4:$G$8,2,TRUE)) =IF(C27<=$J$3,0,C27-$J$3) =C27*$J$4 =IF(C27<=6,0,F27*($J$4+$J$5)) =$J$6 =G27-H27-I27
14 =RAND() =IF(B28<0.05,5,VLOOKUP(B28,$B$4:$C$11,2,TRUE)) =RAND() =IF(D28<0.15,0,VLOOKUP(D28,$F$4:$G$8,2,TRUE)) =IF(C28<=$J$3,0,C28-$J$3) =C28*$J$4 =IF(C28<=6,0,F28*($J$4+$J$5)) =$J$6 =G28-H28-I28
15 =RAND() =IF(B29<0.05,5,VLOOKUP(B29,$B$4:$C$11,2,TRUE)) =RAND() =IF(D29<0.15,0,VLOOKUP(D29,$F$4:$G$8,2,TRUE)) =IF(C29<=$J$3,0,C29-$J$3) =C29*$J$4 =IF(C29<=6,0,F29*($J$4+$J$5)) =$J$6 =G29-H29-I29
16 =RAND() =IF(B30<0.05,5,VLOOKUP(B30,$B$4:$C$11,2,TRUE)) =RAND() =IF(D30<0.15,0,VLOOKUP(D30,$F$4:$G$8,2,TRUE)) =IF(C30<=$J$3,0,C30-$J$3) =C30*$J$4 =IF(C30<=6,0,F30*($J$4+$J$5)) =$J$6 =G30-H30-I30
17 =RAND() =IF(B31<0.05,5,VLOOKUP(B31,$B$4:$C$11,2,TRUE)) =RAND() =IF(D31<0.15,0,VLOOKUP(D31,$F$4:$G$8,2,TRUE)) =IF(C31<=$J$3,0,C31-$J$3) =C31*$J$4 =IF(C31<=6,0,F31*($J$4+$J$5)) =$J$6 =G31-H31-I31
18 =RAND() =IF(B32<0.05,5,VLOOKUP(B32,$B$4:$C$11,2,TRUE)) =RAND() =IF(D32<0.15,0,VLOOKUP(D32,$F$4:$G$8,2,TRUE)) =IF(C32<=$J$3,0,C32-$J$3) =C32*$J$4 =IF(C32<=6,0,F32*($J$4+$J$5)) =$J$6 =G32-H32-I32
19 =RAND() =IF(B33<0.05,5,VLOOKUP(B33,$B$4:$C$11,2,TRUE)) =RAND() =IF(D33<0.15,0,VLOOKUP(D33,$F$4:$G$8,2,TRUE)) =IF(C33<=$J$3,0,C33-$J$3) =C33*$J$4 =IF(C33<=6,0,F33*($J$4+$J$5)) =$J$6 =G33-H33-I33
20 =RAND() =IF(B34<0.05,5,VLOOKUP(B34,$B$4:$C$11,2,TRUE)) =RAND() =IF(D34<0.15,0,VLOOKUP(D34,$F$4:$G$8,2,TRUE)) =IF(C34<=$J$3,0,C34-$J$3) =C34*$J$4 =IF(C34<=6,0,F34*($J$4+$J$5)) =$J$6 =G34-H34-I34
21 =RAND() =IF(B35<0.05,5,VLOOKUP(B35,$B$4:$C$11,2,TRUE)) =RAND() =IF(D35<0.15,0,VLOOKUP(D35,$F$4:$G$8,2,TRUE)) =IF(C35<=$J$3,0,C35-$J$3) =C35*$J$4 =IF(C35<=6,0,F35*($J$4+$J$5)) =$J$6 =G35-H35-I35
22 =RAND() =IF(B36<0.05,5,VLOOKUP(B36,$B$4:$C$11,2,TRUE)) =RAND() =IF(D36<0.15,0,VLOOKUP(D36,$F$4:$G$8,2,TRUE)) =IF(C36<=$J$3,0,C36-$J$3) =C36*$J$4 =IF(C36<=6,0,F36*($J$4+$J$5)) =$J$6 =G36-H36-I36
23 =RAND() =IF(B37<0.05,5,VLOOKUP(B37,$B$4:$C$11,2,TRUE)) =RAND() =IF(D37<0.15,0,VLOOKUP(D37,$F$4:$G$8,2,TRUE)) =IF(C37<=$J$3,0,C37-$J$3) =C37*$J$4 =IF(C37<=6,0,F37*($J$4+$J$5)) =$J$6 =G37-H37-I37
24 =RAND() =IF(B38<0.05,5,VLOOKUP(B38,$B$4:$C$11,2,TRUE)) =RAND() =IF(D38<0.15,0,VLOOKUP(D38,$F$4:$G$8,2,TRUE)) =IF(C38<=$J$3,0,C38-$J$3) =C38*$J$4 =IF(C38<=6,0,F38*($J$4+$J$5)) =$J$6 =G38-H38-I38
25 =RAND() =IF(B39<0.05,5,VLOOKUP(B39,$B$4:$C$11,2,TRUE)) =RAND() =IF(D39<0.15,0,VLOOKUP(D39,$F$4:$G$8,2,TRUE)) =IF(C39<=$J$3,0,C39-$J$3) =C39*$J$4 =IF(C39<=6,0,F39*($J$4+$J$5)) =$J$6 =G39-H39-I39
26 =RAND() =IF(B40<0.05,5,VLOOKUP(B40,$B$4:$C$11,2,TRUE)) =RAND() =IF(D40<0.15,0,VLOOKUP(D40,$F$4:$G$8,2,TRUE)) =IF(C40<=$J$3,0,C40-$J$3) =C40*$J$4 =IF(C40<=6,0,F40*($J$4+$J$5)) =$J$6 =G40-H40-I40
27 =RAND() =IF(B41<0.05,5,VLOOKUP(B41,$B$4:$C$11,2,TRUE)) =RAND() =IF(D41<0.15,0,VLOOKUP(D41,$F$4:$G$8,2,TRUE)) =IF(C41<=$J$3,0,C41-$J$3) =C41*$J$4 =IF(C41<=6,0,F41*($J$4+$J$5)) =$J$6 =G41-H41-I41
28 =RAND() =IF(B42<0.05,5,VLOOKUP(B42,$B$4:$C$11,2,TRUE)) =RAND() =IF(D42<0.15,0,VLOOKUP(D42,$F$4:$G$8,2,TRUE)) =IF(C42<=$J$3,0,C42-$J$3) =C42*$J$4 =IF(C42<=6,0,F42*($J$4+$J$5)) =$J$6 =G42-H42-I42
29 =RAND() =IF(B43<0.05,5,VLOOKUP(B43,$B$4:$C$11,2,TRUE)) =RAND() =IF(D43<0.15,0,VLOOKUP(D43,$F$4:$G$8,2,TRUE)) =IF(C43<=$J$3,0,C43-$J$3) =C43*$J$4 =IF(C43<=6,0,F43*($J$4+$J$5)) =$J$6 =G43-H43-I43
30 =RAND() =IF(B44<0.05,5,VLOOKUP(B44,$B$4:$C$11,2,TRUE)) =RAND() =IF(D44<0.15,0,VLOOKUP(D44,$F$4:$G$8,2,TRUE)) =IF(C44<=$J$3,0,C44-$J$3) =C44*$J$4 =IF(C44<=6,0,F44*($J$4+$J$5)) =$J$6 =G44-H44-I44
Answer 3.2
The profitability of the ABC is negative when the number of overbooking is greater or
equal to 3.
Answer 3.3
The ABC airlines profitability mainly comes from the exact fare of the seats and the
reservation of the overbooking of the seats. However, it is seen that when the overbooking
exceeds the number of seats that is 3 or equals to 3, it faces a negative profit that is loss. The
loss comes from the high reservation and compensation fare. Hence, the ABC airline
company should focus on the overbooking and should set a barrier on the over booking.
Moreover, the airline company should check the compensation policy to reduce the uncertain
losses. Except this the demand and the supply of the service seems to be well-meet at
equilibrium if the policies are checked and introduced in order to reduce the losses.
Answer 4.1
Table 4.1: Regression result of regress of GPA on GMAT
SUMMARY
OUTPUT
8INFORMATION AND DECISION ANALYSIS
Regression Statistics
Multiple R 0.663
R Square 0.439
Adjusted R Square 0.383
Standard Error 0.290
Observations 12
ANOVA
df SS MS F Significanc
e F
Regression 1 0.659 0.65
9 7.837 0.019
Residual 10 0.840 0.08
4
Total 11 1.499
Coefficient
s
Standard
Error
t
Stat
P-
value Lower 95%
Intercept 2.094 0.518 4.04
1 0.002 0.939
GMAT 0.002 0.001 2.79
9 0.019 0.001
Estimated regression equation from the above table:
^GPA=2.094 +(0.002∗GMAT )
From the above table, it is observed that R2 is 0.439 and the F-stat is F (1,10) = 7.837
at p-value 0.019. This implies that the model is better fit than without independent variable
and can predict with 43.9% accuracy.
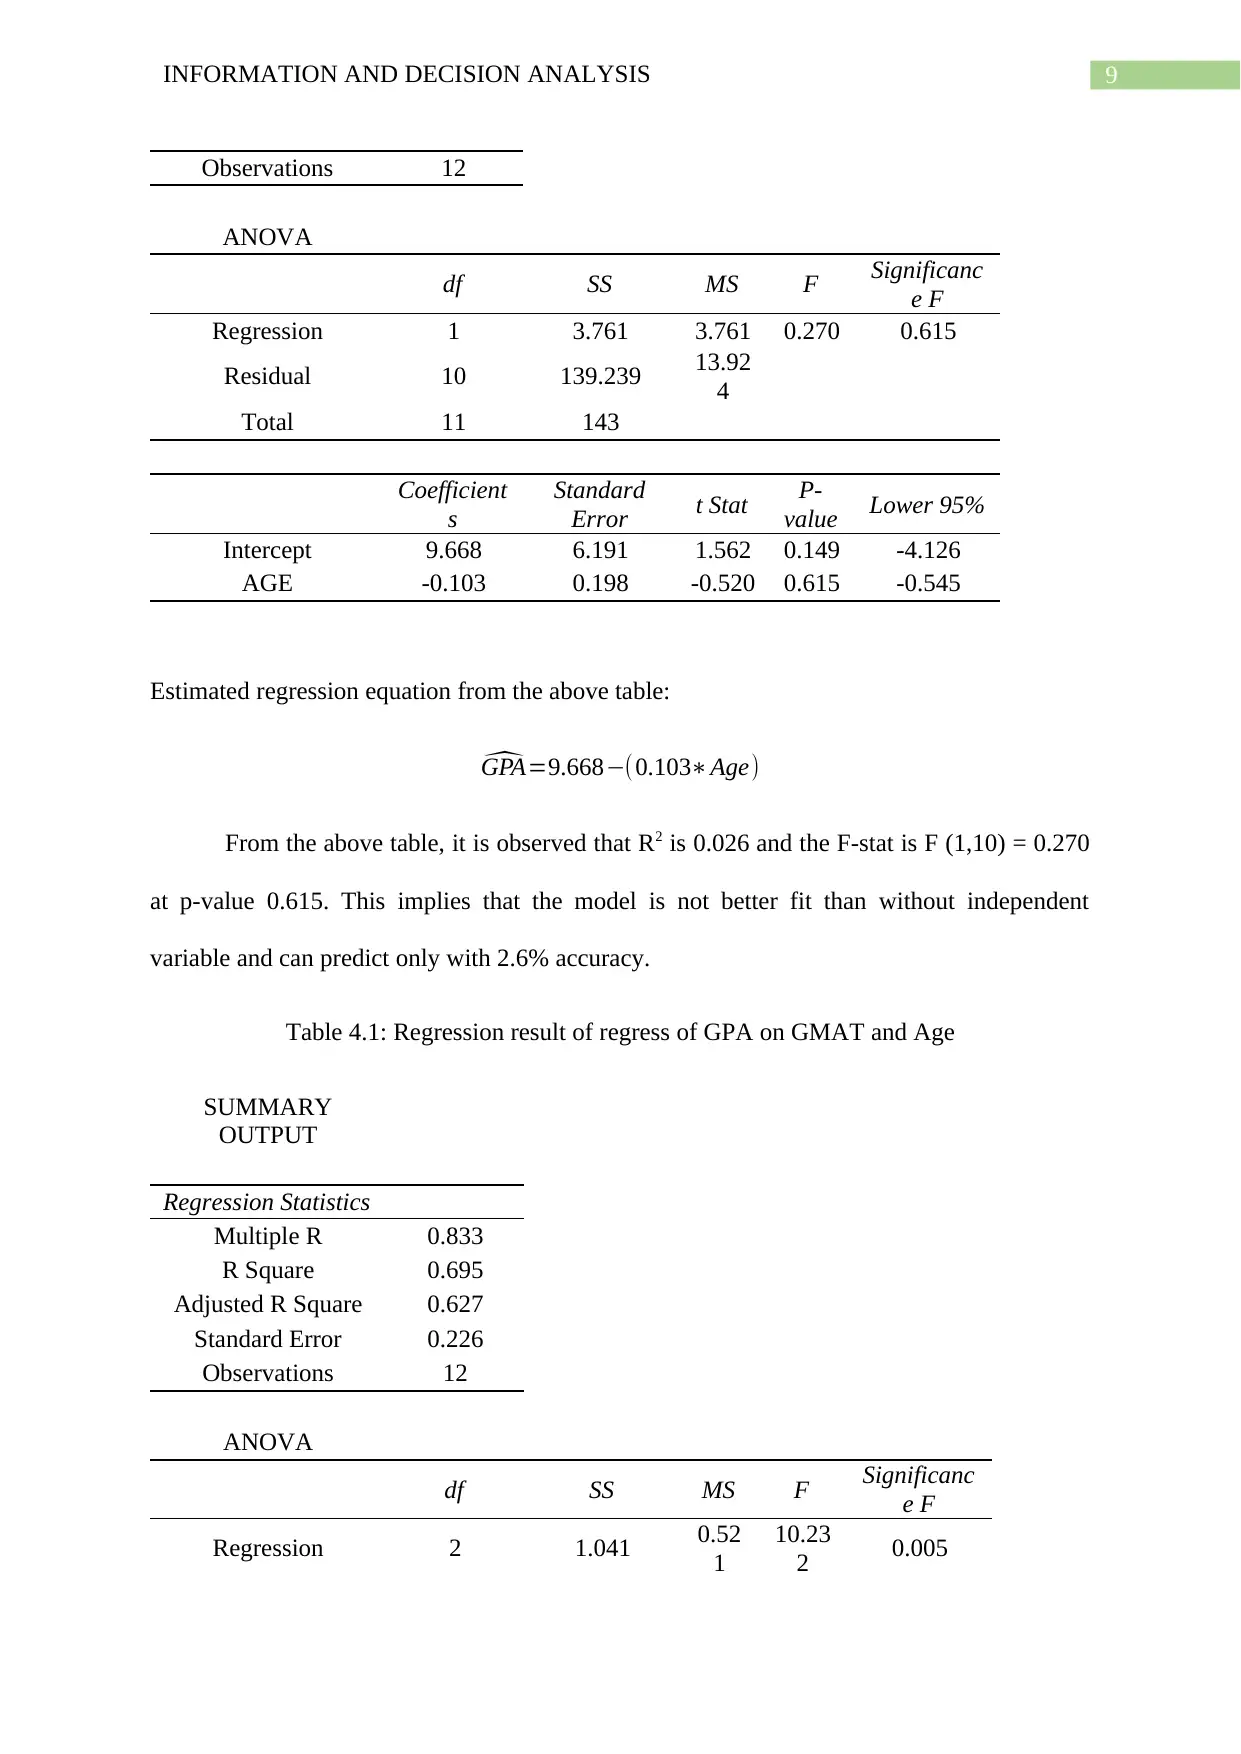
Table 4.2: Regression result of regress of GPA on Age
SUMMARY
OUTPUT
Regression Statistics
Multiple R 0.162
R Square 0.026
Adjusted R Square -0.071
Standard Error 3.731
Regression Statistics
Multiple R 0.663
R Square 0.439
Adjusted R Square 0.383
Standard Error 0.290
Observations 12
ANOVA
df SS MS F Significanc
e F
Regression 1 0.659 0.65
9 7.837 0.019
Residual 10 0.840 0.08
4
Total 11 1.499
Coefficient
s
Standard
Error
t
Stat
P-
value Lower 95%
Intercept 2.094 0.518 4.04
1 0.002 0.939
GMAT 0.002 0.001 2.79
9 0.019 0.001
Estimated regression equation from the above table:
^GPA=2.094 +(0.002∗GMAT )
From the above table, it is observed that R2 is 0.439 and the F-stat is F (1,10) = 7.837
at p-value 0.019. This implies that the model is better fit than without independent variable
and can predict with 43.9% accuracy.
Table 4.2: Regression result of regress of GPA on Age
SUMMARY
OUTPUT
Regression Statistics
Multiple R 0.162
R Square 0.026
Adjusted R Square -0.071
Standard Error 3.731
⊘ This is a preview!⊘
Do you want full access?
Subscribe today to unlock all pages.
Trusted by 1+ million students worldwide
9INFORMATION AND DECISION ANALYSIS
Observations 12
ANOVA
df SS MS F Significanc
e F
Regression 1 3.761 3.761 0.270 0.615
Residual 10 139.239 13.92
4
Total 11 143
Coefficient
s
Standard
Error t Stat P-
value Lower 95%
Intercept 9.668 6.191 1.562 0.149 -4.126
AGE -0.103 0.198 -0.520 0.615 -0.545
Estimated regression equation from the above table:
^GPA=9.668−(0.103∗Age)
From the above table, it is observed that R2 is 0.026 and the F-stat is F (1,10) = 0.270
at p-value 0.615. This implies that the model is not better fit than without independent
variable and can predict only with 2.6% accuracy.
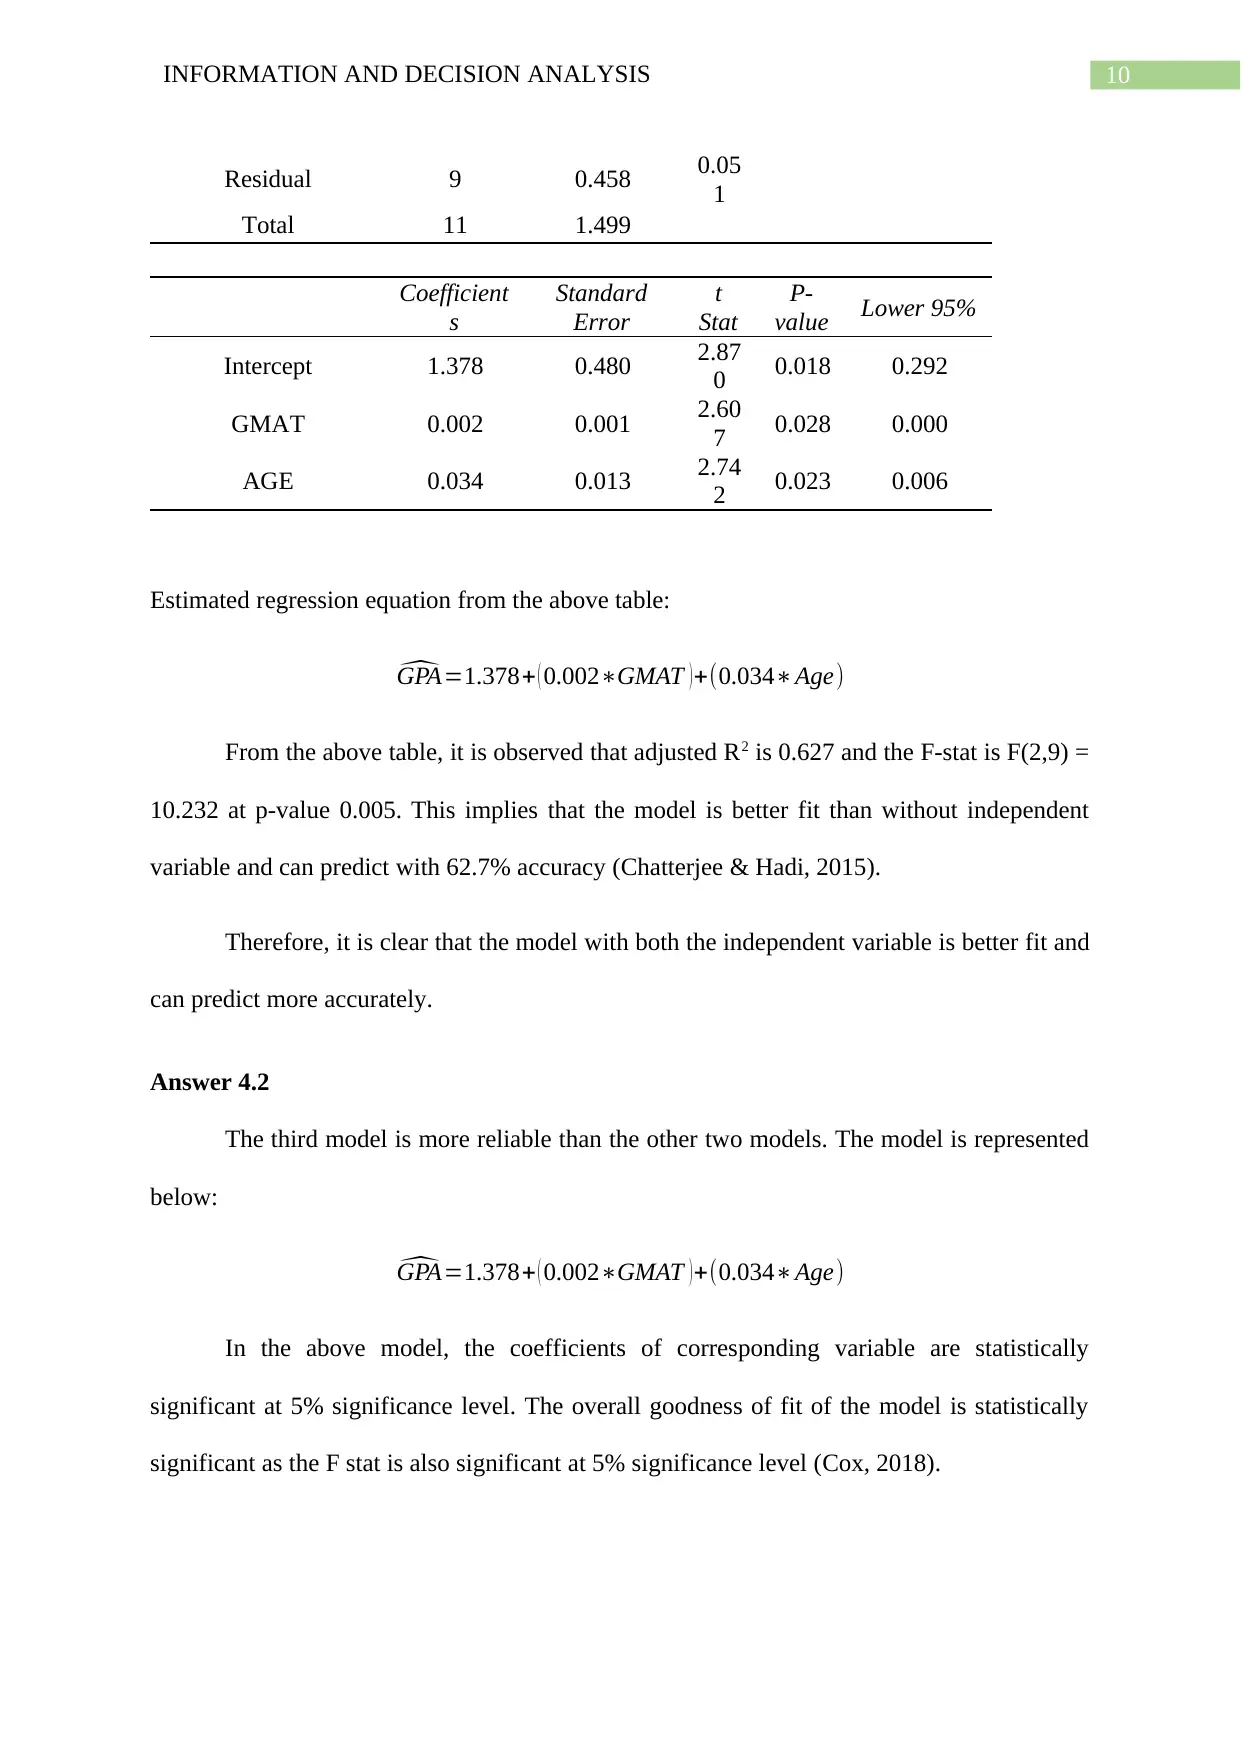
Table 4.1: Regression result of regress of GPA on GMAT and Age
SUMMARY
OUTPUT
Regression Statistics
Multiple R 0.833
R Square 0.695
Adjusted R Square 0.627
Standard Error 0.226
Observations 12
ANOVA
df SS MS F Significanc
e F
Regression 2 1.041 0.52
1
10.23
2 0.005
Observations 12
ANOVA
df SS MS F Significanc
e F
Regression 1 3.761 3.761 0.270 0.615
Residual 10 139.239 13.92
4
Total 11 143
Coefficient
s
Standard
Error t Stat P-
value Lower 95%
Intercept 9.668 6.191 1.562 0.149 -4.126
AGE -0.103 0.198 -0.520 0.615 -0.545
Estimated regression equation from the above table:
^GPA=9.668−(0.103∗Age)
From the above table, it is observed that R2 is 0.026 and the F-stat is F (1,10) = 0.270
at p-value 0.615. This implies that the model is not better fit than without independent
variable and can predict only with 2.6% accuracy.
Table 4.1: Regression result of regress of GPA on GMAT and Age
SUMMARY
OUTPUT
Regression Statistics
Multiple R 0.833
R Square 0.695
Adjusted R Square 0.627
Standard Error 0.226
Observations 12
ANOVA
df SS MS F Significanc
e F
Regression 2 1.041 0.52
1
10.23
2 0.005
Paraphrase This Document
Need a fresh take? Get an instant paraphrase of this document with our AI Paraphraser
10INFORMATION AND DECISION ANALYSIS
Residual 9 0.458 0.05
1
Total 11 1.499
Coefficient
s
Standard
Error
t
Stat
P-
value Lower 95%
Intercept 1.378 0.480 2.87
0 0.018 0.292
GMAT 0.002 0.001 2.60
7 0.028 0.000
AGE 0.034 0.013 2.74
2 0.023 0.006
Estimated regression equation from the above table:
^GPA=1.378+ ( 0.002∗GMAT )+(0.034∗Age)
From the above table, it is observed that adjusted R2 is 0.627 and the F-stat is F(2,9) =
10.232 at p-value 0.005. This implies that the model is better fit than without independent
variable and can predict with 62.7% accuracy (Chatterjee & Hadi, 2015).
Therefore, it is clear that the model with both the independent variable is better fit and
can predict more accurately.
Answer 4.2
The third model is more reliable than the other two models. The model is represented
below:
^GPA=1.378+ ( 0.002∗GMAT )+(0.034∗Age)
In the above model, the coefficients of corresponding variable are statistically
significant at 5% significance level. The overall goodness of fit of the model is statistically
significant as the F stat is also significant at 5% significance level (Cox, 2018).
11INFORMATION AND DECISION ANALYSIS
Answer 4.3
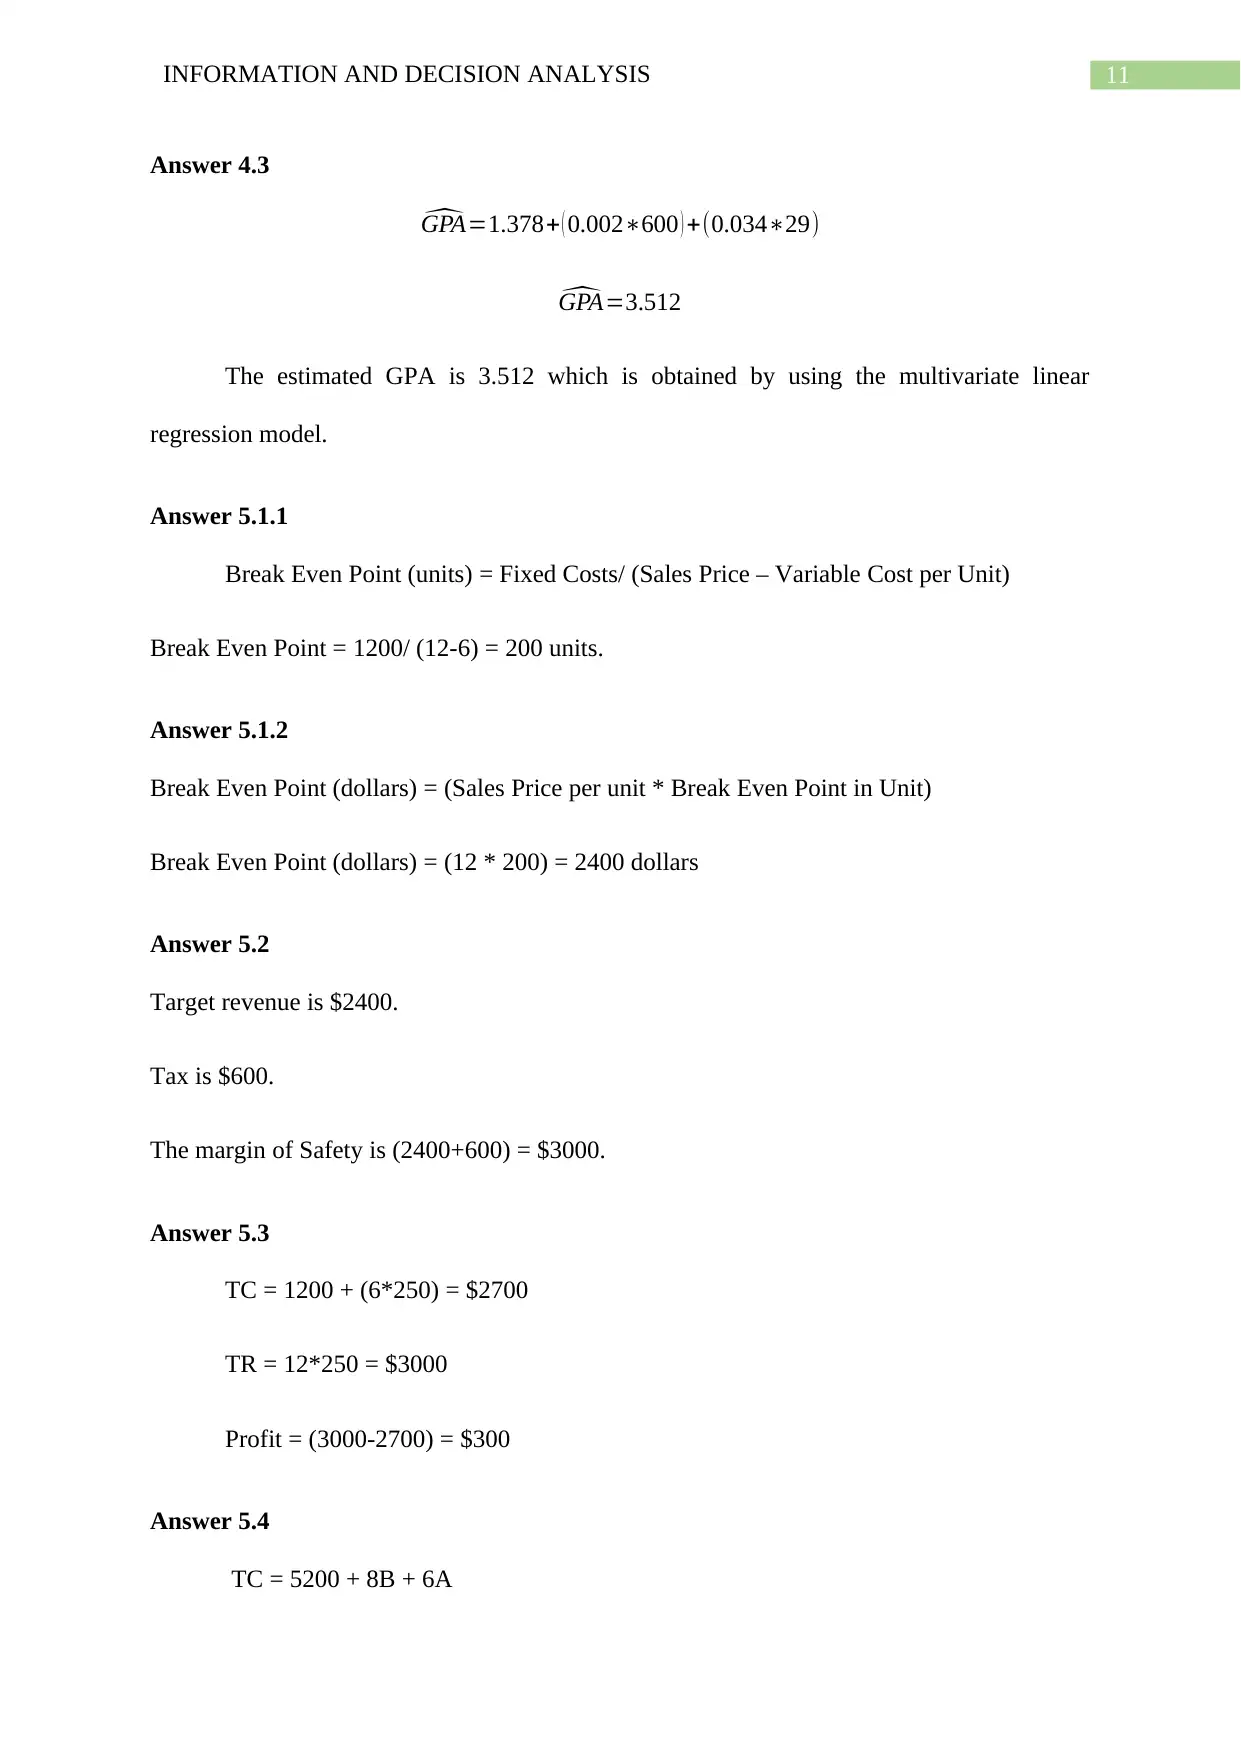
^GPA=1.378+ ( 0.002∗600 ) +(0.034∗29)
^GPA=3.512
The estimated GPA is 3.512 which is obtained by using the multivariate linear
regression model.
Answer 5.1.1
Break Even Point (units) = Fixed Costs/ (Sales Price – Variable Cost per Unit)
Break Even Point = 1200/ (12-6) = 200 units.
Answer 5.1.2
Break Even Point (dollars) = (Sales Price per unit * Break Even Point in Unit)
Break Even Point (dollars) = (12 * 200) = 2400 dollars
Answer 5.2
Target revenue is $2400.
Tax is $600.
The margin of Safety is (2400+600) = $3000.
Answer 5.3
TC = 1200 + (6*250) = $2700
TR = 12*250 = $3000
Profit = (3000-2700) = $300
Answer 5.4
TC = 5200 + 8B + 6A
Answer 4.3
^GPA=1.378+ ( 0.002∗600 ) +(0.034∗29)
^GPA=3.512
The estimated GPA is 3.512 which is obtained by using the multivariate linear
regression model.
Answer 5.1.1
Break Even Point (units) = Fixed Costs/ (Sales Price – Variable Cost per Unit)
Break Even Point = 1200/ (12-6) = 200 units.
Answer 5.1.2
Break Even Point (dollars) = (Sales Price per unit * Break Even Point in Unit)
Break Even Point (dollars) = (12 * 200) = 2400 dollars
Answer 5.2
Target revenue is $2400.
Tax is $600.
The margin of Safety is (2400+600) = $3000.
Answer 5.3
TC = 1200 + (6*250) = $2700
TR = 12*250 = $3000
Profit = (3000-2700) = $300
Answer 5.4
TC = 5200 + 8B + 6A
⊘ This is a preview!⊘
Do you want full access?
Subscribe today to unlock all pages.
Trusted by 1+ million students worldwide
1 out of 14
Related Documents


Your All-in-One AI-Powered Toolkit for Academic Success.
+13062052269
info@desklib.com
Available 24*7 on WhatsApp / Email
![[object Object]](/_next/static/media/star-bottom.7253800d.svg)
Unlock your academic potential
Copyright © 2020–2026 A2Z Services. All Rights Reserved. Developed and managed by ZUCOL.