Quarterly Business Trend Analysis for Decision Making Report

Verified

Added on  2023/04/04

|14
|271
|276
Report
AI Summary
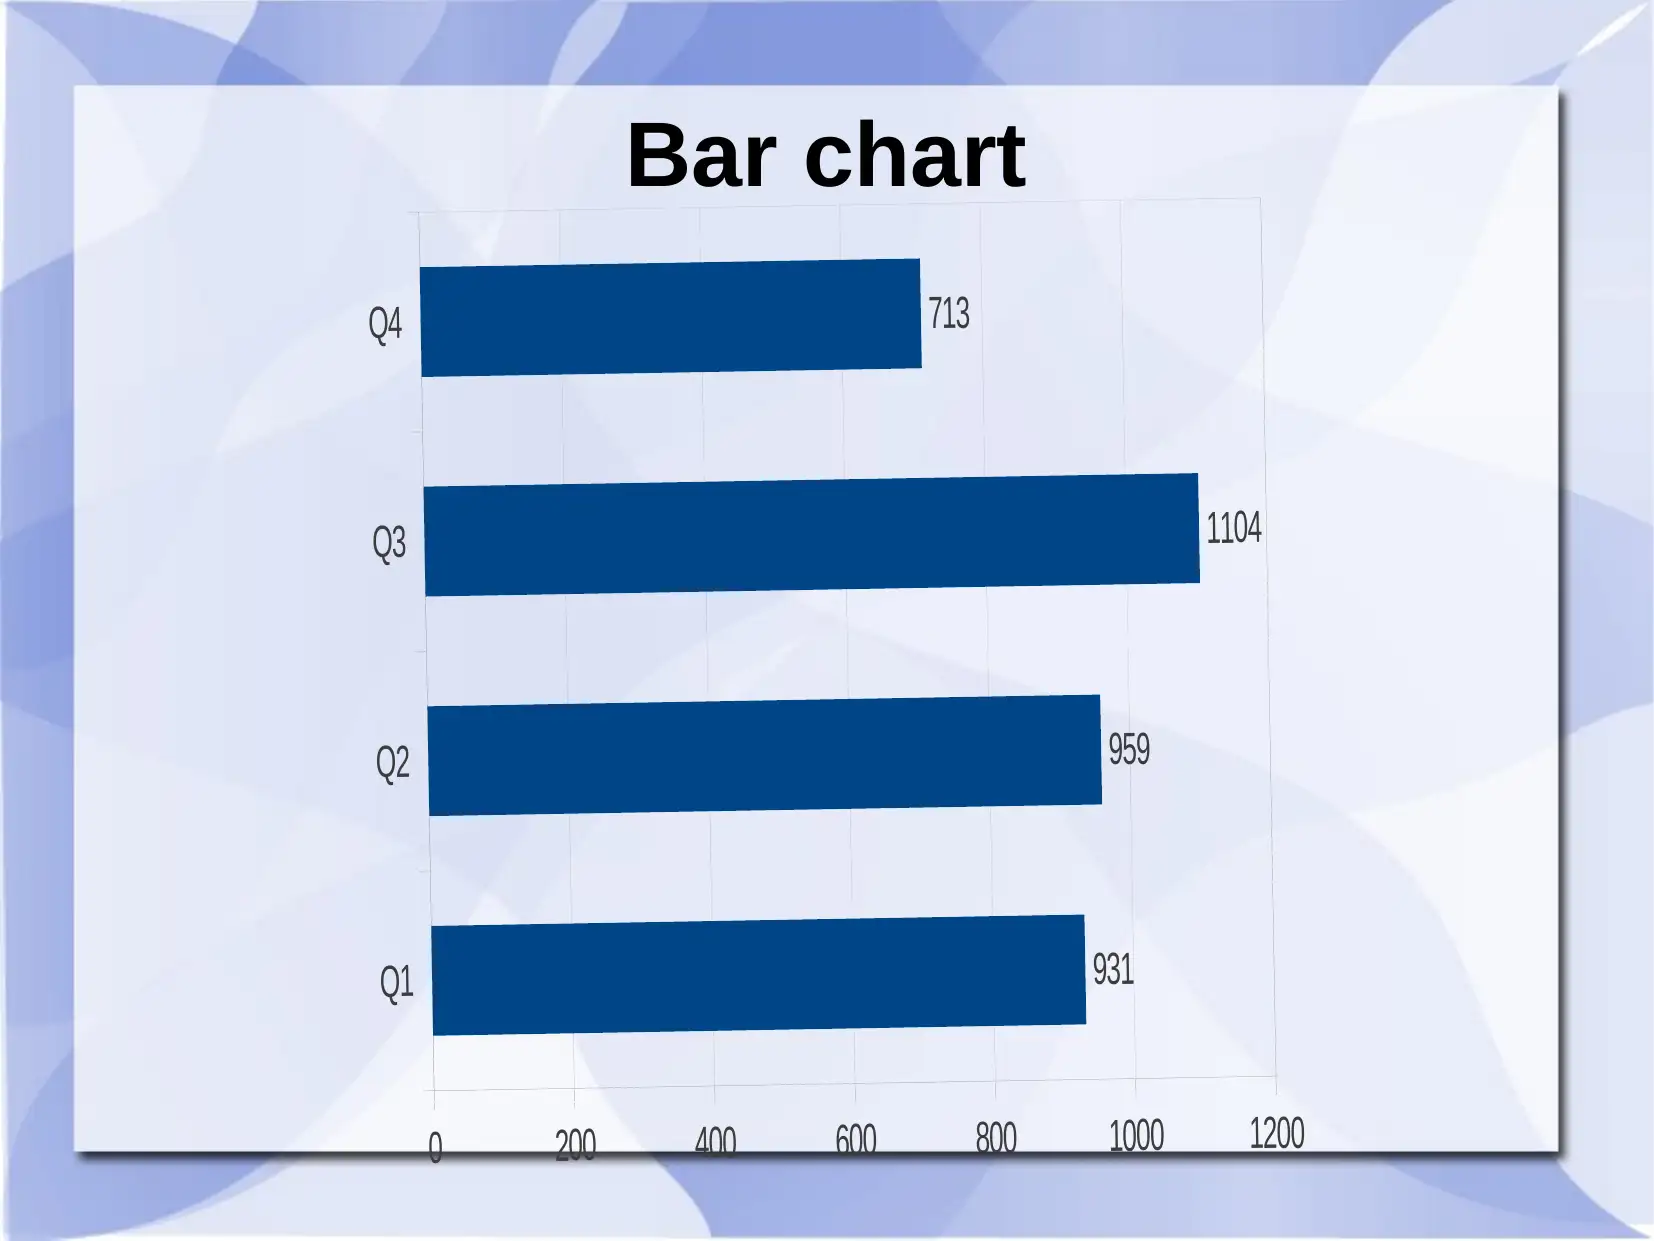
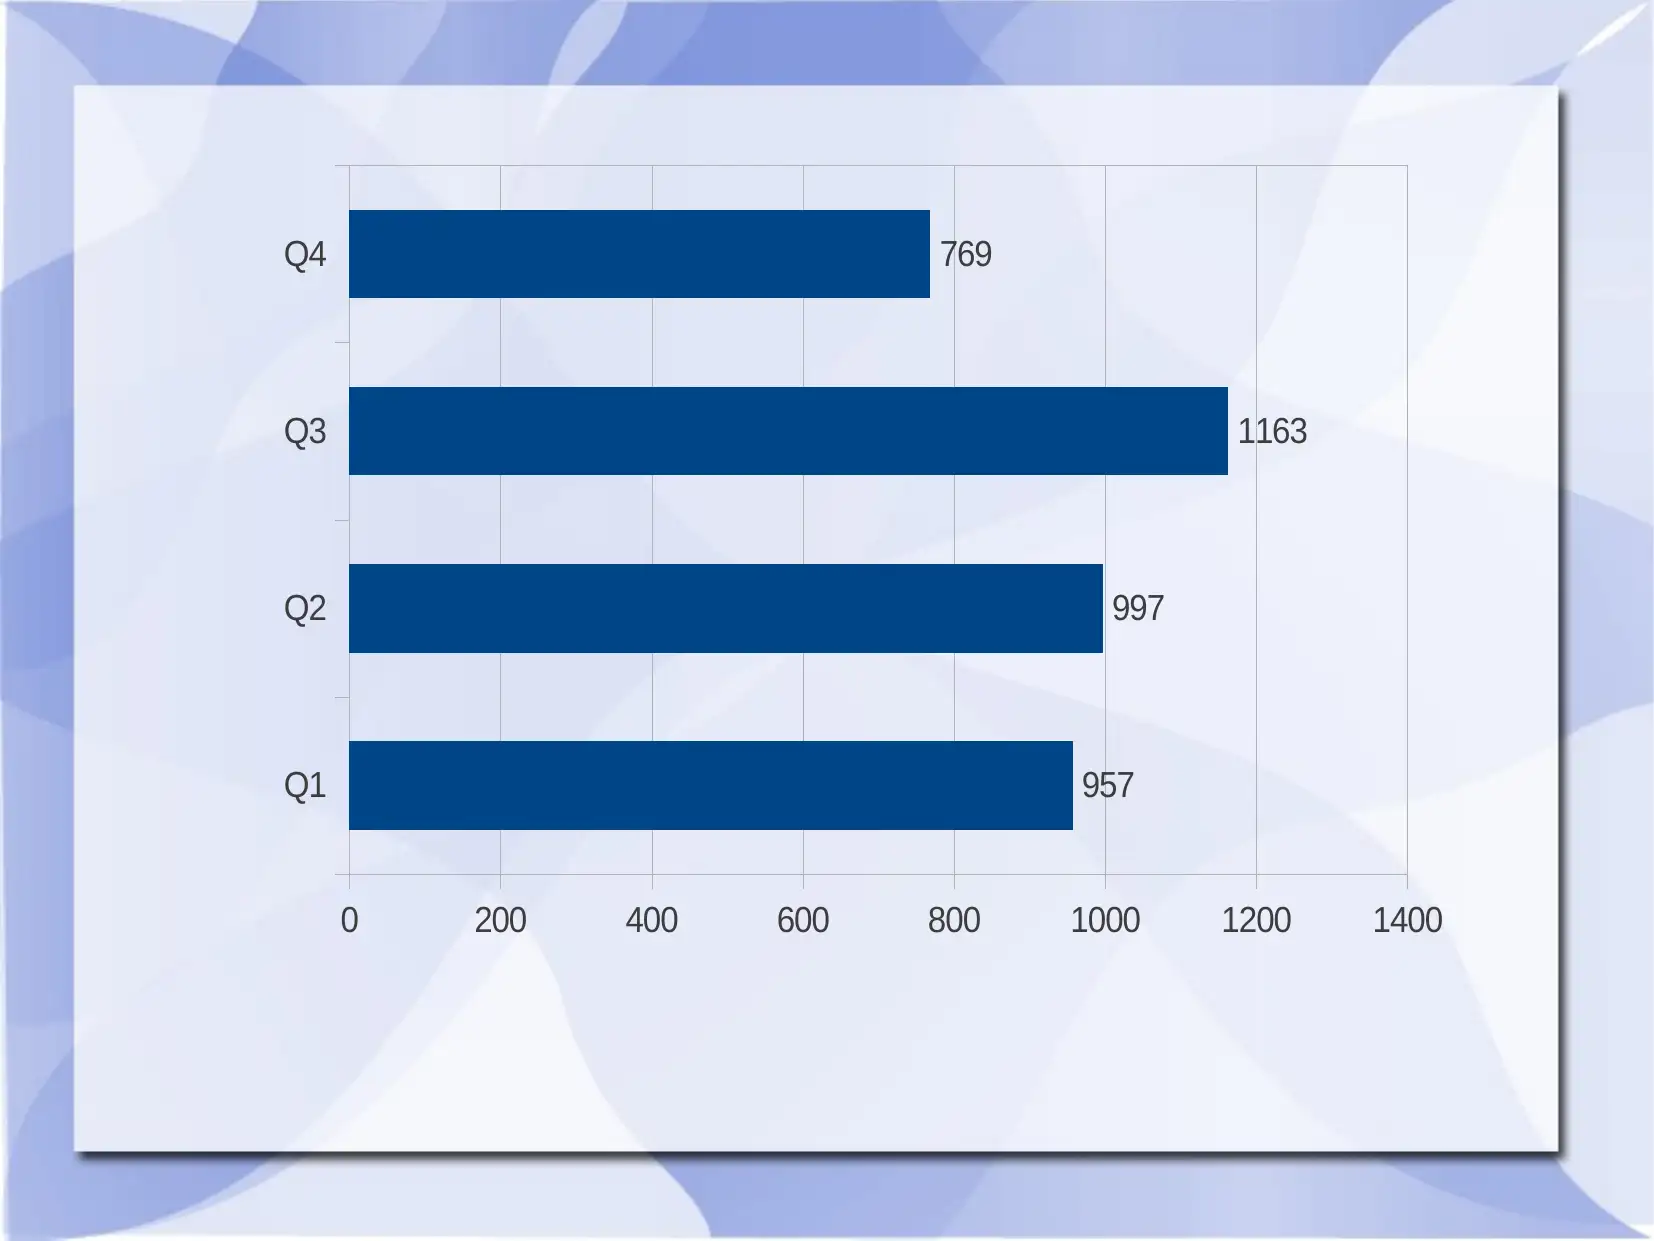
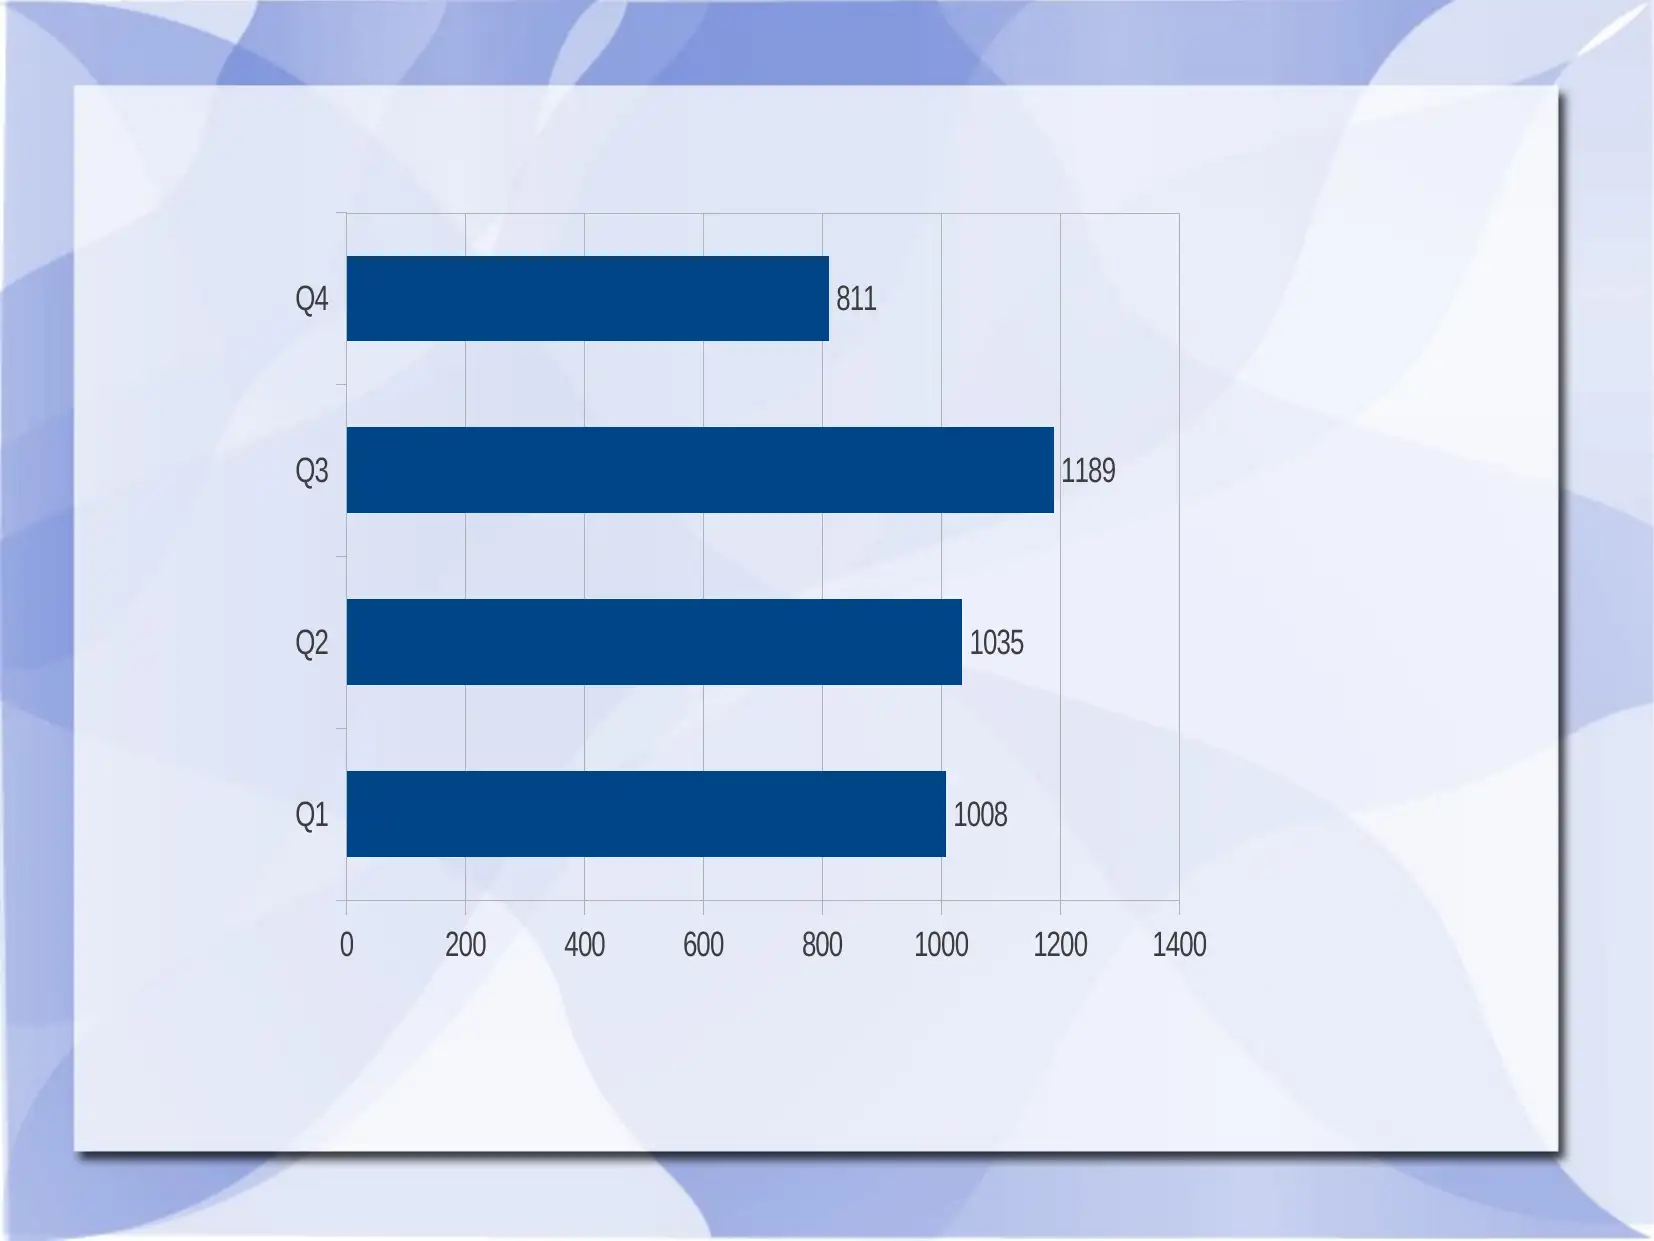
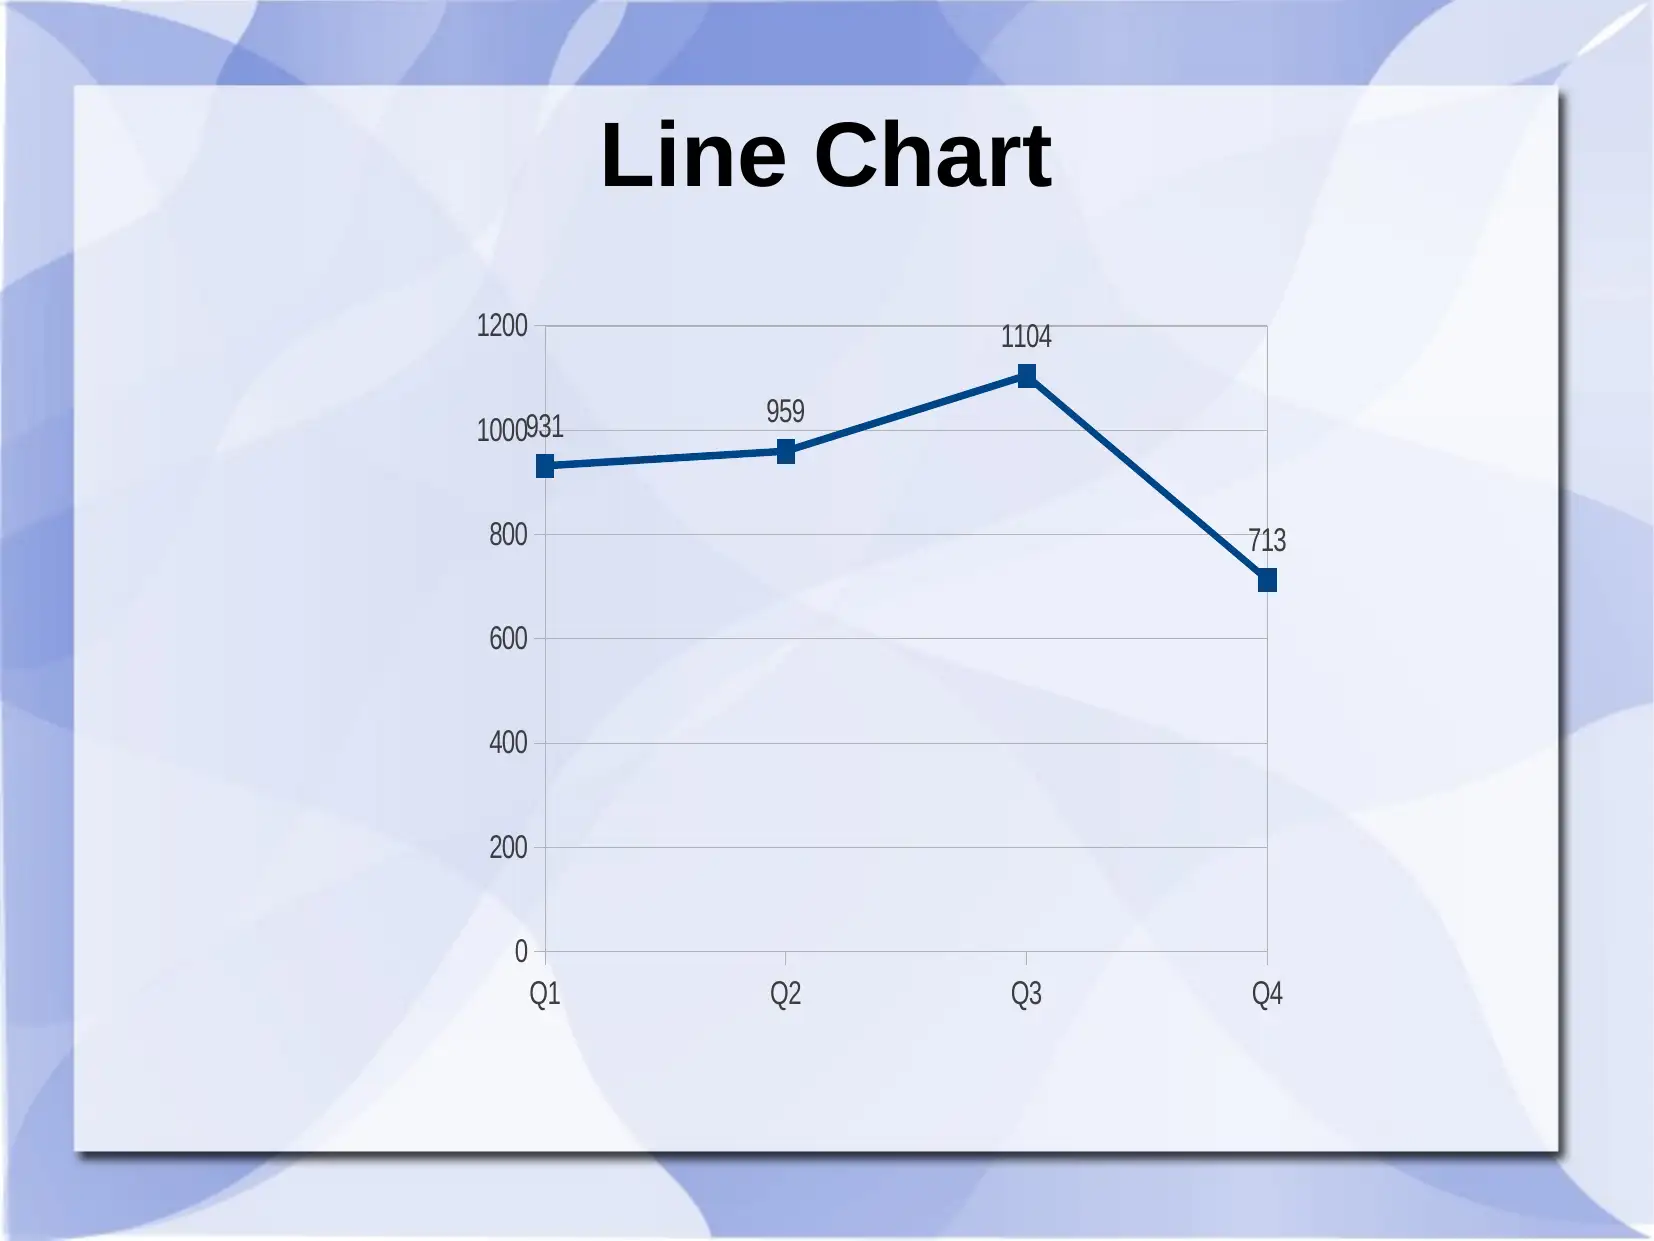
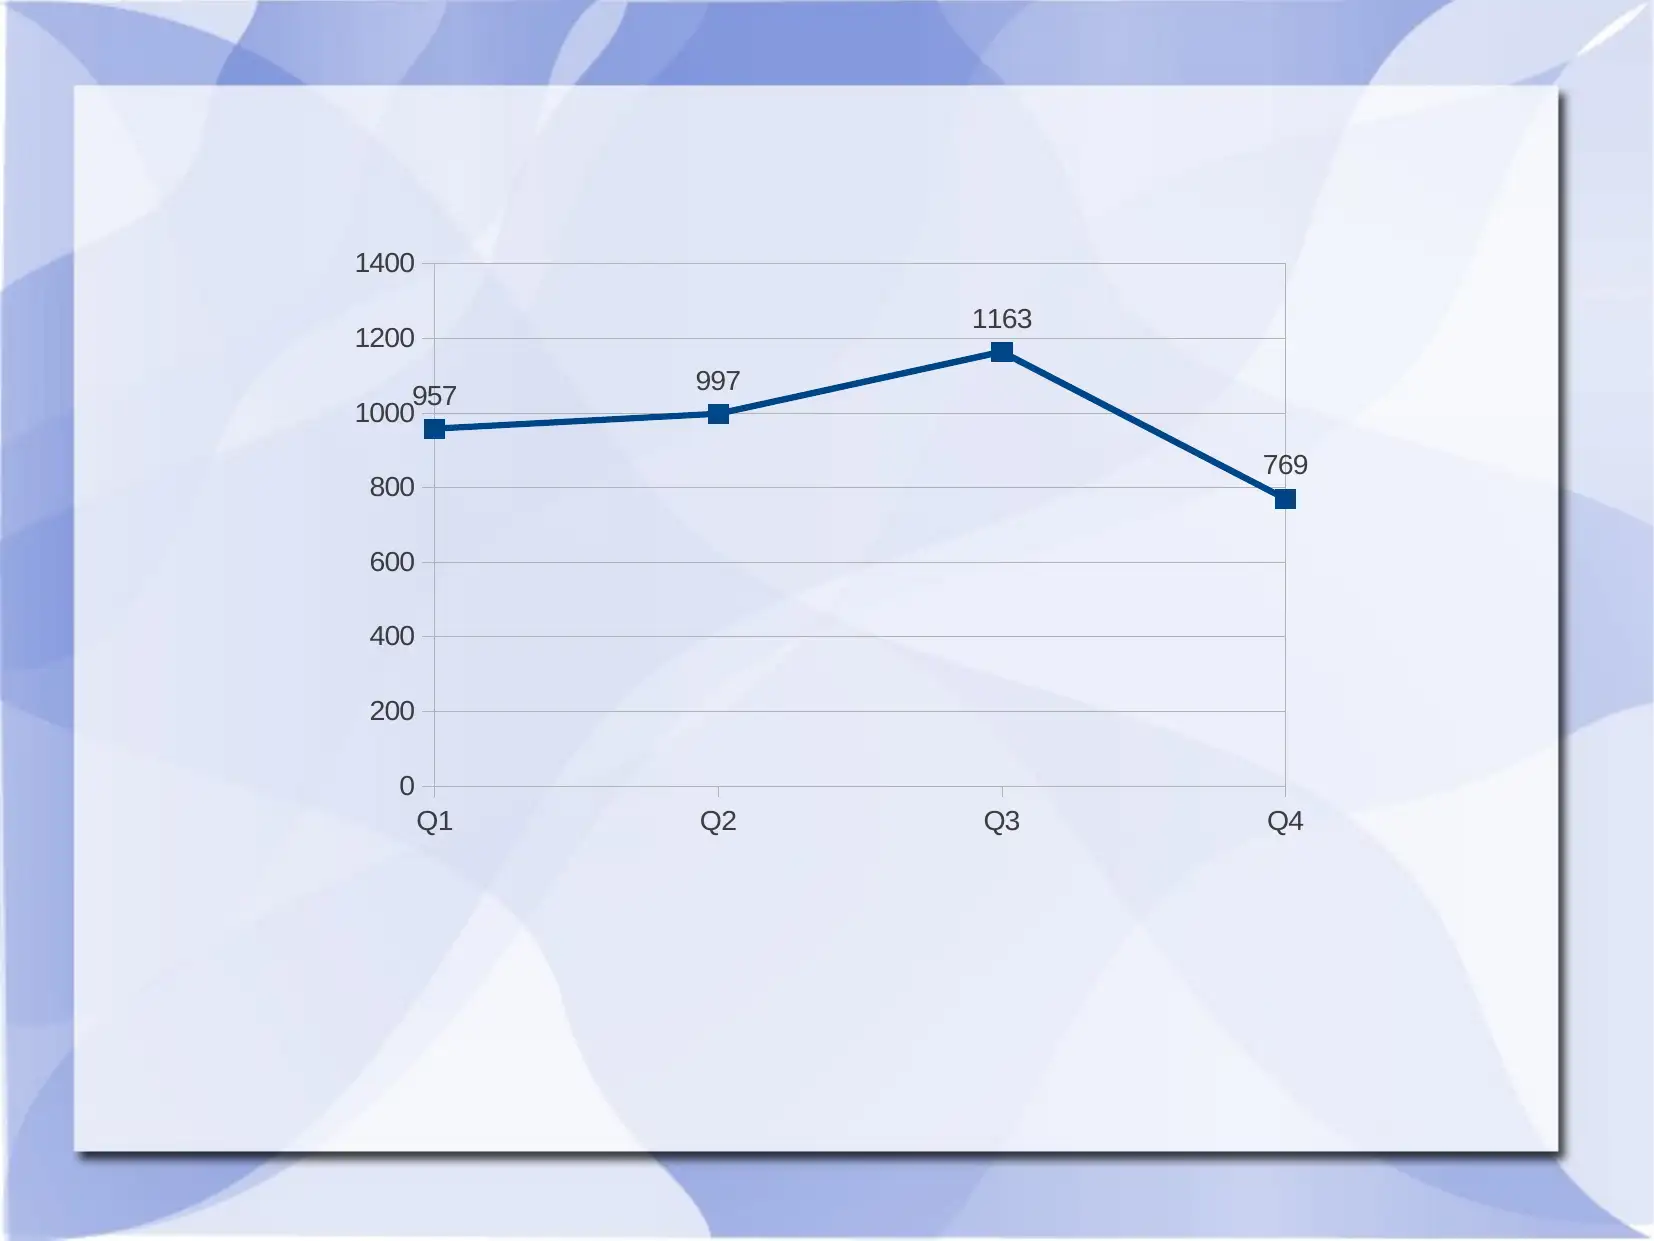
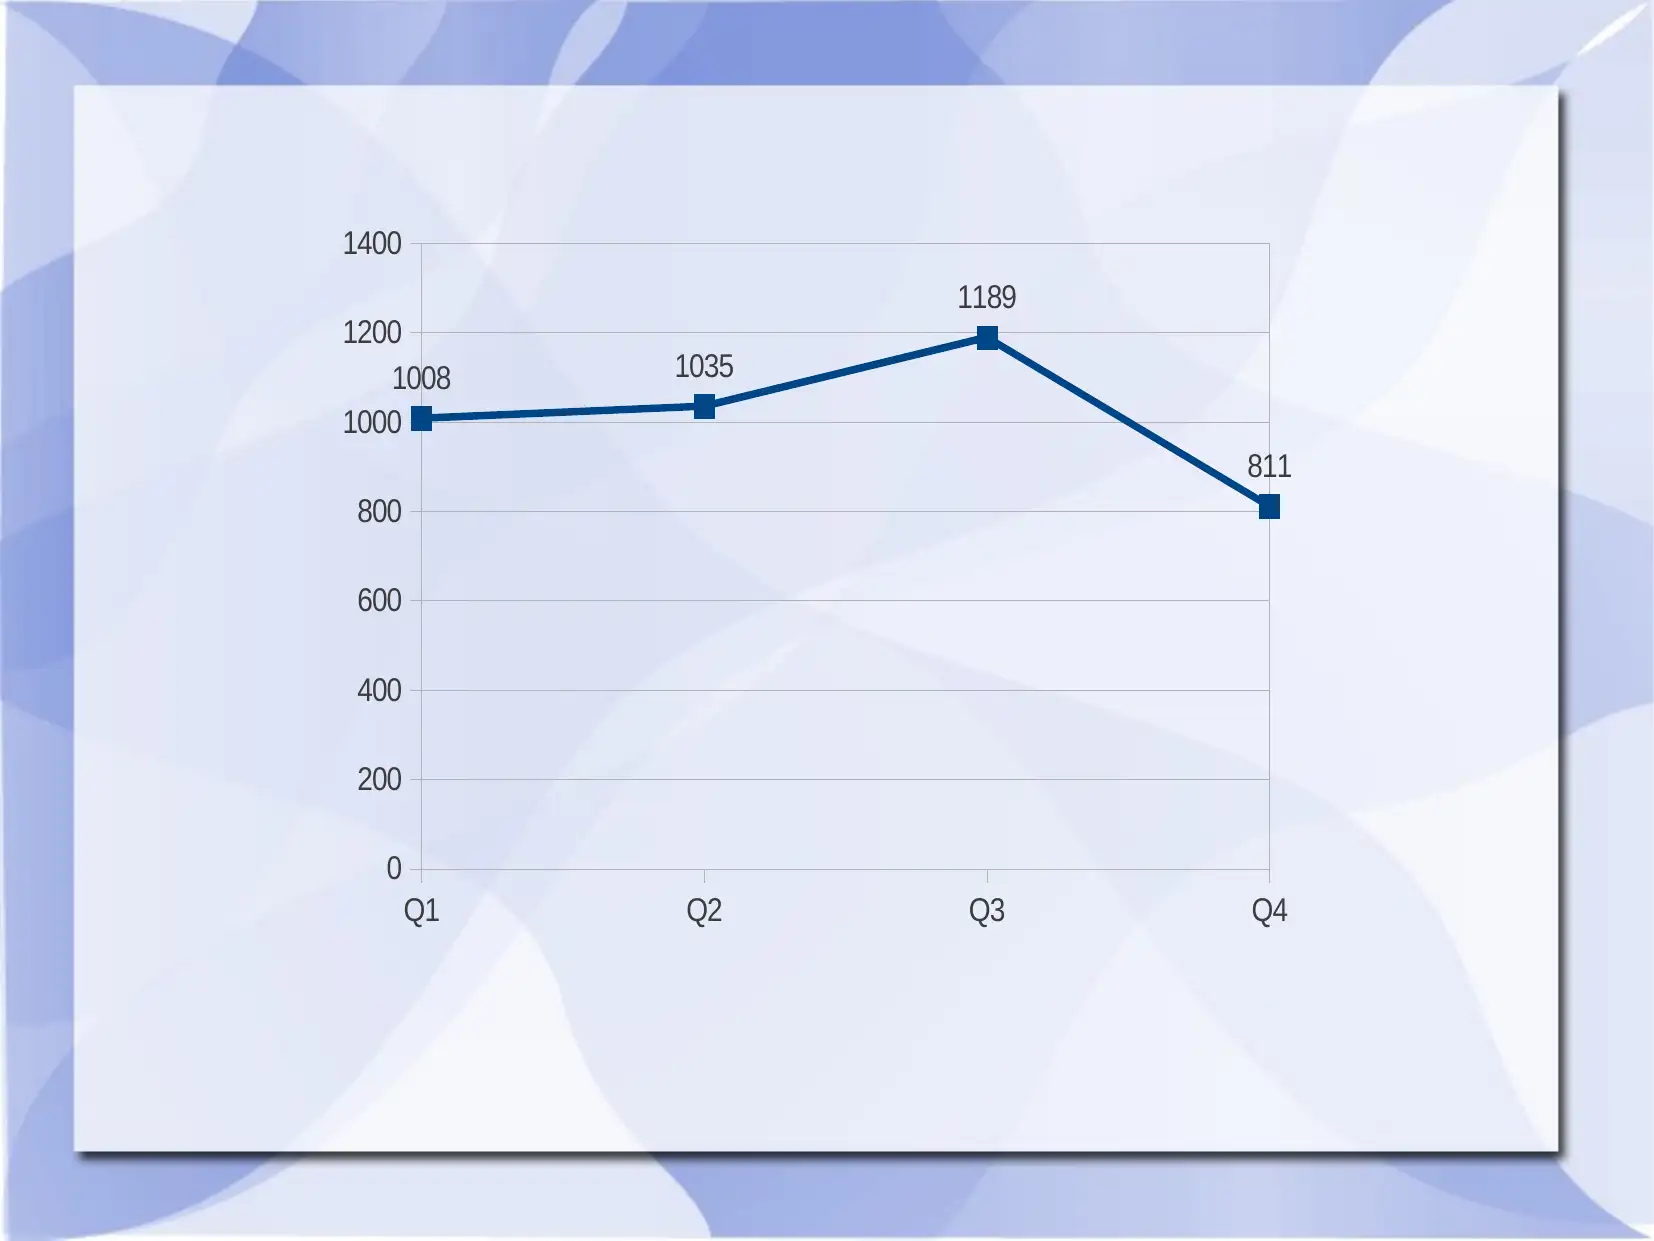
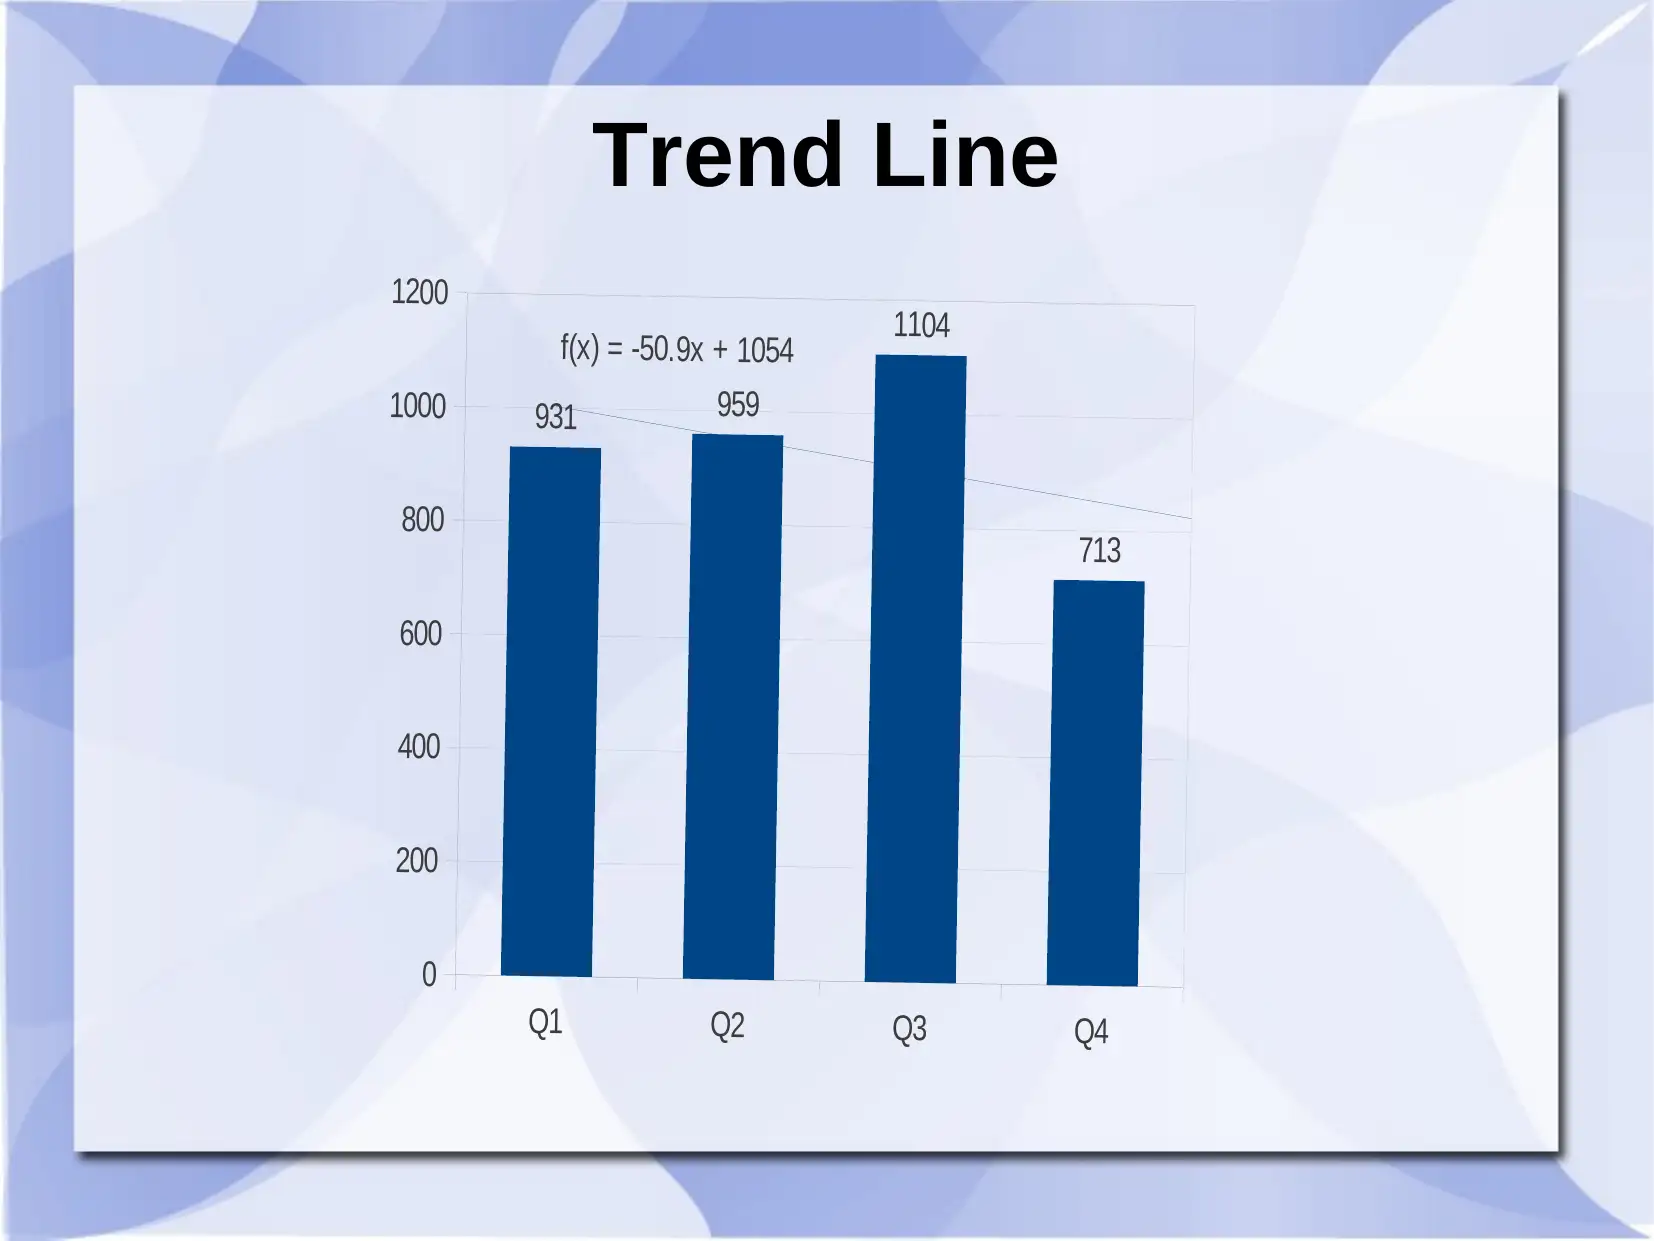
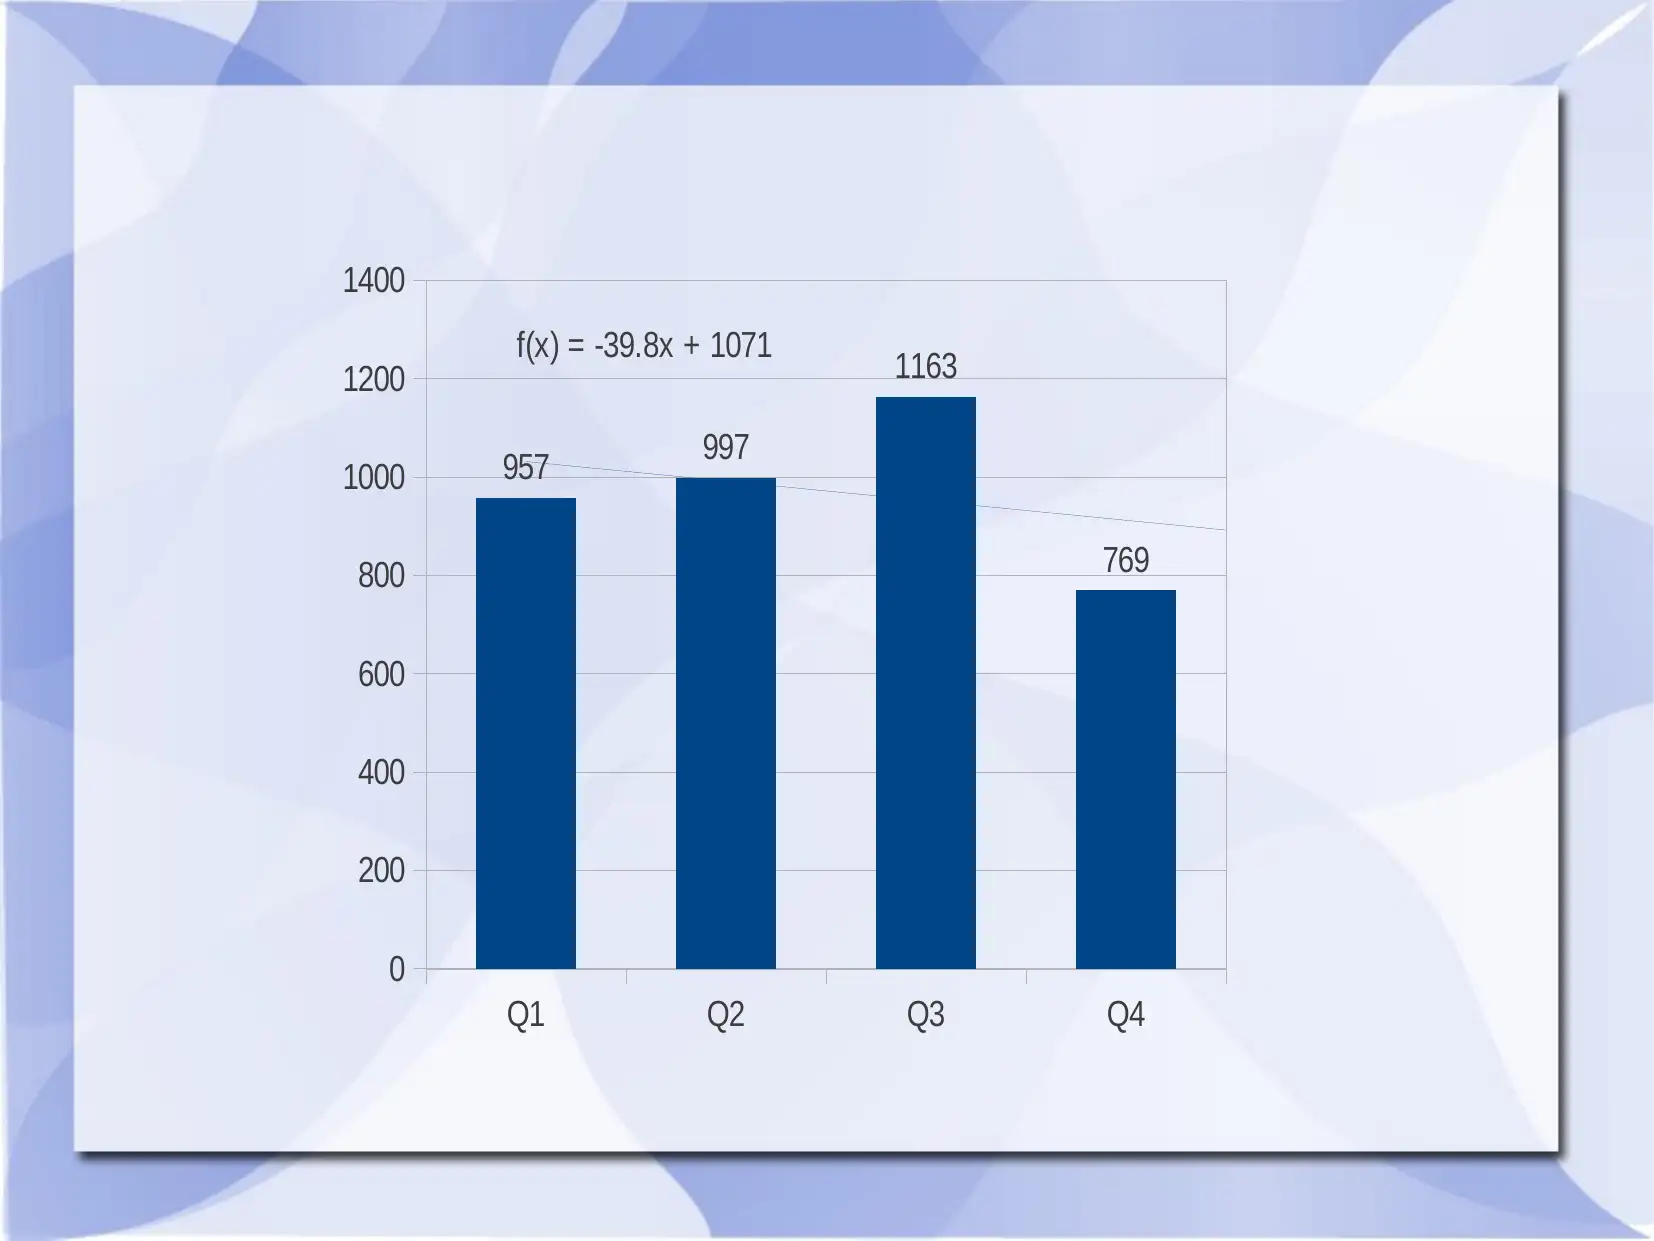
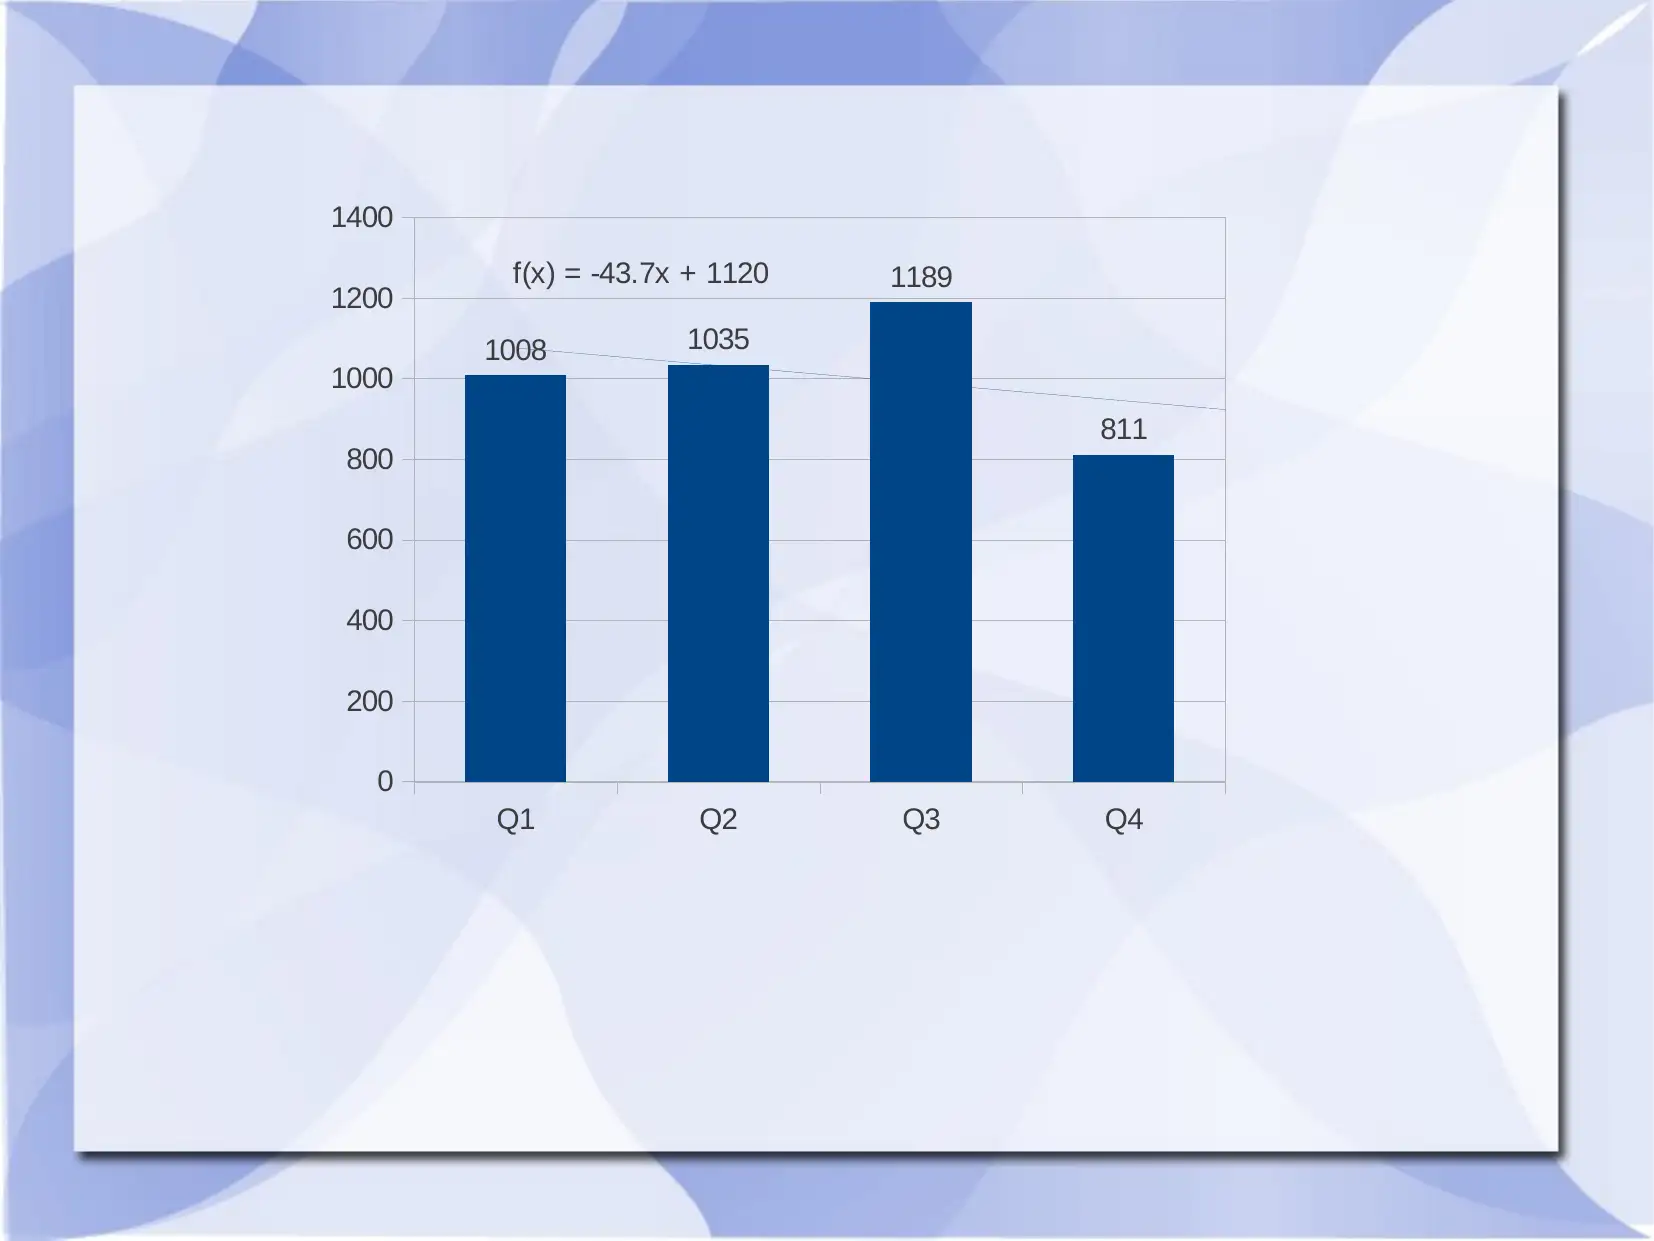
This report provides a quarterly trend analysis for business decision-making, presenting data from Q1 to Q4. It includes bar charts and line charts visualizing the trends, along with trend lines and corresponding equations. The analysis covers various metrics, offering insights into business performance over the four quarters. References to relevant academic articles are included, highlighting methodologies and applications in data analysis and project management. Desklib offers a platform to access similar solved assignments and study resources.
Document Page
BUSINESS DECISION MAKING
tabler-icon-diamond-filled.svg

Secure Best Marks with AI Grader

Need help grading? Try our AI Grader for instant feedback on your assignments.
Document Page
957
997
1163
769
Document Page
1008
1035
1189
811
Document Page
Bar chart
Q1
Q2
Q3
Q4
0 200 400 600 800 1000 1200
931
959
1104
713
tabler-icon-diamond-filled.svg

Secure Best Marks with AI Grader

Need help grading? Try our AI Grader for instant feedback on your assignments.
Document Page
Q1
Q2
Q3
Q4
0 200 400 600 800 1000 1200 1400
957
997
1163
769
Document Page
Q1
Q2
Q3
Q4
0 200 400 600 800 1000 1200 1400
1008
1035
1189
811
Document Page
Line Chart
Q1 Q2 Q3 Q4
0
200
400
600
800
1000
1200
931 959
1104
713
tabler-icon-diamond-filled.svg

Paraphrase This Document

Need a fresh take? Get an instant paraphrase of this document with our AI Paraphraser
Document Page
Q1 Q2 Q3 Q4
0
200
400
600
800
1000
1200
1400
957 997
1163
769
Document Page
Q1 Q2 Q3 Q4
0
200
400
600
800
1000
1200
1400
1008 1035
1189
811
Document Page
Trend Line
Q1 Q2 Q3 Q4
0
200
400
600
800
1000
1200
931 959
1104
713
f(x) = -50.9x + 1054
tabler-icon-diamond-filled.svg

Secure Best Marks with AI Grader

Need help grading? Try our AI Grader for instant feedback on your assignments.
Document Page
Q1 Q2 Q3 Q4
0
200
400
600
800
1000
1200
1400
957 997
1163
769
f(x) = -39.8x + 1071
Document Page
Q1 Q2 Q3 Q4
0
200
400
600
800
1000
1200
1400
1008 1035
1189
811
f(x) = -43.7x + 1120
Document Page
REFERENCES
Brooks, J. P., Dula, J. H. and Boone, E. L., 2013. A pure L1-norm principal
component analysis. Computational statistics & data analysis. 61. pp.83-98.
Golbraikh, A. and et.al., 2014. Data set modelability by QSAR. Journal of
chemical information and modeling. 54(1). pp.1-4.
Haq, A., Brown, J. and Moltchanova, E., 2014. New exponentially weighted
moving average control charts for monitoring process dispersion. Quality and
Reliability Engineering International. 30(8). pp.1311-1332.
Mir, F. A. and Pinnington, A. H., 2014. Exploring the value of project
management: linking project management performance and project success.
International Journal of Project Management. 32(2). pp.202-217.
tabler-icon-diamond-filled.svg

Paraphrase This Document

Need a fresh take? Get an instant paraphrase of this document with our AI Paraphraser
Document Page
THANK YOU
chevron_up_icon
1 out of 14
circle_padding
hide_on_mobile
zoom_out_icon
logo.png

Your All-in-One AI-Powered Toolkit for Academic Success.

Available 24*7 on WhatsApp / Email

[object Object]