Business Decision Making: Opening a New Branch of Balti Palace Report
VerifiedAdded on 2020/09/17
|24
|4117
|36
Report
AI Summary
This report presents a comprehensive analysis for Balti Palace, a London-based restaurant, regarding the opening of a new branch. It begins with a detailed data gathering plan, outlining primary and secondary research methods, followed by the design of a survey questionnaire and the methodology used for sampling. The report then delves into data analysis, employing representative values, measures of dispersion, and correlation techniques to derive meaningful conclusions. Statistical tools are used to analyze sales and profit data, alongside the interpretation of survey results to identify consumer preferences and trends. Furthermore, the report integrates graphical representations using MS Spreadsheet, including trend lines for forecasting and prepares a business presentation and formal business report. Finally, the report uses information processing tools, project planning, and financial tools to support the decision-making process, culminating in a conclusion that provides recommendations for Balti Palace's expansion strategy.

BUSINESS DECISION MAKING
(Opening a new branch of Balti Palace)
(Opening a new branch of Balti Palace)
Paraphrase This Document
Need a fresh take? Get an instant paraphrase of this document with our AI Paraphraser
Table of Contents
INTRODUCTION...........................................................................................................................1
TASK 1............................................................................................................................................1
1.1 Data gathering plan................................................................................................................1
1.2 Survey methodology and sampling frame.............................................................................2
1.3 Questionnaire.........................................................................................................................2
TASK 2............................................................................................................................................5
2.1 Creating information for decision-making purpose using representative values...................5
2.2 Analyzing the results to draw valid conclusion...................................................................10
2.3 Analyzing the results using dispersion.................................................................................10
2.4 Quartile, percentile and correlation to derive conclusion....................................................11
TASK 3..........................................................................................................................................13
3.1 Graphs in MS Spreadsheet and draw useful conclusion based on information...................13
3.2 Trend lines in Spreadsheet graphs to assist forecasting.......................................................16
3.3 Preparing business presentation to disseminate information...............................................17
3.4 Formal business report.........................................................................................................17
TASK 4..........................................................................................................................................17
4.1 Appropriate information processing tool.............................................................................17
4.2 Prepare project plan for an activity and its critical path......................................................18
4.3 Using financial tools for decision-making...........................................................................18
CONCLUSION..............................................................................................................................21
REFERENCES..............................................................................................................................22
1 | P a g e
INTRODUCTION
In past few years, British restaurant sector undergone significant changes with the rising
consumer spending, competition level and other factors. Despite immense competition facing by
the restaurant operators, the market is still expected to grow and reach to the value of GBP20bn
or above @ 4% annual growth rate (Mullan, 2017). Balti Palace is one of the successful and
pioneering restaurant of London who is serving customers with the quality cuisine, exciting
place, modern surroundings and others. Its Eastern influence satisfy all the appetite through
quality and healthiest food choices in traditional flavors. Looking to wonderful growth, it is keen
to invest in one more restaurant in London. Thus, the study creates data collection plan, conduct
an original survey and analyze the results using distinctive statistical methods. Moreover,
charting will be used to graphically present its own sales & profit performance. In addition,
financial tools and MS project management will be usedfor business decision.
TASK 1
1.1 Data gathering plan
Data collection is a key requirement for Balti Palace before setting a new branch at any
other location in London. In order to protect reliability and credibility, it must obtain necessary
set of data using acceptable data collection techniques. Research can be defined as a scientific
investigation to discover the hidden facts about the chosen problem. As Balti Palace is going to
invest in a new restaurant unit, thus, data can be collect from following sources:
Primary research: Investigation carried out by researcher to collect fresh dataset
targeting specific need is called primary research. To know consumer thinking, perspective for
restaurant, their desirable cuisine, infrastructure and others, Balti Palace can take interview and
survey selected people (Pickard, 2012). No-doubt, it seems bit difficult to conduct a real survey
as it requires resources, time and money because it starts from scratch, still credibility and
reliability is high.
Secondary research: Unlike above, it is just about using available data that was earlier
gathered by primary research by any other scholar. Governmental association report, newsletters,
1 | P a g e
⊘ This is a preview!⊘
Do you want full access?
Subscribe today to unlock all pages.
Trusted by 1+ million students worldwide
journal, encyclopedia, journals are the basic and readily available sources. Balti Palace can
assess their current status using sales and profitability outcome. Moreover, web resources would
be access to know restaurant industry growth, level of consumer spending and its future outlook.
1.2 Survey methodology and sampling frame
The essence of survey methodology can be defined as a way of questioning target
individuals on a selected topic and then drawing useful inferences from their responses gathered.
Survey will be the best method for Balti Palace to reflect people attitude towards restaurant
concept, segmentation, their desires, level of satisfaction and other success determinable factors
(Pickard, 2012). Mail survey, Telephonic survey, personalized interview are several survey
methods. Here, it is decided to conduct an online mail survey of the target people that will be
self-administered. It will be done through questionnaire to extract useful information within a
short time period. It is cheaper than any other source of primary data collection and selected
individuals can also remain anonymous.
As, Balti Palace is a large Indian cuisine who strongly appeal customers, thus, the
restaurant has a great customer base. Therefore, it seems important to choose some group of
people among all for the sample selection. It will survey only the chosen individuals but they
must represent the entire universe, therefore, random sampling seems appropriate which
withdraw some members randomly without any choices or preferences (West, 2016).
Considering its large base, it is decided to choose 100 regular customers of Balti Palace, all will
be surveyed only after their voluntary acceptance that assure information credibility, reliability &
authenticity.
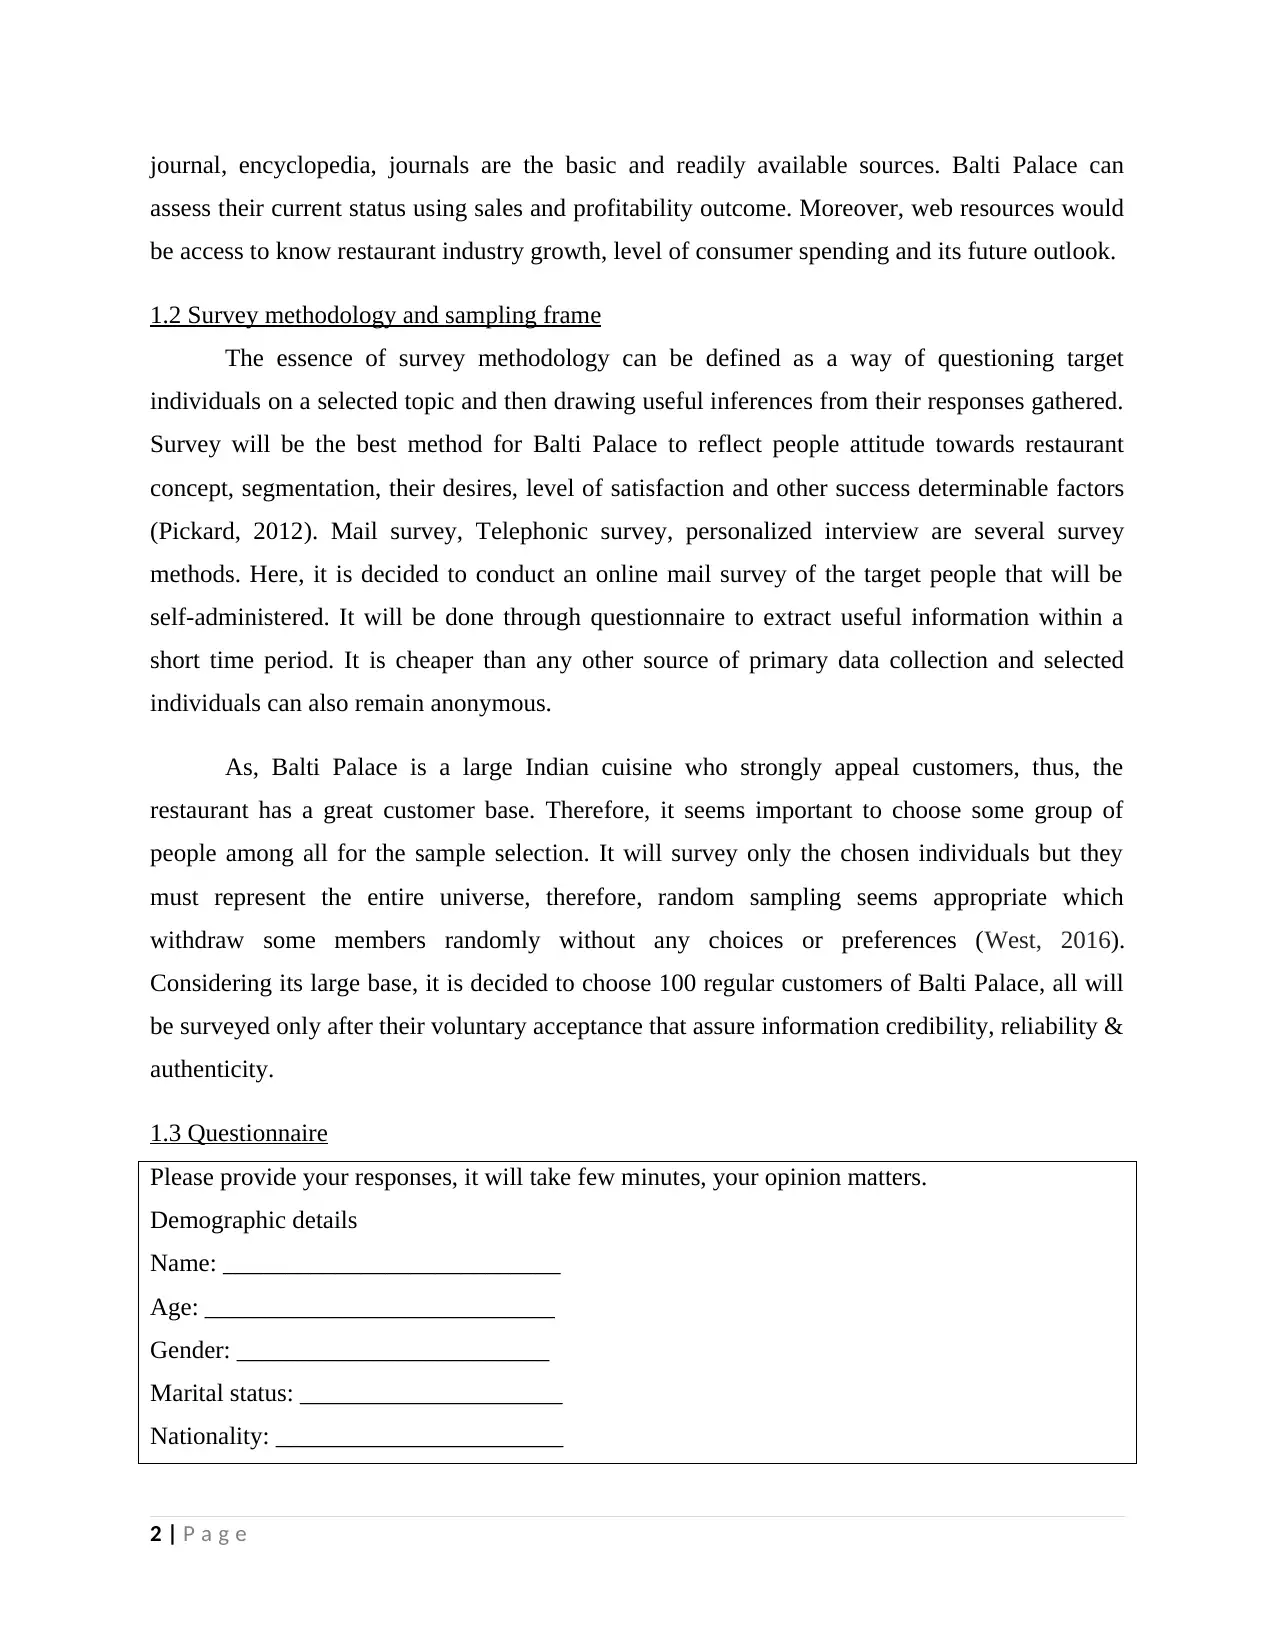
1.3 Questionnaire
Please provide your responses, it will take few minutes, your opinion matters.
Demographic details
Name: ___________________________
Age: ____________________________
Gender: _________________________
Marital status: _____________________
Nationality: _______________________
2 | P a g e
assess their current status using sales and profitability outcome. Moreover, web resources would
be access to know restaurant industry growth, level of consumer spending and its future outlook.
1.2 Survey methodology and sampling frame
The essence of survey methodology can be defined as a way of questioning target
individuals on a selected topic and then drawing useful inferences from their responses gathered.
Survey will be the best method for Balti Palace to reflect people attitude towards restaurant
concept, segmentation, their desires, level of satisfaction and other success determinable factors
(Pickard, 2012). Mail survey, Telephonic survey, personalized interview are several survey
methods. Here, it is decided to conduct an online mail survey of the target people that will be
self-administered. It will be done through questionnaire to extract useful information within a
short time period. It is cheaper than any other source of primary data collection and selected
individuals can also remain anonymous.
As, Balti Palace is a large Indian cuisine who strongly appeal customers, thus, the
restaurant has a great customer base. Therefore, it seems important to choose some group of
people among all for the sample selection. It will survey only the chosen individuals but they
must represent the entire universe, therefore, random sampling seems appropriate which
withdraw some members randomly without any choices or preferences (West, 2016).
Considering its large base, it is decided to choose 100 regular customers of Balti Palace, all will
be surveyed only after their voluntary acceptance that assure information credibility, reliability &
authenticity.
1.3 Questionnaire
Please provide your responses, it will take few minutes, your opinion matters.
Demographic details
Name: ___________________________
Age: ____________________________
Gender: _________________________
Marital status: _____________________
Nationality: _______________________
2 | P a g e
Paraphrase This Document
Need a fresh take? Get an instant paraphrase of this document with our AI Paraphraser
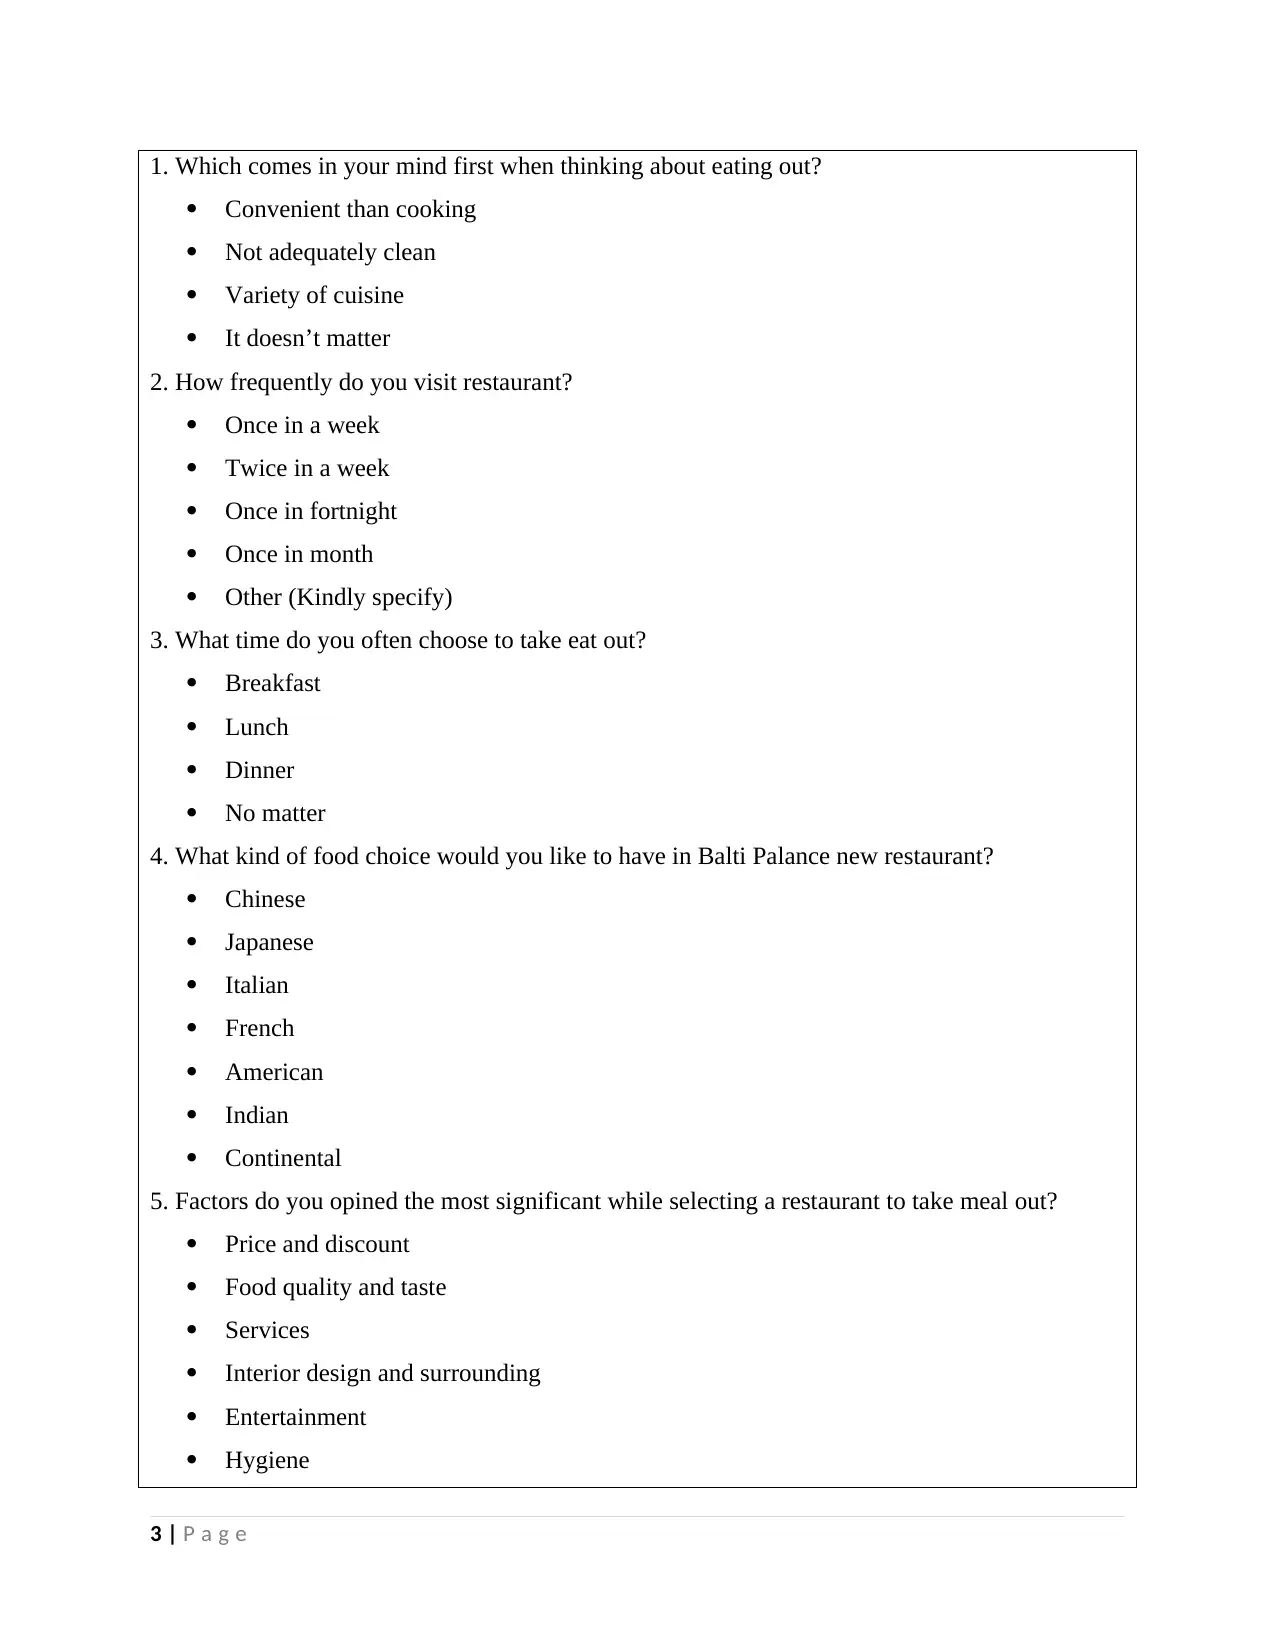
1. Which comes in your mind first when thinking about eating out?
Convenient than cooking
Not adequately clean
Variety of cuisine
It doesn’t matter
2. How frequently do you visit restaurant?
Once in a week
Twice in a week
Once in fortnight
Once in month
Other (Kindly specify)
3. What time do you often choose to take eat out?
Breakfast
Lunch
Dinner
No matter
4. What kind of food choice would you like to have in Balti Palance new restaurant?
Chinese
Japanese
Italian
French
American
Indian
Continental
5. Factors do you opined the most significant while selecting a restaurant to take meal out?
Price and discount
Food quality and taste
Services
Interior design and surrounding
Entertainment
Hygiene
3 | P a g e
6. When you thinks about convenience, which one you seem highly important over others?
Distances to the restaurant
Free of cost delivery
Take-away facilities
Online and telephonic ordering
7. Your preferable architectural style that you like the most?
Modern
Baroque
Romantic
Gothic
Traditional
Other
8. Which kind of extra facilities for entertainment do you expects?
Live soft music
Pop music
Drinking bar
Jazz & lounge
Others (Specify)
9. Which of the below medium do you inform yourself about any restaurant?
Leaflet
Friend recommendations
Internet
TV advertisement
Social media
Others
10. How much cost would you ready to pay for the meal?
Less than £50
£50 - £100
£100-£150
£150-£200
£200-£250
4 | P a g e
⊘ This is a preview!⊘
Do you want full access?
Subscribe today to unlock all pages.
Trusted by 1+ million students worldwide
More than £250
11. What type of dining rooms do you expects from us in our new restaurant unit?
Private
Relaxed
Formal
Casual
12. Give us your suggestions: ________________________________________________
TASK 2
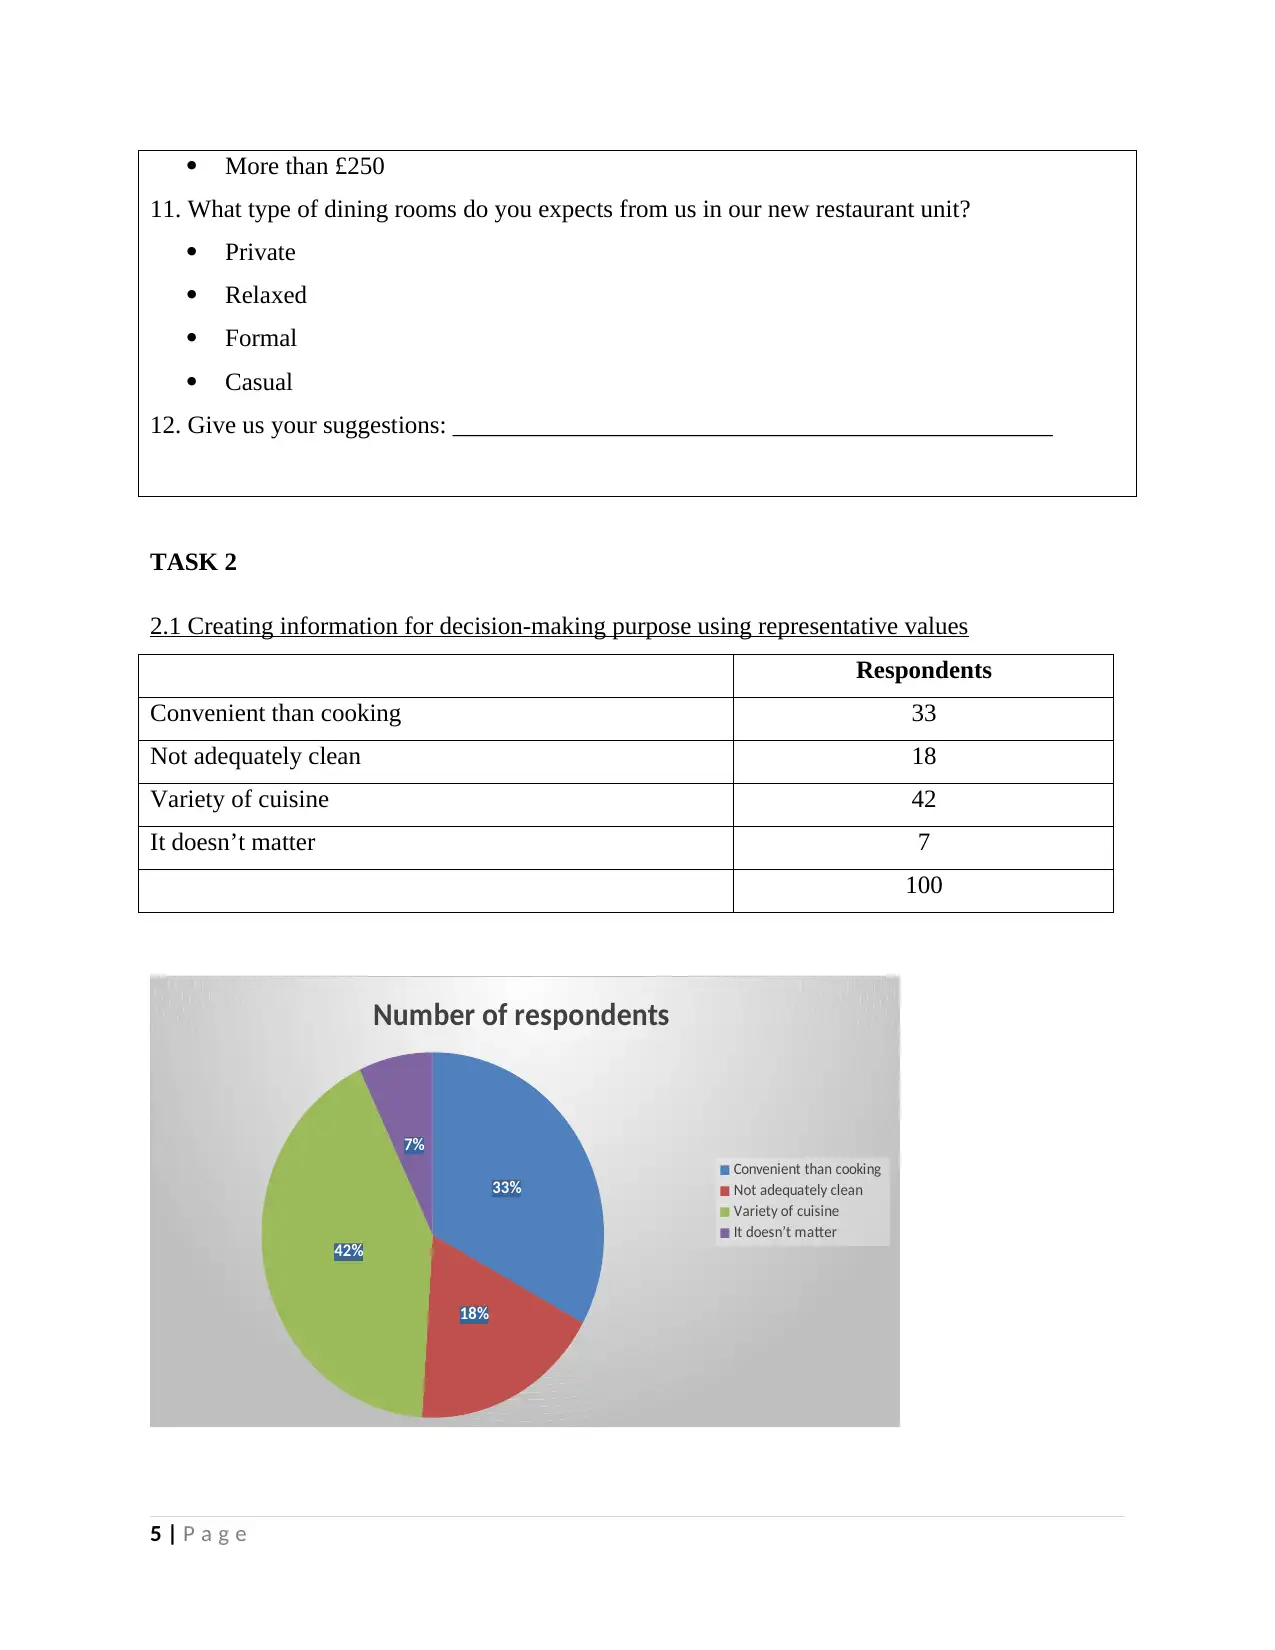
2.1 Creating information for decision-making purpose using representative values
Respondents
Convenient than cooking 33
Not adequately clean 18
Variety of cuisine 42
It doesn’t matter 7
100
33%
18%
42%
7%
Number of respondents
Convenient than cooking
Not adequately clean
Variety of cuisine
It doesn’t matter
5 | P a g e
11. What type of dining rooms do you expects from us in our new restaurant unit?
Private
Relaxed
Formal
Casual
12. Give us your suggestions: ________________________________________________
TASK 2
2.1 Creating information for decision-making purpose using representative values
Respondents
Convenient than cooking 33
Not adequately clean 18
Variety of cuisine 42
It doesn’t matter 7
100
33%
18%
42%
7%
Number of respondents
Convenient than cooking
Not adequately clean
Variety of cuisine
It doesn’t matter
5 | P a g e
Paraphrase This Document
Need a fresh take? Get an instant paraphrase of this document with our AI Paraphraser
Interpretation: Variety of cuisine at the single place is the main thought comes in the
mind of maximum target individuals (42%) when they thinks about any restaurant to take meal
out. Thus, it satisfy their different food choices and meet their expectations. However, 33%
people thinks about convenience instead of cooking as they get prepared food at their ordered
place (Bartels and et.al., 2015)
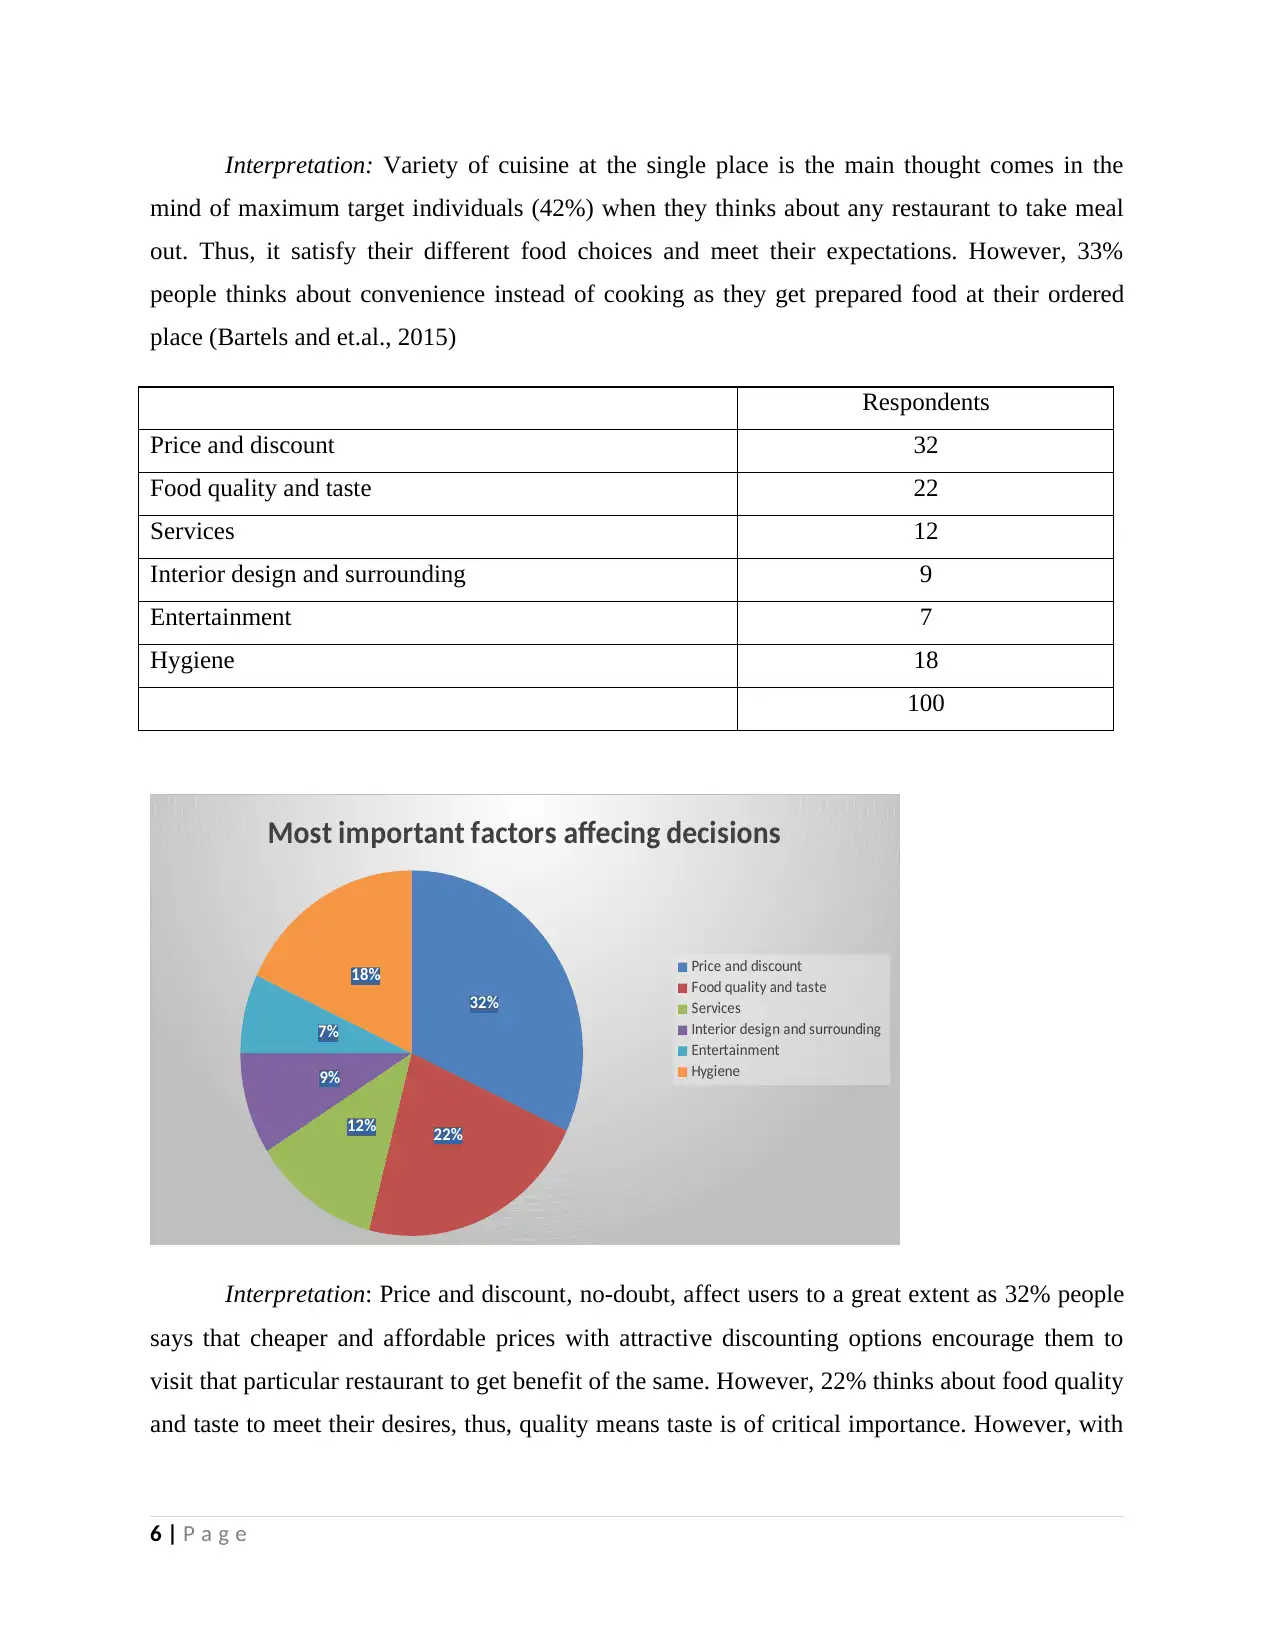
Respondents
Price and discount 32
Food quality and taste 22
Services 12
Interior design and surrounding 9
Entertainment 7
Hygiene 18
100
32%
22%12%
9%
7%
18%
Most important factors affecing decisions
Price and discount
Food quality and taste
Services
Interior design and surrounding
Entertainment
Hygiene
Interpretation: Price and discount, no-doubt, affect users to a great extent as 32% people
says that cheaper and affordable prices with attractive discounting options encourage them to
visit that particular restaurant to get benefit of the same. However, 22% thinks about food quality
and taste to meet their desires, thus, quality means taste is of critical importance. However, with
6 | P a g e
mind of maximum target individuals (42%) when they thinks about any restaurant to take meal
out. Thus, it satisfy their different food choices and meet their expectations. However, 33%
people thinks about convenience instead of cooking as they get prepared food at their ordered
place (Bartels and et.al., 2015)
Respondents
Price and discount 32
Food quality and taste 22
Services 12
Interior design and surrounding 9
Entertainment 7
Hygiene 18
100
32%
22%12%
9%
7%
18%
Most important factors affecing decisions
Price and discount
Food quality and taste
Services
Interior design and surrounding
Entertainment
Hygiene
Interpretation: Price and discount, no-doubt, affect users to a great extent as 32% people
says that cheaper and affordable prices with attractive discounting options encourage them to
visit that particular restaurant to get benefit of the same. However, 22% thinks about food quality
and taste to meet their desires, thus, quality means taste is of critical importance. However, with
6 | P a g e
the changing period, people, now-a-days, prefer hygiene too with the quality to get nutritious and
healthier food as 18% people preferred the same.
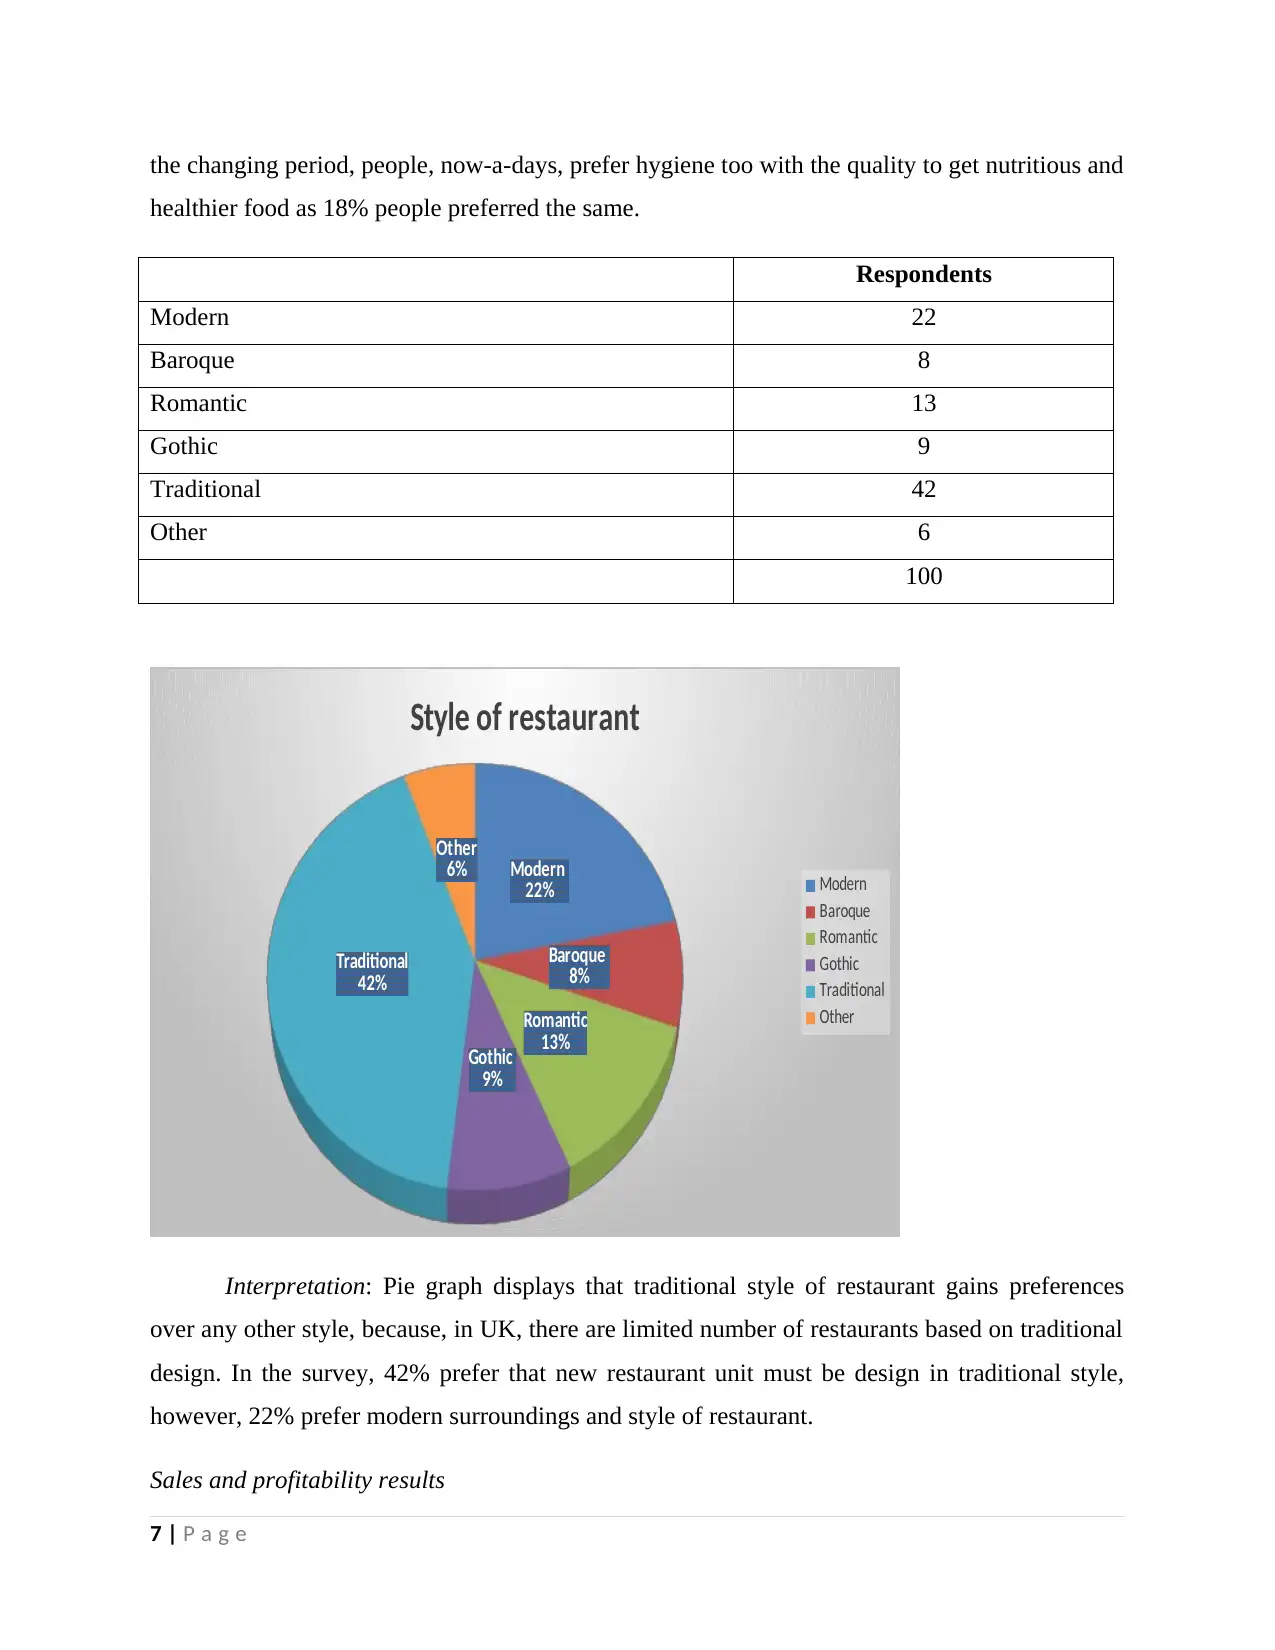
Respondents
Modern 22
Baroque 8
Romantic 13
Gothic 9
Traditional 42
Other 6
100
Modern
22%
Baroque
8%
Romantic
13%
Gothic
9%
Traditional
42%
Other
6%
Style of restaurant
Modern
Baroque
Romantic
Gothic
Traditional
Other
Interpretation: Pie graph displays that traditional style of restaurant gains preferences
over any other style, because, in UK, there are limited number of restaurants based on traditional
design. In the survey, 42% prefer that new restaurant unit must be design in traditional style,
however, 22% prefer modern surroundings and style of restaurant.
Sales and profitability results
7 | P a g e
healthier food as 18% people preferred the same.
Respondents
Modern 22
Baroque 8
Romantic 13
Gothic 9
Traditional 42
Other 6
100
Modern
22%
Baroque
8%
Romantic
13%
Gothic
9%
Traditional
42%
Other
6%
Style of restaurant
Modern
Baroque
Romantic
Gothic
Traditional
Other
Interpretation: Pie graph displays that traditional style of restaurant gains preferences
over any other style, because, in UK, there are limited number of restaurants based on traditional
design. In the survey, 42% prefer that new restaurant unit must be design in traditional style,
however, 22% prefer modern surroundings and style of restaurant.
Sales and profitability results
7 | P a g e
⊘ This is a preview!⊘
Do you want full access?
Subscribe today to unlock all pages.
Trusted by 1+ million students worldwide
Year Sales/turnover Net profit
2008 2645 104
2009 2680 128
2010 2470 134
2011 2645 178
2012 2830 226
2013 2600 260
2014 2780 360
2015 3240 470
2016 3560 415
2017 4060 378
29510 2653.00
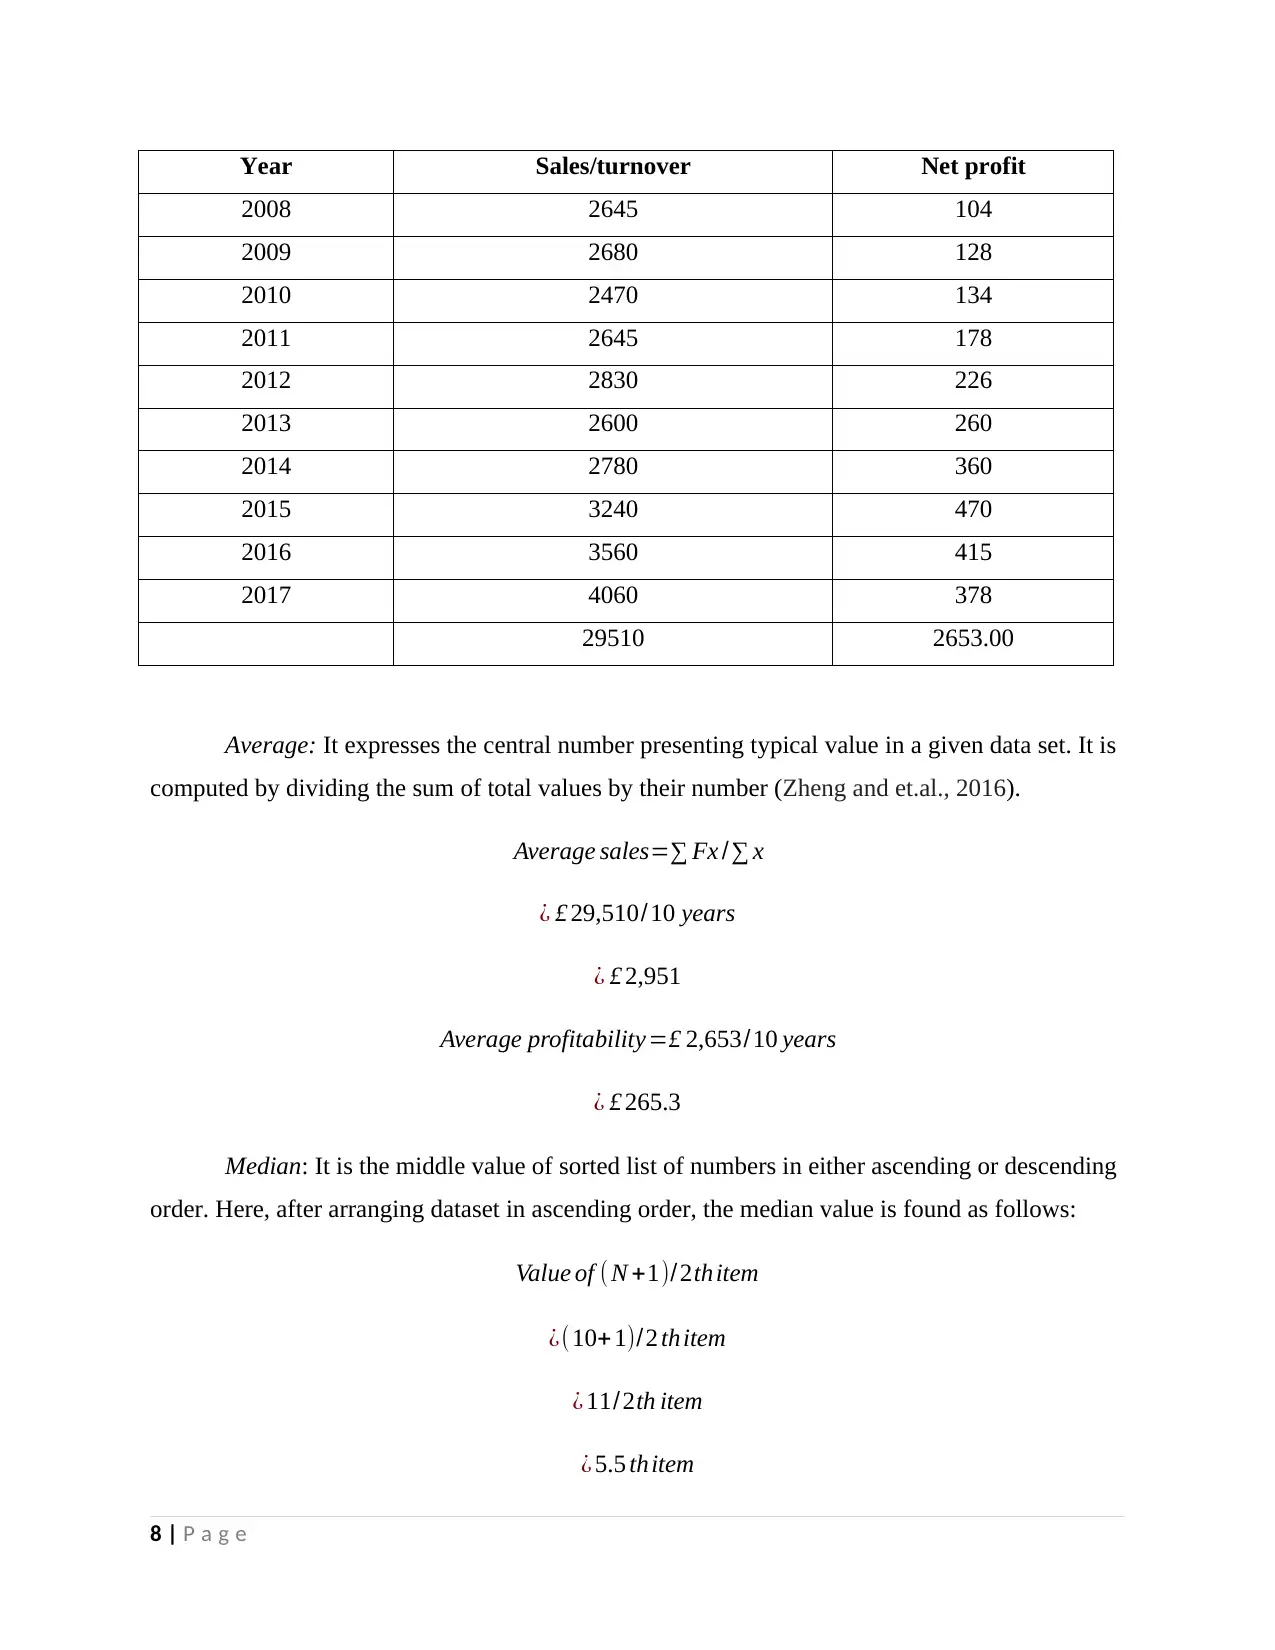
Average: It expresses the central number presenting typical value in a given data set. It is
computed by dividing the sum of total values by their number (Zheng and et.al., 2016).
Average sales=∑ Fx /∑ x
¿ £ 29,510/ 10 years
¿ £ 2,951
Average profitability=£ 2,653/10 years
¿ £ 265.3
Median: It is the middle value of sorted list of numbers in either ascending or descending
order. Here, after arranging dataset in ascending order, the median value is found as follows:
Value of ( N +1)/2thitem
¿(10+ 1)/2 th item
¿ 11/2th item
¿ 5.5 thitem
8 | P a g e
2008 2645 104
2009 2680 128
2010 2470 134
2011 2645 178
2012 2830 226
2013 2600 260
2014 2780 360
2015 3240 470
2016 3560 415
2017 4060 378
29510 2653.00
Average: It expresses the central number presenting typical value in a given data set. It is
computed by dividing the sum of total values by their number (Zheng and et.al., 2016).
Average sales=∑ Fx /∑ x
¿ £ 29,510/ 10 years
¿ £ 2,951
Average profitability=£ 2,653/10 years
¿ £ 265.3
Median: It is the middle value of sorted list of numbers in either ascending or descending
order. Here, after arranging dataset in ascending order, the median value is found as follows:
Value of ( N +1)/2thitem
¿(10+ 1)/2 th item
¿ 11/2th item
¿ 5.5 thitem
8 | P a g e
Paraphrase This Document
Need a fresh take? Get an instant paraphrase of this document with our AI Paraphraser
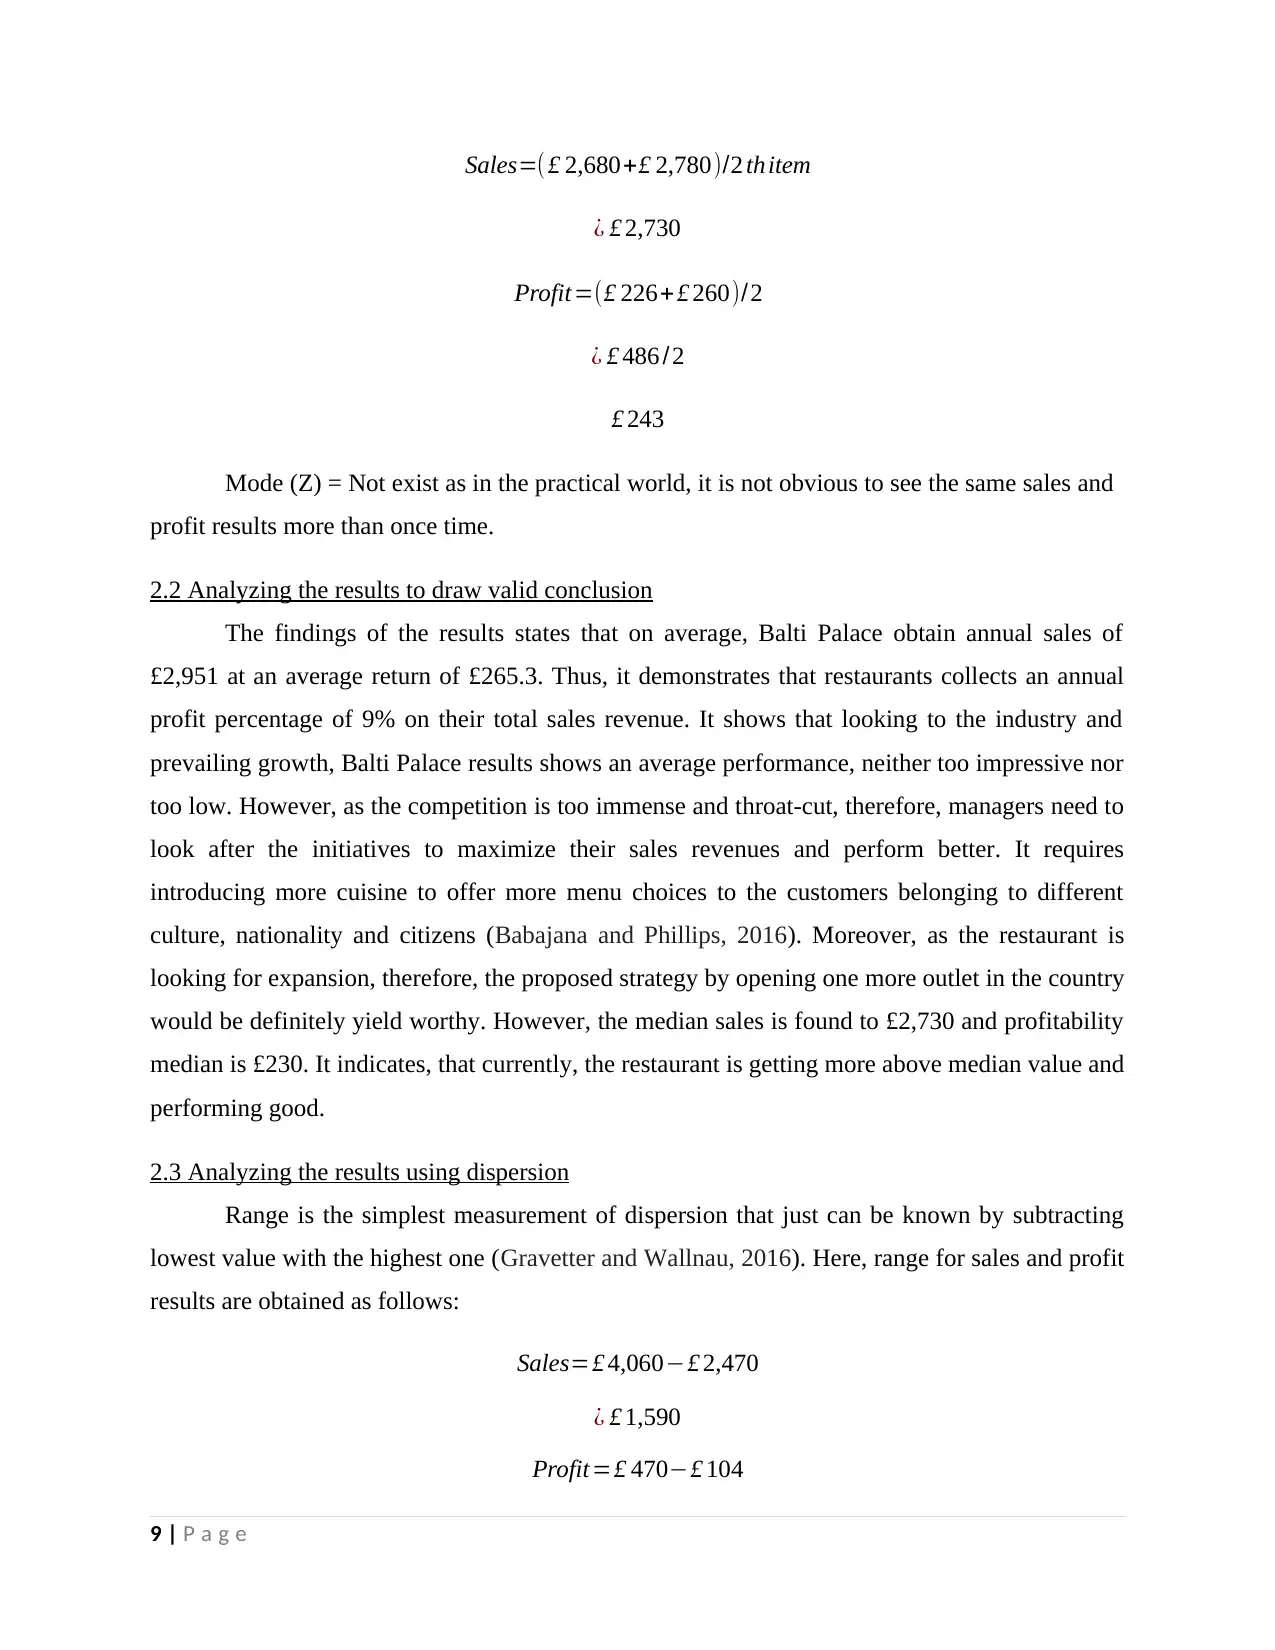
Sales=( £ 2,680+£ 2,780)/2 th item
¿ £ 2,730
Profit=(£ 226+ £ 260)/2
¿ £ 486 /2
£ 243
Mode (Z) = Not exist as in the practical world, it is not obvious to see the same sales and
profit results more than once time.
2.2 Analyzing the results to draw valid conclusion
The findings of the results states that on average, Balti Palace obtain annual sales of
£2,951 at an average return of £265.3. Thus, it demonstrates that restaurants collects an annual
profit percentage of 9% on their total sales revenue. It shows that looking to the industry and
prevailing growth, Balti Palace results shows an average performance, neither too impressive nor
too low. However, as the competition is too immense and throat-cut, therefore, managers need to
look after the initiatives to maximize their sales revenues and perform better. It requires
introducing more cuisine to offer more menu choices to the customers belonging to different
culture, nationality and citizens (Babajana and Phillips, 2016). Moreover, as the restaurant is
looking for expansion, therefore, the proposed strategy by opening one more outlet in the country
would be definitely yield worthy. However, the median sales is found to £2,730 and profitability
median is £230. It indicates, that currently, the restaurant is getting more above median value and
performing good.
2.3 Analyzing the results using dispersion
Range is the simplest measurement of dispersion that just can be known by subtracting
lowest value with the highest one (Gravetter and Wallnau, 2016). Here, range for sales and profit
results are obtained as follows:
Sales=£ 4,060−£ 2,470
¿ £ 1,590
Profit=£ 470−£ 104
9 | P a g e
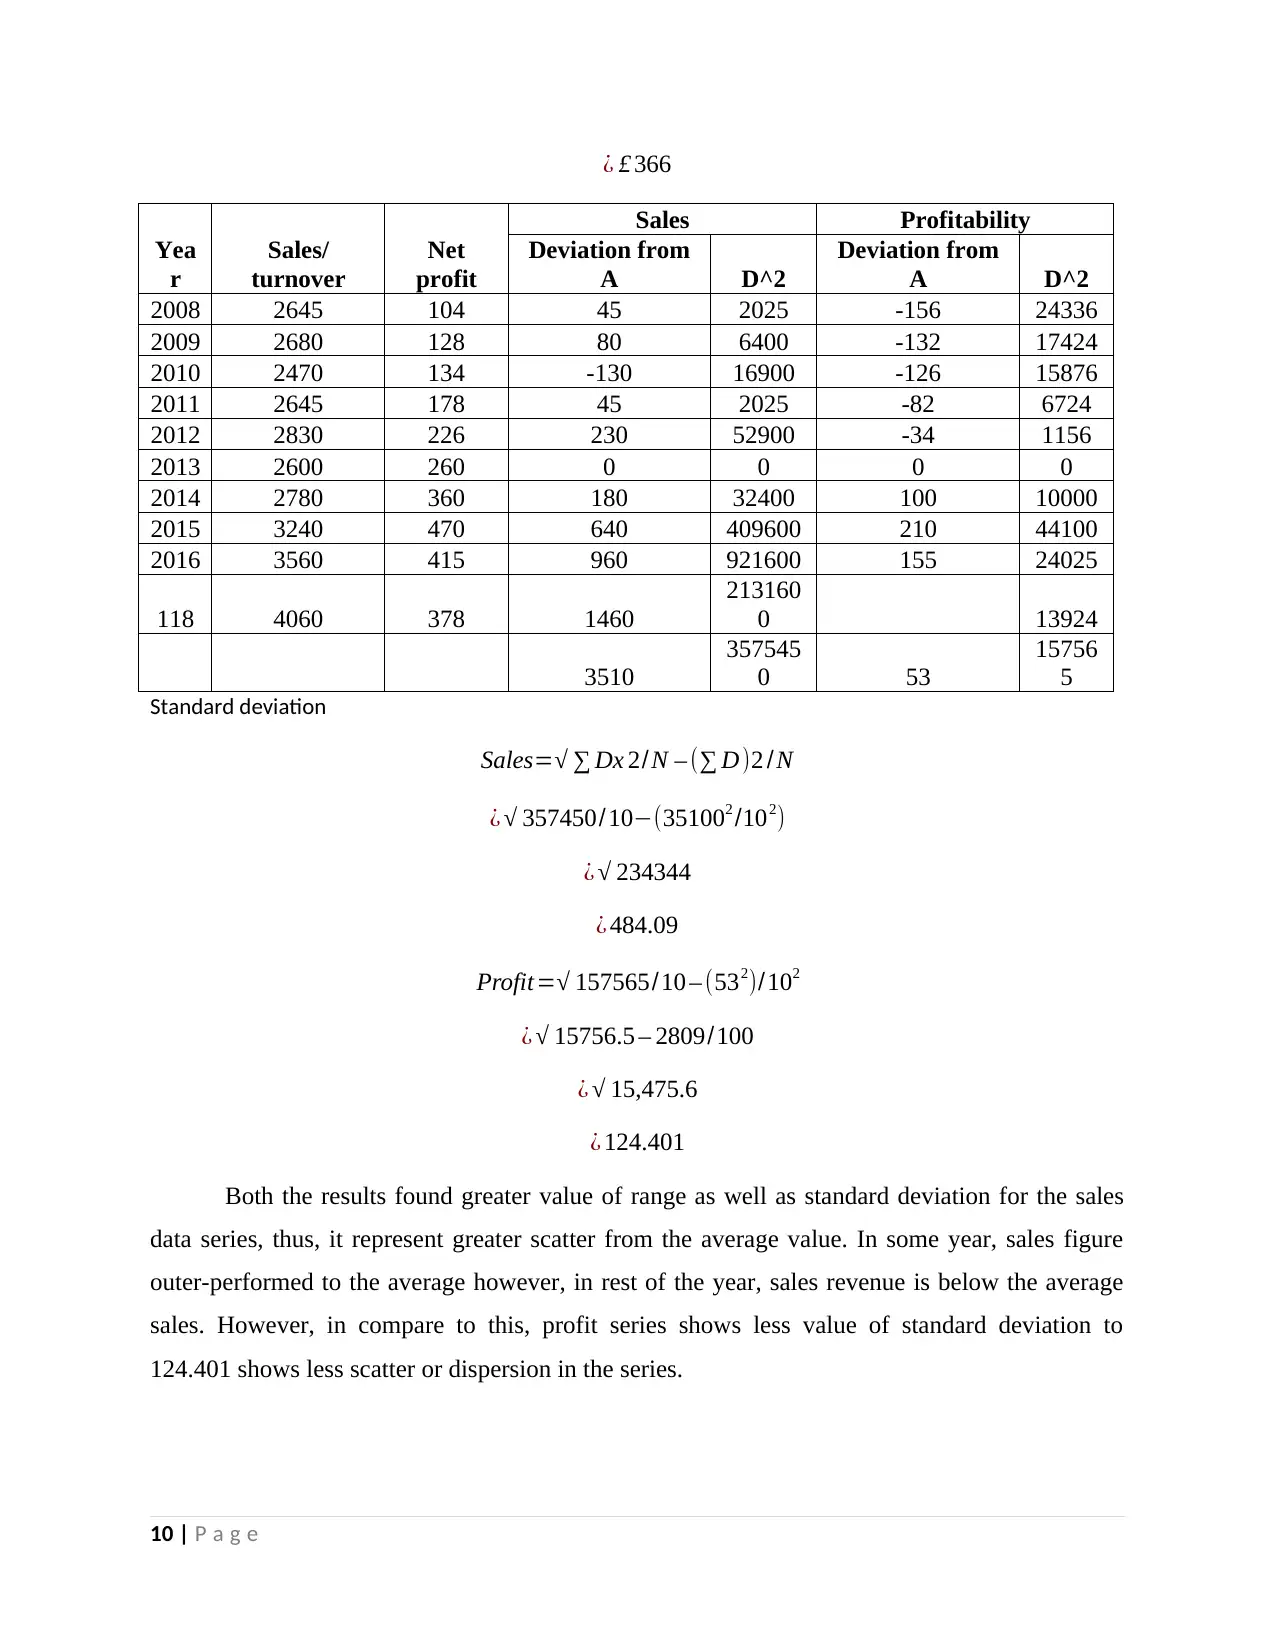
¿ £ 366
Yea
r
Sales/
turnover
Net
profit
Sales Profitability
Deviation from
A D^2
Deviation from
A D^2
2008 2645 104 45 2025 -156 24336
2009 2680 128 80 6400 -132 17424
2010 2470 134 -130 16900 -126 15876
2011 2645 178 45 2025 -82 6724
2012 2830 226 230 52900 -34 1156
2013 2600 260 0 0 0 0
2014 2780 360 180 32400 100 10000
2015 3240 470 640 409600 210 44100
2016 3560 415 960 921600 155 24025
118 4060 378 1460
213160
0 13924
3510
357545
0 53
15756
5
Standard deviation
Sales=√ ∑ Dx 2/N – (∑ D)2 /N
¿ √ 357450/10−(351002 /102)
¿ √ 234344
¿ 484.09
Profit=√ 157565/10 – (532)/102
¿ √ 15756.5 – 2809/100
¿ √ 15,475.6
¿ 124.401
Both the results found greater value of range as well as standard deviation for the sales
data series, thus, it represent greater scatter from the average value. In some year, sales figure
outer-performed to the average however, in rest of the year, sales revenue is below the average
sales. However, in compare to this, profit series shows less value of standard deviation to
124.401 shows less scatter or dispersion in the series.
10 | P a g e
⊘ This is a preview!⊘
Do you want full access?
Subscribe today to unlock all pages.
Trusted by 1+ million students worldwide
1 out of 24
Related Documents


Your All-in-One AI-Powered Toolkit for Academic Success.
+13062052269
info@desklib.com
Available 24*7 on WhatsApp / Email
![[object Object]](/_next/static/media/star-bottom.7253800d.svg)
Unlock your academic potential
Copyright © 2020–2026 A2Z Services. All Rights Reserved. Developed and managed by ZUCOL.