Business Decision Making Report: Financial Analysis and Tools
VerifiedAdded on 2019/12/03
|24
|5111
|264
Report
AI Summary
This report provides a detailed analysis of business decision-making, focusing on financial tools and their application. The report begins with an introduction to the importance of decision-making in the corporate world, emphasizing the need for data-driven insights. Task 1 explores the Crossrail project, its background, rationale, objectives, and methodology, including data collection methods such as questionnaires and secondary research. Task 2 delves into data analysis, covering mean, mode, median, range, and standard deviation, along with percentile calculations. Task 3 involves data visualization using line graphs, pie charts, bar charts, and scatter plots, as well as trend lines and a formal business report. Task 4 focuses on project management tools, including network diagrams, Gantt charts, and financial analysis through Net Present Value (NPV) and Internal Rate of Return (IRR) calculations. The report concludes with recommendations and a summary of the findings.

BUSINESS DECISION MAKING
Paraphrase This Document
Need a fresh take? Get an instant paraphrase of this document with our AI Paraphraser
TABLE OF CONTENTS
INTRODUCTION...........................................................................................................................1
TASK 1............................................................................................................................................1
1.1 Background............................................................................................................................1
1.1 Rationale................................................................................................................................1
1.1 Objective of Research............................................................................................................1
1.2 Methodology..........................................................................................................................2
1.2 Data Analysis section............................................................................................................2
1.2 Time Frame............................................................................................................................2
1.2 Budget....................................................................................................................................3
1.3 Questionnaire.........................................................................................................................3
TASK 2............................................................................................................................................5
2.1 & 2.2 Mean, Mode and Median.............................................................................................5
2.3 Range and Standard Deviation..............................................................................................7
2.4 25th Percentile (Lower iii..........25th Percentile (Lower Quartile) and 75th Percentile (Upper
Quartile) and use of Percentile....................................................................................................8
2.4 Calculate correlation coefficient using the additional information provided and discuss it
advantages to a business..............................................................................................................9
TASK 3..........................................................................................................................................10
3.1 & 4.1 Produce line graph.....................................................................................................10
Pie chart.....................................................................................................................................11
Bar charts...................................................................................................................................11
Scatter Plot on Advertising and Sales Costs..............................................................................12
3.2 & 4.1 Trend lines.................................................................................................................12
3.3 Covered in power point presentation...................................................................................14
3.4 Formal Business Report.......................................................................................................14
TASK 4..........................................................................................................................................16
4.2 Prepare a network diagram for activities using Microsoft Project......................................16
ii) Calculate Project Duration....................................................................................................16
iii) Clearly mark the Critical Path..............................................................................................16
iv) Prepare a Gantt chart and state the benefits of using it as a Project Management Tool......17
TASK 4 B......................................................................................................................................17
4.3 Calculation of Net present value and Internal rate of return...............................................17
Recommendation.......................................................................................................................20
CONCLUSION..............................................................................................................................20
REFERENCES..............................................................................................................................22
⊘ This is a preview!⊘
Do you want full access?
Subscribe today to unlock all pages.
Trusted by 1+ million students worldwide
INTRODUCTION
Looking at the present condition of corporate world, decision making is one of the major
aspects that managerial level people has to carry out in effective and suitable manner. Increasing
level of competition has force the managers to ensure that they make decision considering all the
facts and findings (Brennan and Perkins, 2012). Present research project focuses on evaluating
importance of different financial tools that are essential for understanding the trends and
environment and helping the course for the managers in making suitable and reliable decisions.
Further, different scenarios have been considered in order to enhance the knowledge of the
learners regarding making effective decisions in different situations.
TASK 1
1.1 Background
Decision making is crucial aspect for every business and it is the duty of senior managers
to make sure that they undertake suitable and smart decisions so that desired results and
outcomes can be generated. In the present study, Crossrail one of the Europe’s largest
construction project for improving the journey times across London. The main purpose of this
project is to improve the way people travel around the capital of UK. In this regard, investigator
focuses on indulging different means of collecting data so that adequate amount of information
can be collected and Government of UK can understand the significance of Crossrail project for
the local community.
1.1 Rationale
Rationale behind conducting this study is to evaluate and analyze the benefits of Crossrail
Project for the local people of London. However, in regard to government, it is planning to
enhance the traveling experience and making safer for the people to travel from one local place
to another. Thus, through the means of this study researcher will evaluate the significance of
cited project for both government of UK and local people of London.
1.1 Objective of Research
The main objective of research is to evaluate the significance and benefits of Crossrail
project for the local community of London. Following are the three main objective of the current
study that researcher focuses on achieving:
To examine the advantages of Crossrail project for the general public.
To evaluate the financial benefits of the project for the economy of London.
1
Paraphrase This Document
Need a fresh take? Get an instant paraphrase of this document with our AI Paraphraser
To analyze whether Crossrail project assist in maintaining overcrowding at railway
station.
1.2 Methodology
Considering the nature of present study, researcher has focused on gathering data through
the help of both qualitative and quantitative techniques. In order to collect primary data, survey
methodology has been selected in which sample size has been selected with help of purposive
sampling technique and on the basis of which 30 front line managers of the Crossrail project will
be given the questionnaire and open and close ended questions will be asked to them about the
Crossrail project. The main purpose of collecting primary data is that it will helps in gathering
the information regarding aim and objectives of the Crossrail project for the government,
Construction Company and local people of London. Furthermore, data collected by the means of
survey methodology will be used for quantitative analysis so that actual findings in terms of
numbers can be generated and suitable interpretation can be made (Cooper and Schindler, 2003).
On the other hand, secondary data helps in gathering wide range of information regarding the
selected project so that appropriate theoretical base can be made which helps in making suitable
and reliable decisions regarding the project. By the means of secondary data, researcher can
evaluate different aspects of the project such as general information about the project which is
crucial in terms of understanding the significance of Crossrail project for the local people.
1.2 Data Analysis section
According to present given scenario, researcher will use qualitative analysis method for
analyzing the collected data. However, in this investigator will use graphical presentation to
present the data in effective manner as well as suitable for the learners or readers to understand
the findings (Audi, 2012). The main purpose behind using qualitative method of analyzing the
data is that it will assist researcher in understanding each and every aspect about the Crossrail
project. Furthermore, through data analysis section researcher will able to evaluate whether
Crossrail project is beneficial for the local community of London or not.
1.2 Time Frame
Looking at the nature of present study, it is important for the investigator to make in-
depth analysis. However, for making accurate and correct research, time factor is one of the most
significant factor considered (Fassin, Rossem, and Buelens, 2011). Hence, to maintain the
validity and reliability of the project, researcher should take adequate amount of time for
2
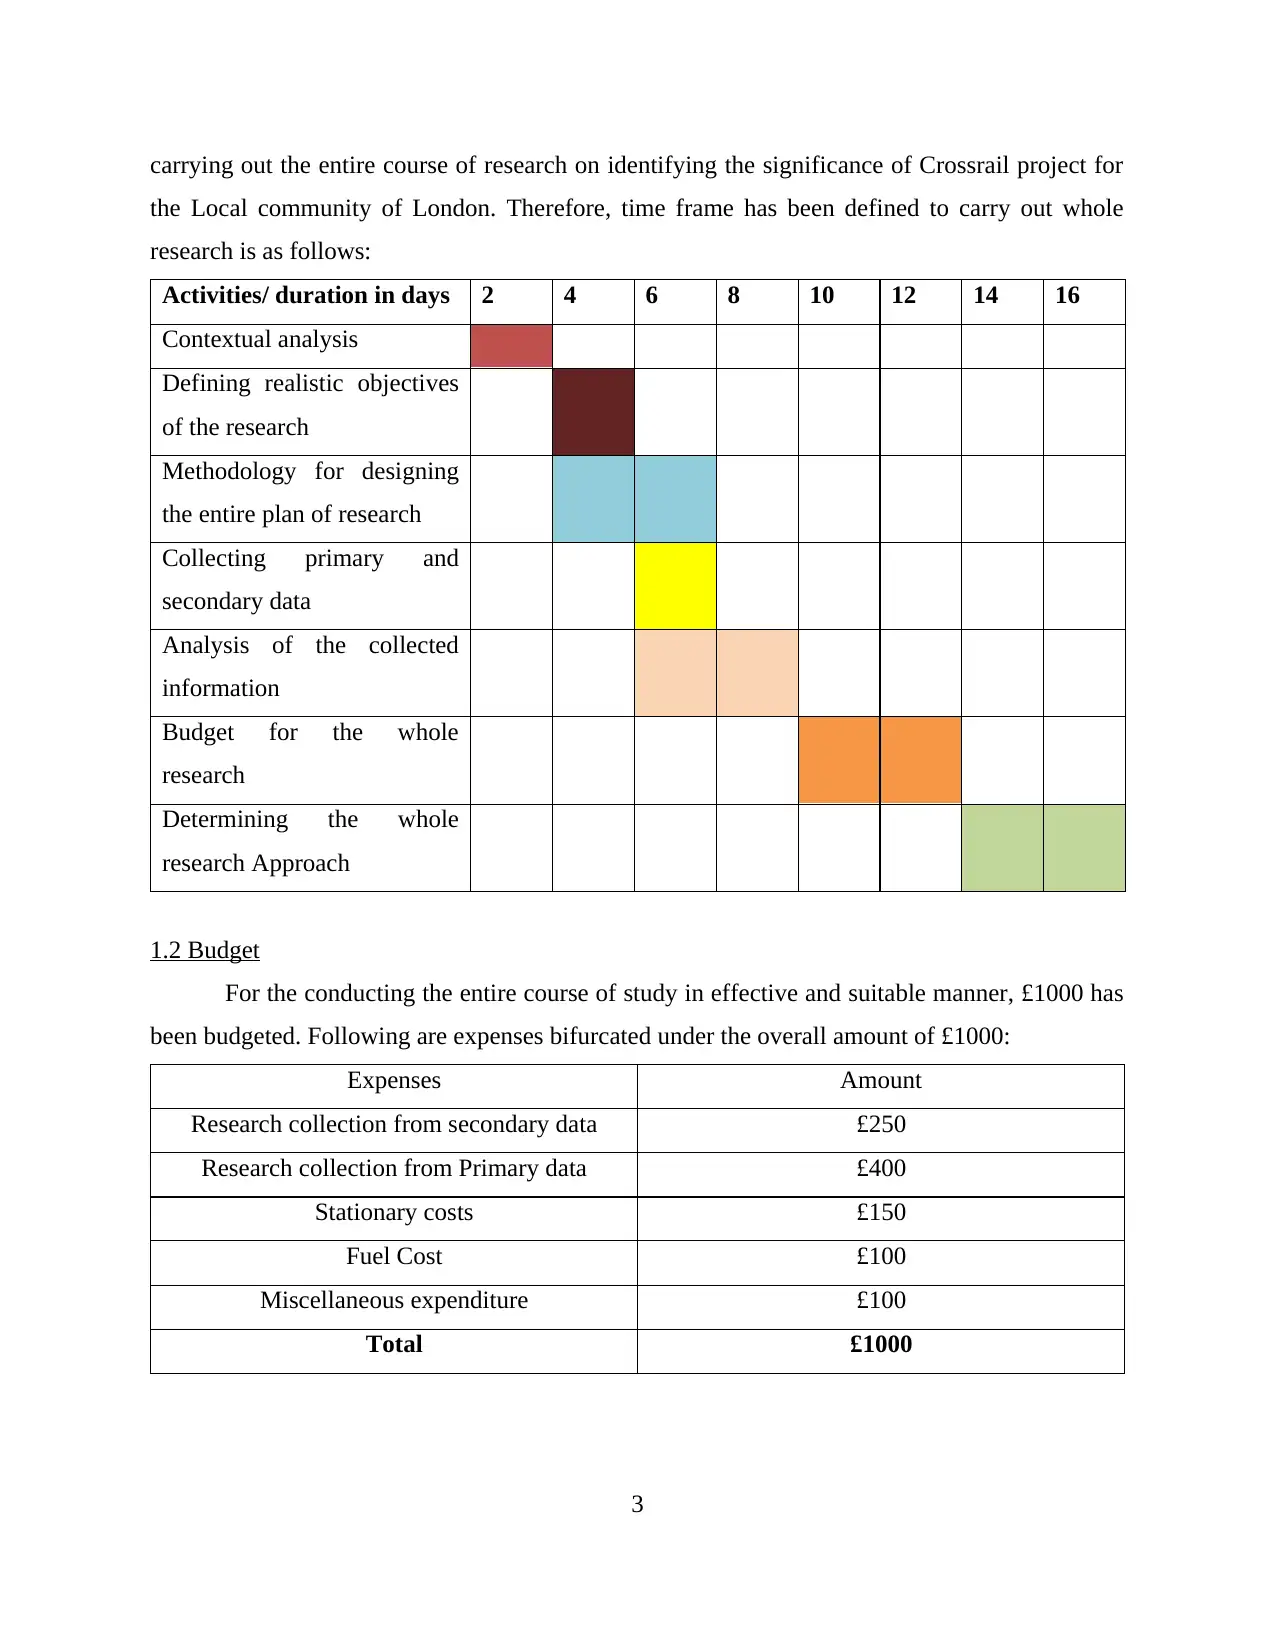
carrying out the entire course of research on identifying the significance of Crossrail project for
the Local community of London. Therefore, time frame has been defined to carry out whole
research is as follows:
Activities/ duration in days 2 4 6 8 10 12 14 16
Contextual analysis
Defining realistic objectives
of the research
Methodology for designing
the entire plan of research
Collecting primary and
secondary data
Analysis of the collected
information
Budget for the whole
research
Determining the whole
research Approach
1.2 Budget
For the conducting the entire course of study in effective and suitable manner, £1000 has
been budgeted. Following are expenses bifurcated under the overall amount of £1000:
Expenses Amount
Research collection from secondary data £250
Research collection from Primary data £400
Stationary costs £150
Fuel Cost £100
Miscellaneous expenditure £100
Total £1000
3
⊘ This is a preview!⊘
Do you want full access?
Subscribe today to unlock all pages.
Trusted by 1+ million students worldwide
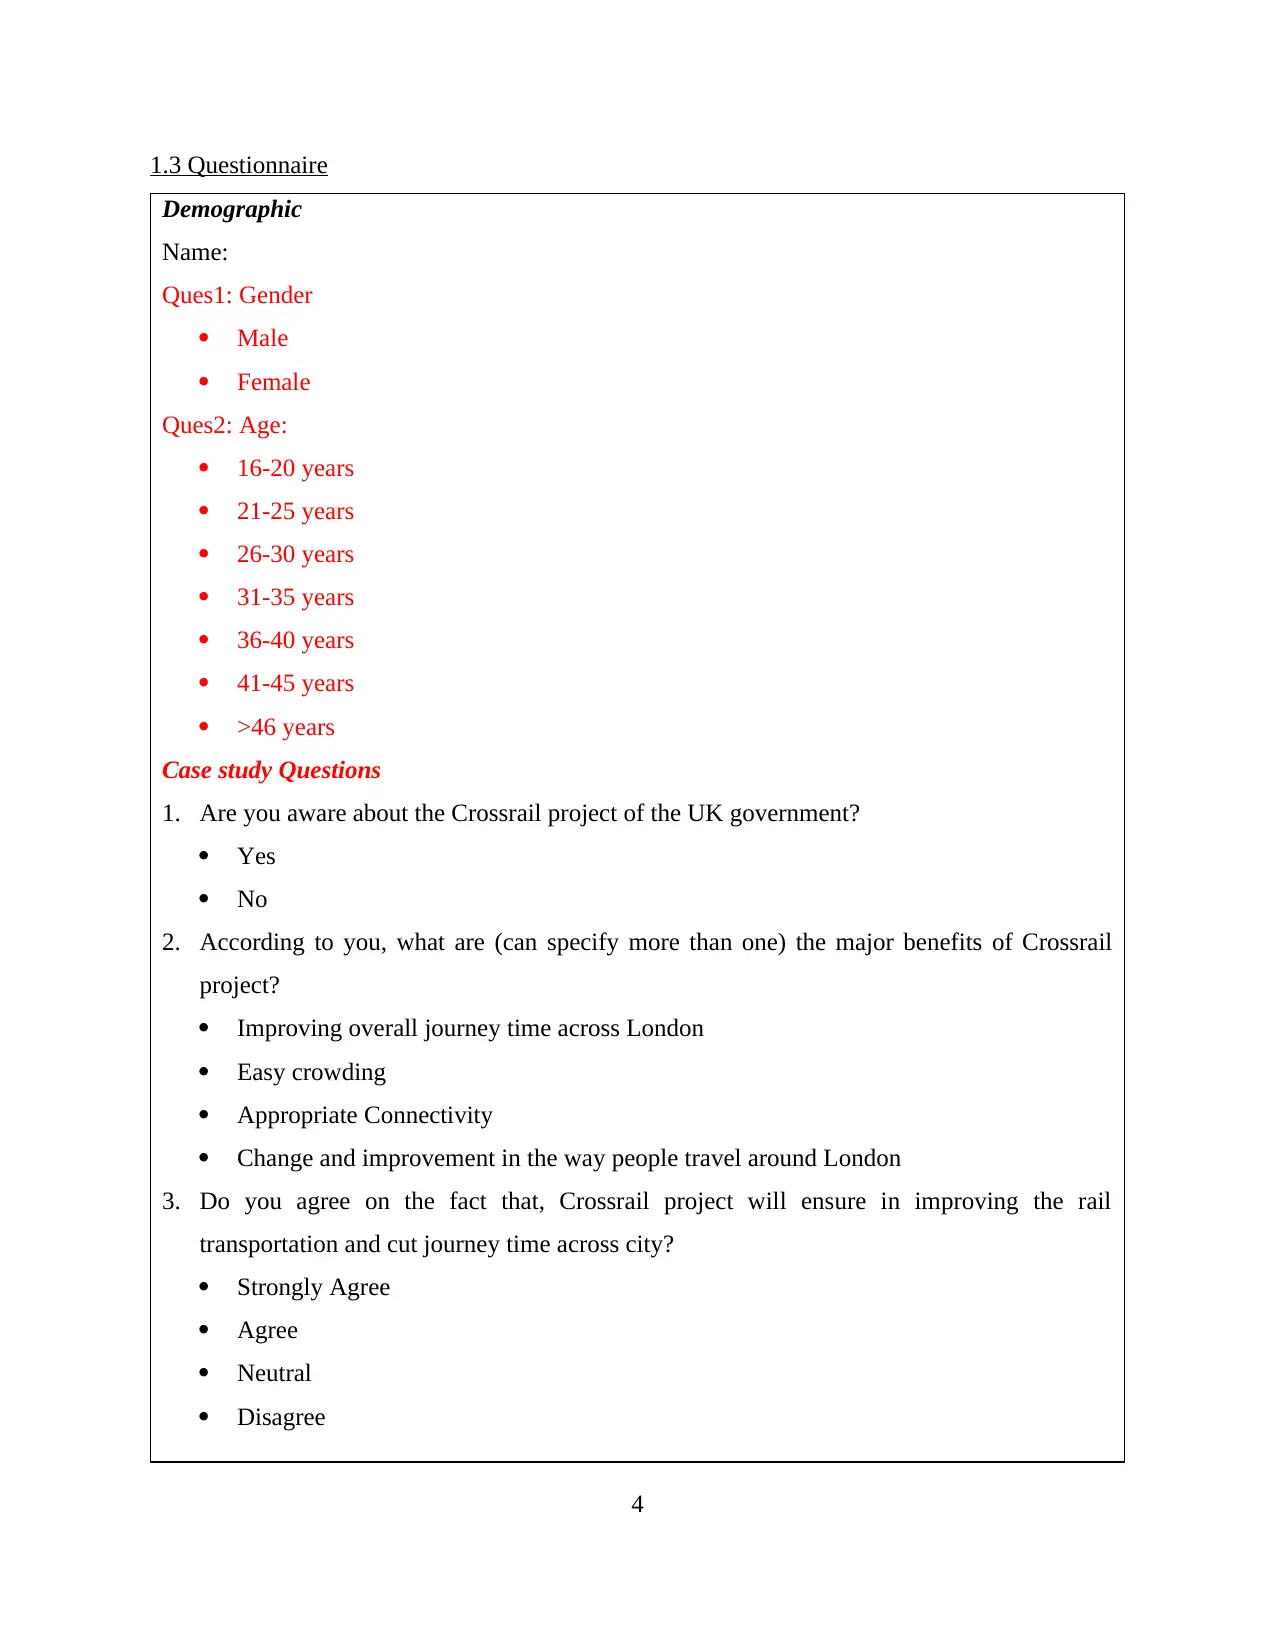
1.3 Questionnaire
Demographic
Name:
Ques1: Gender
Male
Female
Ques2: Age:
16-20 years
21-25 years
26-30 years
31-35 years
36-40 years
41-45 years
>46 years
Case study Questions
1. Are you aware about the Crossrail project of the UK government?
Yes
No
2. According to you, what are (can specify more than one) the major benefits of Crossrail
project?
Improving overall journey time across London
Easy crowding
Appropriate Connectivity
Change and improvement in the way people travel around London
3. Do you agree on the fact that, Crossrail project will ensure in improving the rail
transportation and cut journey time across city?
Strongly Agree
Agree
Neutral
Disagree
4
Paraphrase This Document
Need a fresh take? Get an instant paraphrase of this document with our AI Paraphraser
Strongly Agree
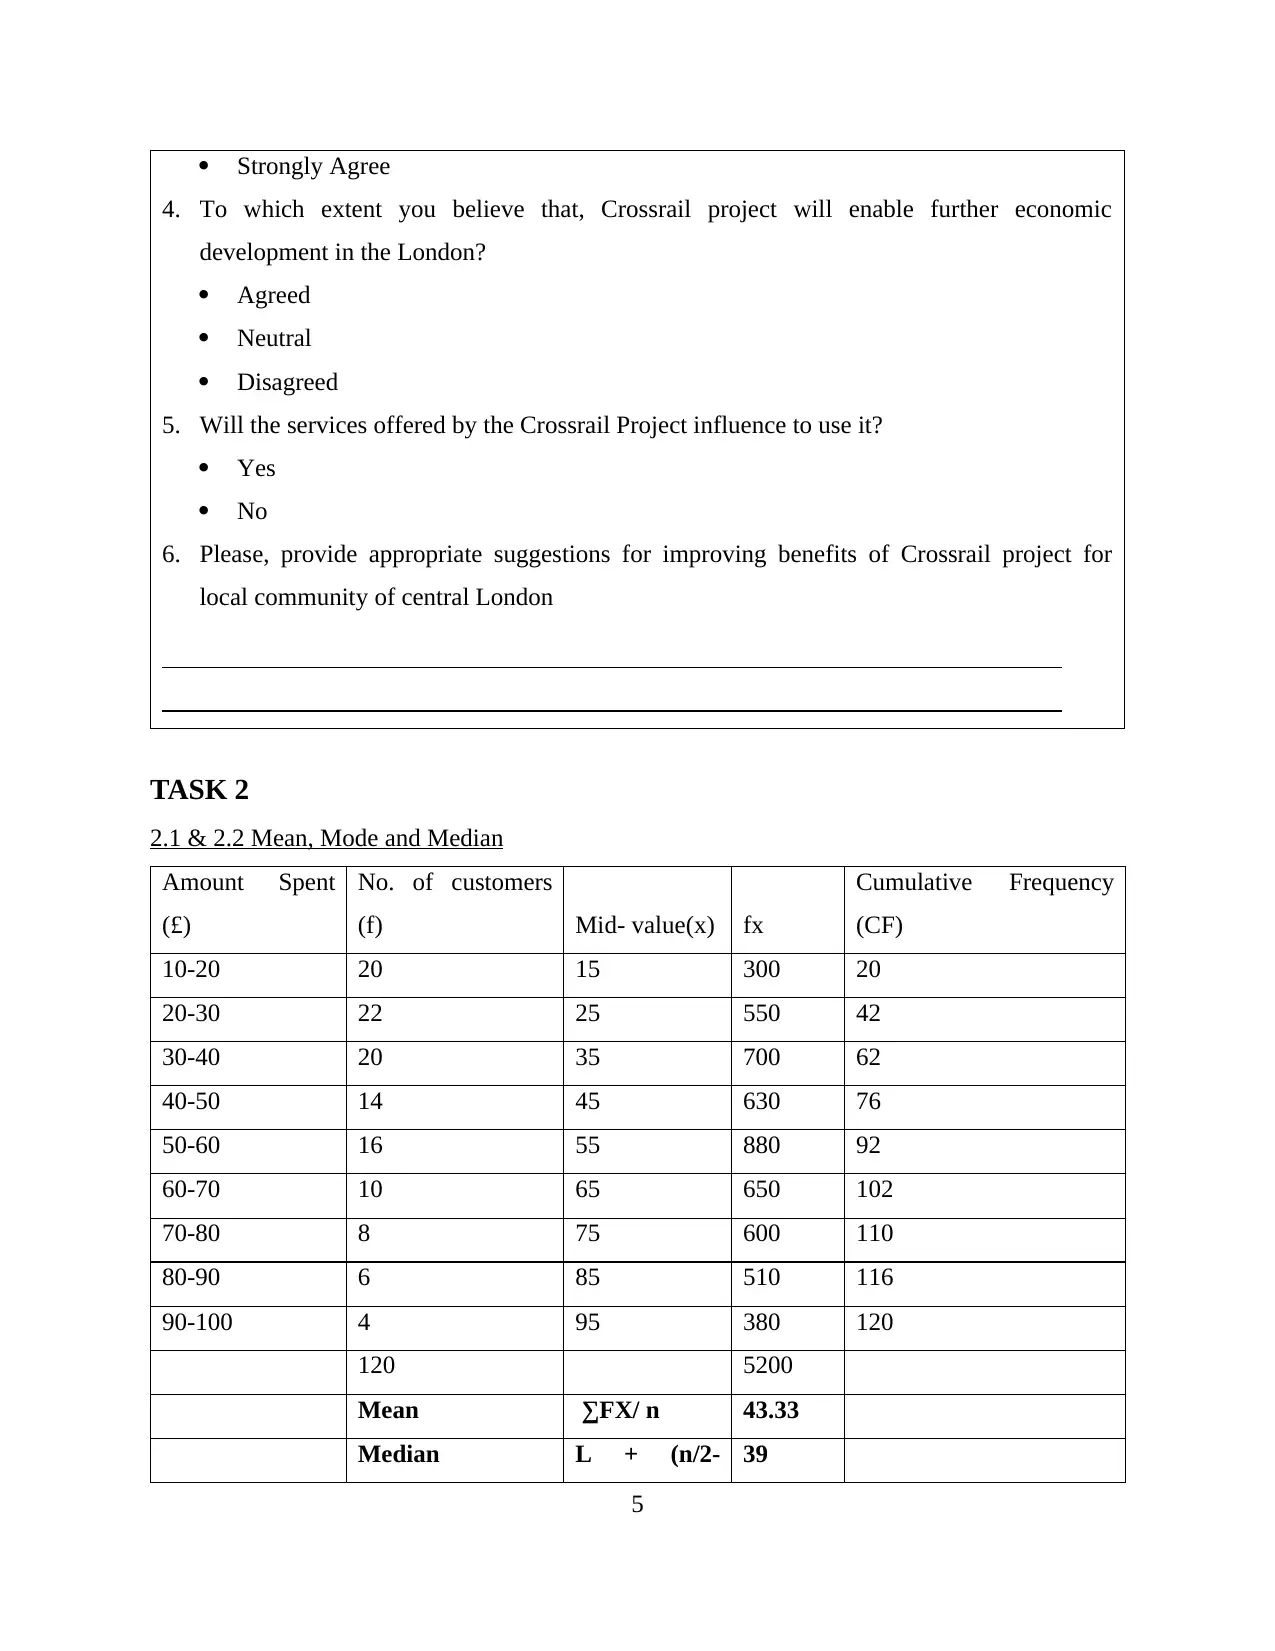
4. To which extent you believe that, Crossrail project will enable further economic
development in the London?
Agreed
Neutral
Disagreed
5. Will the services offered by the Crossrail Project influence to use it?
Yes
No
6. Please, provide appropriate suggestions for improving benefits of Crossrail project for
local community of central London
TASK 2
2.1 & 2.2 Mean, Mode and Median
Amount Spent
(£)
No. of customers
(f) Mid- value(x) fx
Cumulative Frequency
(CF)
10-20 20 15 300 20
20-30 22 25 550 42
30-40 20 35 700 62
40-50 14 45 630 76
50-60 16 55 880 92
60-70 10 65 650 102
70-80 8 75 600 110
80-90 6 85 510 116
90-100 4 95 380 120
120 5200
Mean ∑FX/ n 43.33
Median L + (n/2- 39
5
CF)/f*h
Mode
Lmo + (Δ1/
Δ1 + Δ2) * i 25
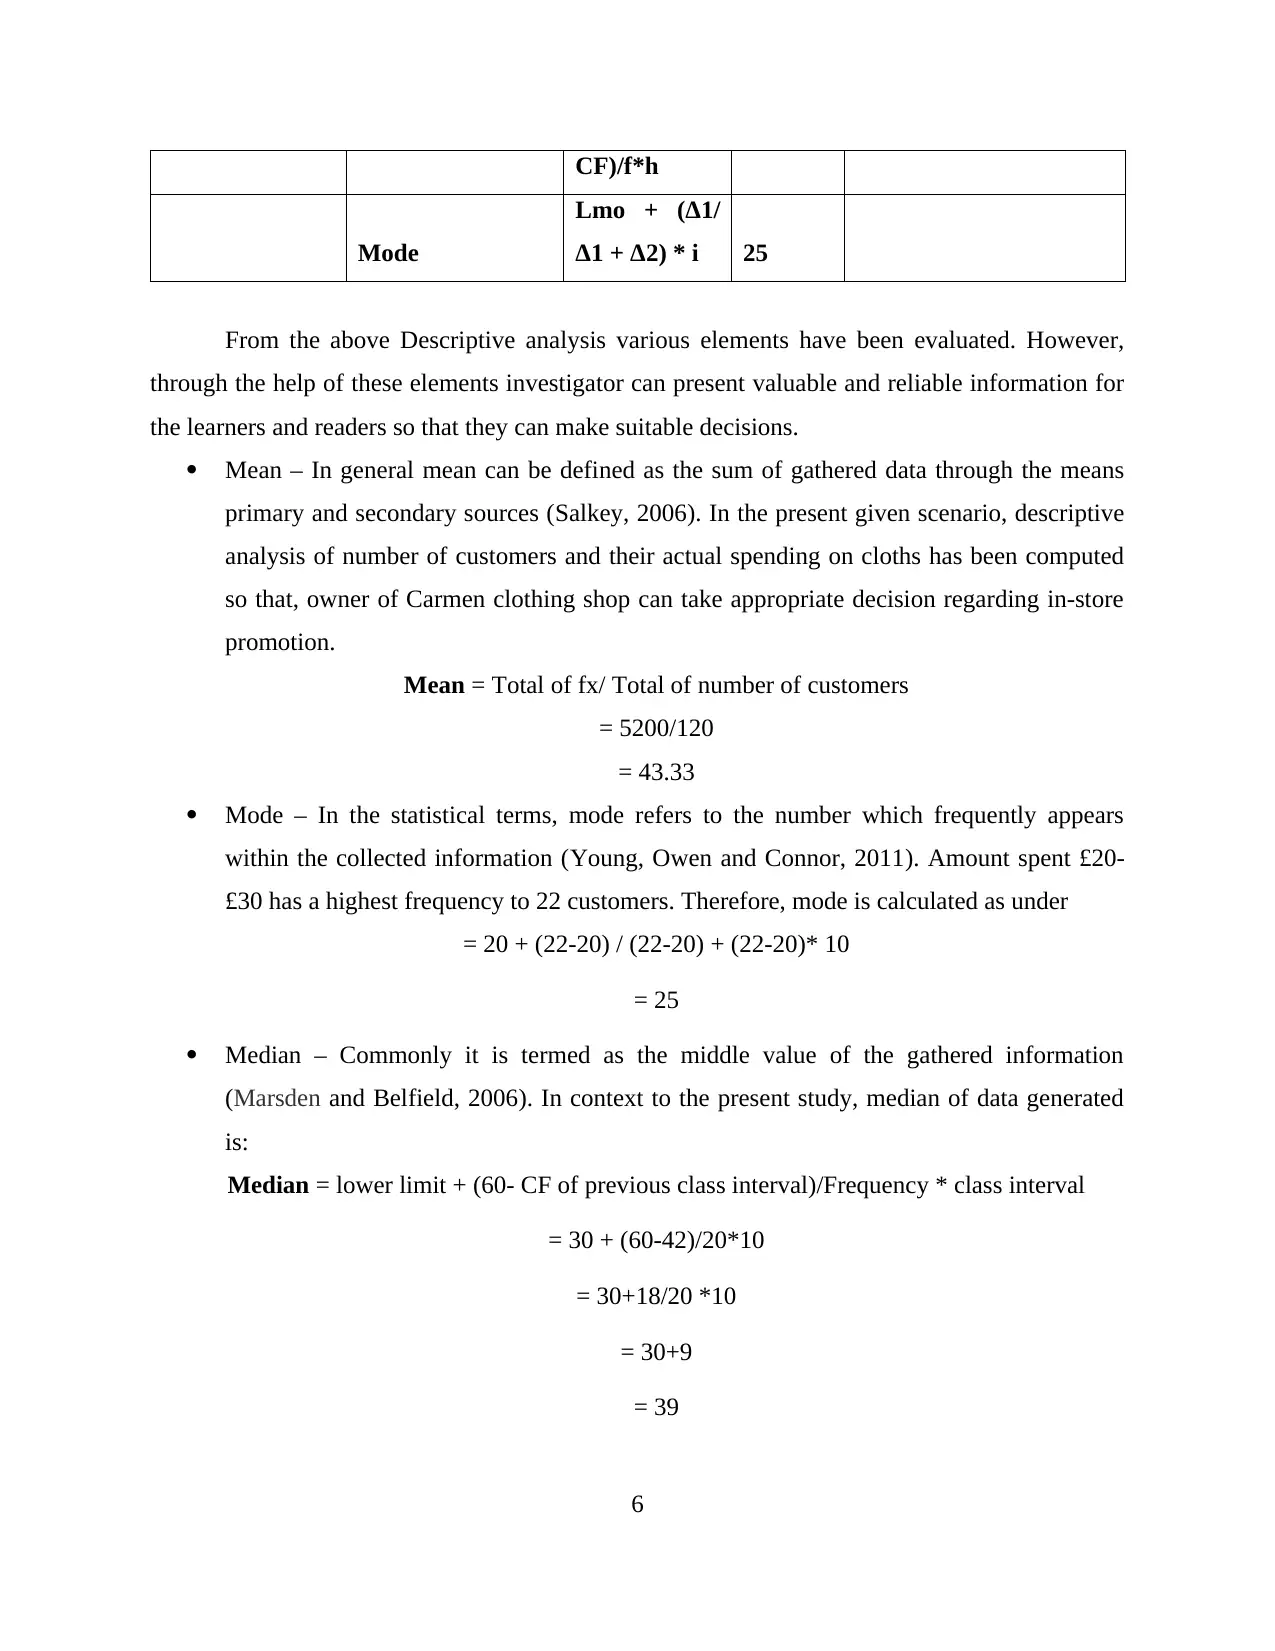
From the above Descriptive analysis various elements have been evaluated. However,
through the help of these elements investigator can present valuable and reliable information for
the learners and readers so that they can make suitable decisions.
Mean – In general mean can be defined as the sum of gathered data through the means
primary and secondary sources (Salkey, 2006). In the present given scenario, descriptive
analysis of number of customers and their actual spending on cloths has been computed
so that, owner of Carmen clothing shop can take appropriate decision regarding in-store
promotion.
Mean = Total of fx/ Total of number of customers
= 5200/120
= 43.33
Mode – In the statistical terms, mode refers to the number which frequently appears
within the collected information (Young, Owen and Connor, 2011). Amount spent £20-
£30 has a highest frequency to 22 customers. Therefore, mode is calculated as under
= 20 + (22-20) / (22-20) + (22-20)* 10
= 25
Median – Commonly it is termed as the middle value of the gathered information
(Marsden and Belfield, 2006). In context to the present study, median of data generated
is:
Median = lower limit + (60- CF of previous class interval)/Frequency * class interval
= 30 + (60-42)/20*10
= 30+18/20 *10
= 30+9
= 39
6
Mode
Lmo + (Δ1/
Δ1 + Δ2) * i 25
From the above Descriptive analysis various elements have been evaluated. However,
through the help of these elements investigator can present valuable and reliable information for
the learners and readers so that they can make suitable decisions.
Mean – In general mean can be defined as the sum of gathered data through the means
primary and secondary sources (Salkey, 2006). In the present given scenario, descriptive
analysis of number of customers and their actual spending on cloths has been computed
so that, owner of Carmen clothing shop can take appropriate decision regarding in-store
promotion.
Mean = Total of fx/ Total of number of customers
= 5200/120
= 43.33
Mode – In the statistical terms, mode refers to the number which frequently appears
within the collected information (Young, Owen and Connor, 2011). Amount spent £20-
£30 has a highest frequency to 22 customers. Therefore, mode is calculated as under
= 20 + (22-20) / (22-20) + (22-20)* 10
= 25
Median – Commonly it is termed as the middle value of the gathered information
(Marsden and Belfield, 2006). In context to the present study, median of data generated
is:
Median = lower limit + (60- CF of previous class interval)/Frequency * class interval
= 30 + (60-42)/20*10
= 30+18/20 *10
= 30+9
= 39
6
⊘ This is a preview!⊘
Do you want full access?
Subscribe today to unlock all pages.
Trusted by 1+ million students worldwide
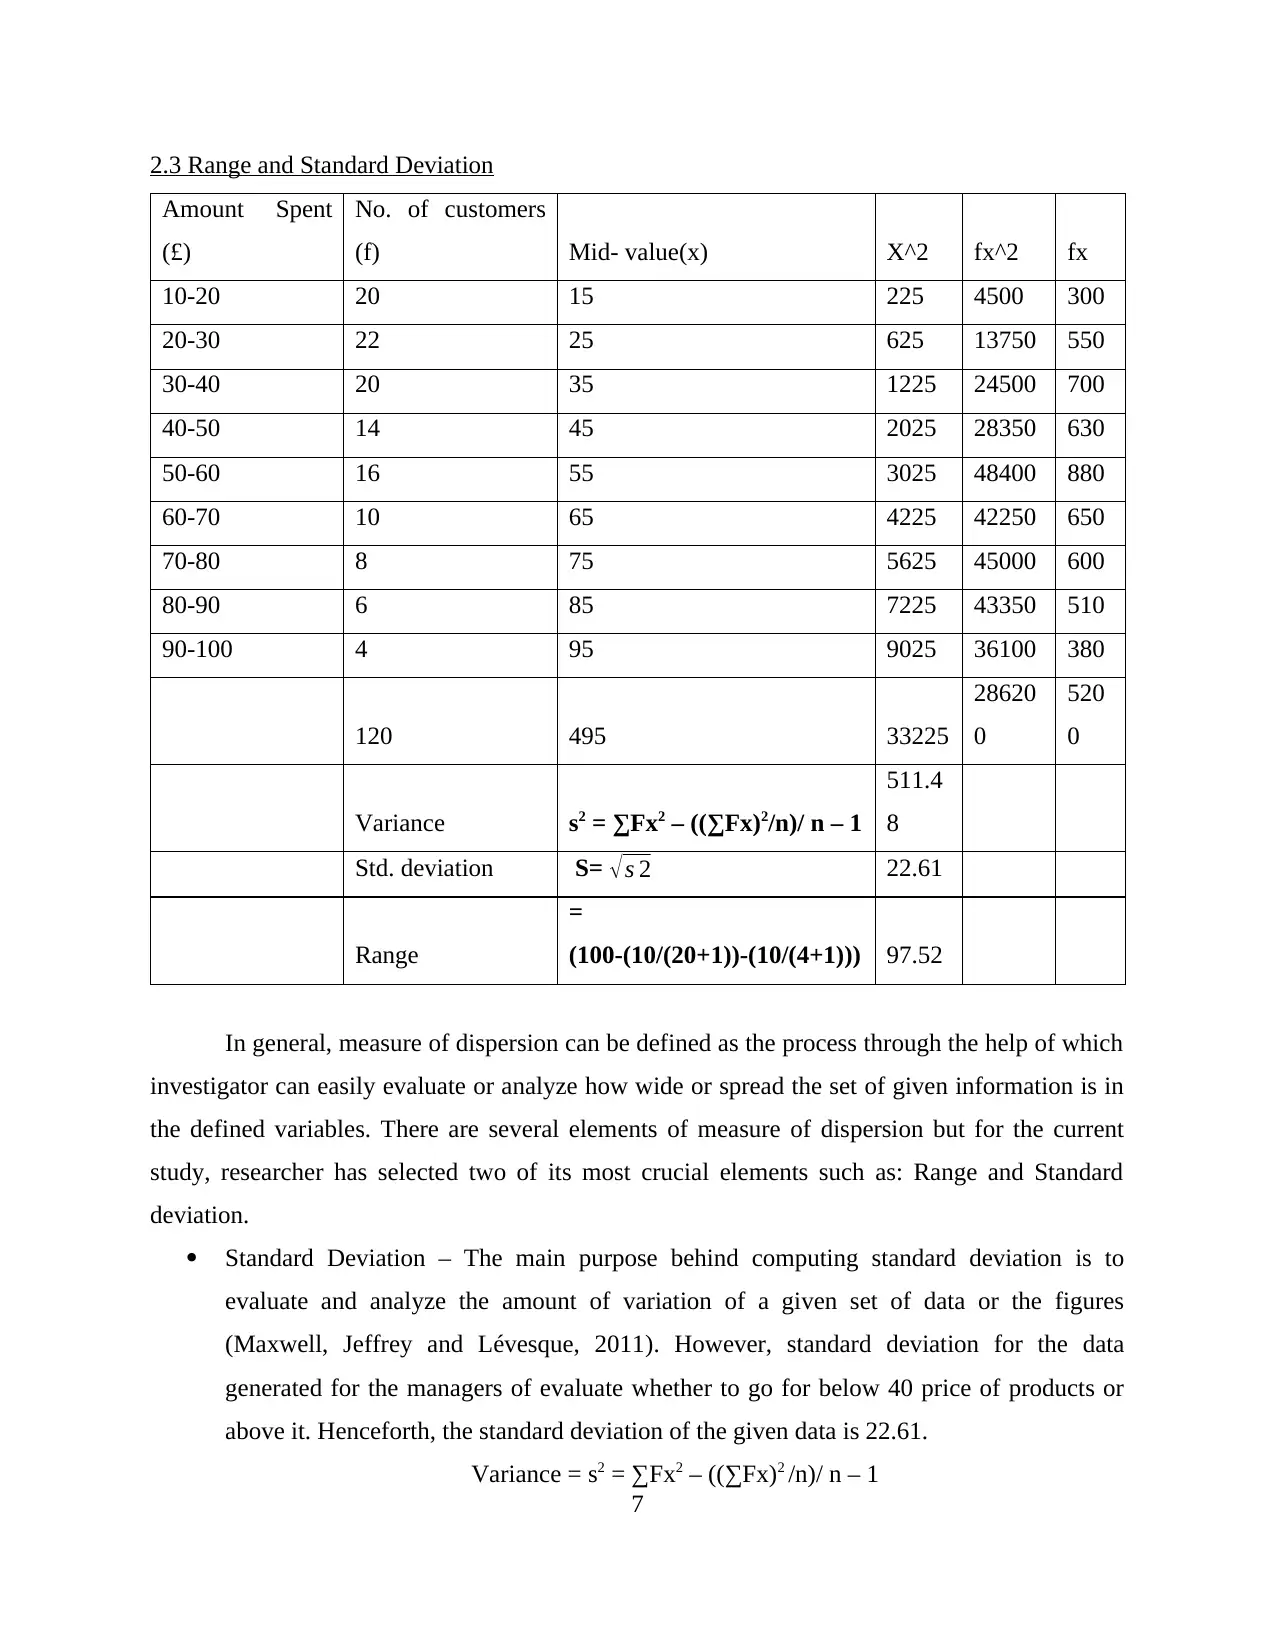
2.3 Range and Standard Deviation
Amount Spent
(£)
No. of customers
(f) Mid- value(x) X^2 fx^2 fx
10-20 20 15 225 4500 300
20-30 22 25 625 13750 550
30-40 20 35 1225 24500 700
40-50 14 45 2025 28350 630
50-60 16 55 3025 48400 880
60-70 10 65 4225 42250 650
70-80 8 75 5625 45000 600
80-90 6 85 7225 43350 510
90-100 4 95 9025 36100 380
120 495 33225
28620
0
520
0
Variance s2 = ∑Fx2 – ((∑Fx)2/n)/ n – 1
511.4
8
Std. deviation S= √s 2 22.61
Range
=
(100-(10/(20+1))-(10/(4+1))) 97.52
In general, measure of dispersion can be defined as the process through the help of which
investigator can easily evaluate or analyze how wide or spread the set of given information is in
the defined variables. There are several elements of measure of dispersion but for the current
study, researcher has selected two of its most crucial elements such as: Range and Standard
deviation.
Standard Deviation – The main purpose behind computing standard deviation is to
evaluate and analyze the amount of variation of a given set of data or the figures
(Maxwell, Jeffrey and Lévesque, 2011). However, standard deviation for the data
generated for the managers of evaluate whether to go for below 40 price of products or
above it. Henceforth, the standard deviation of the given data is 22.61.
Variance = s2 = ∑Fx2 – ((∑Fx)2 /n)/ n – 1
7
Paraphrase This Document
Need a fresh take? Get an instant paraphrase of this document with our AI Paraphraser
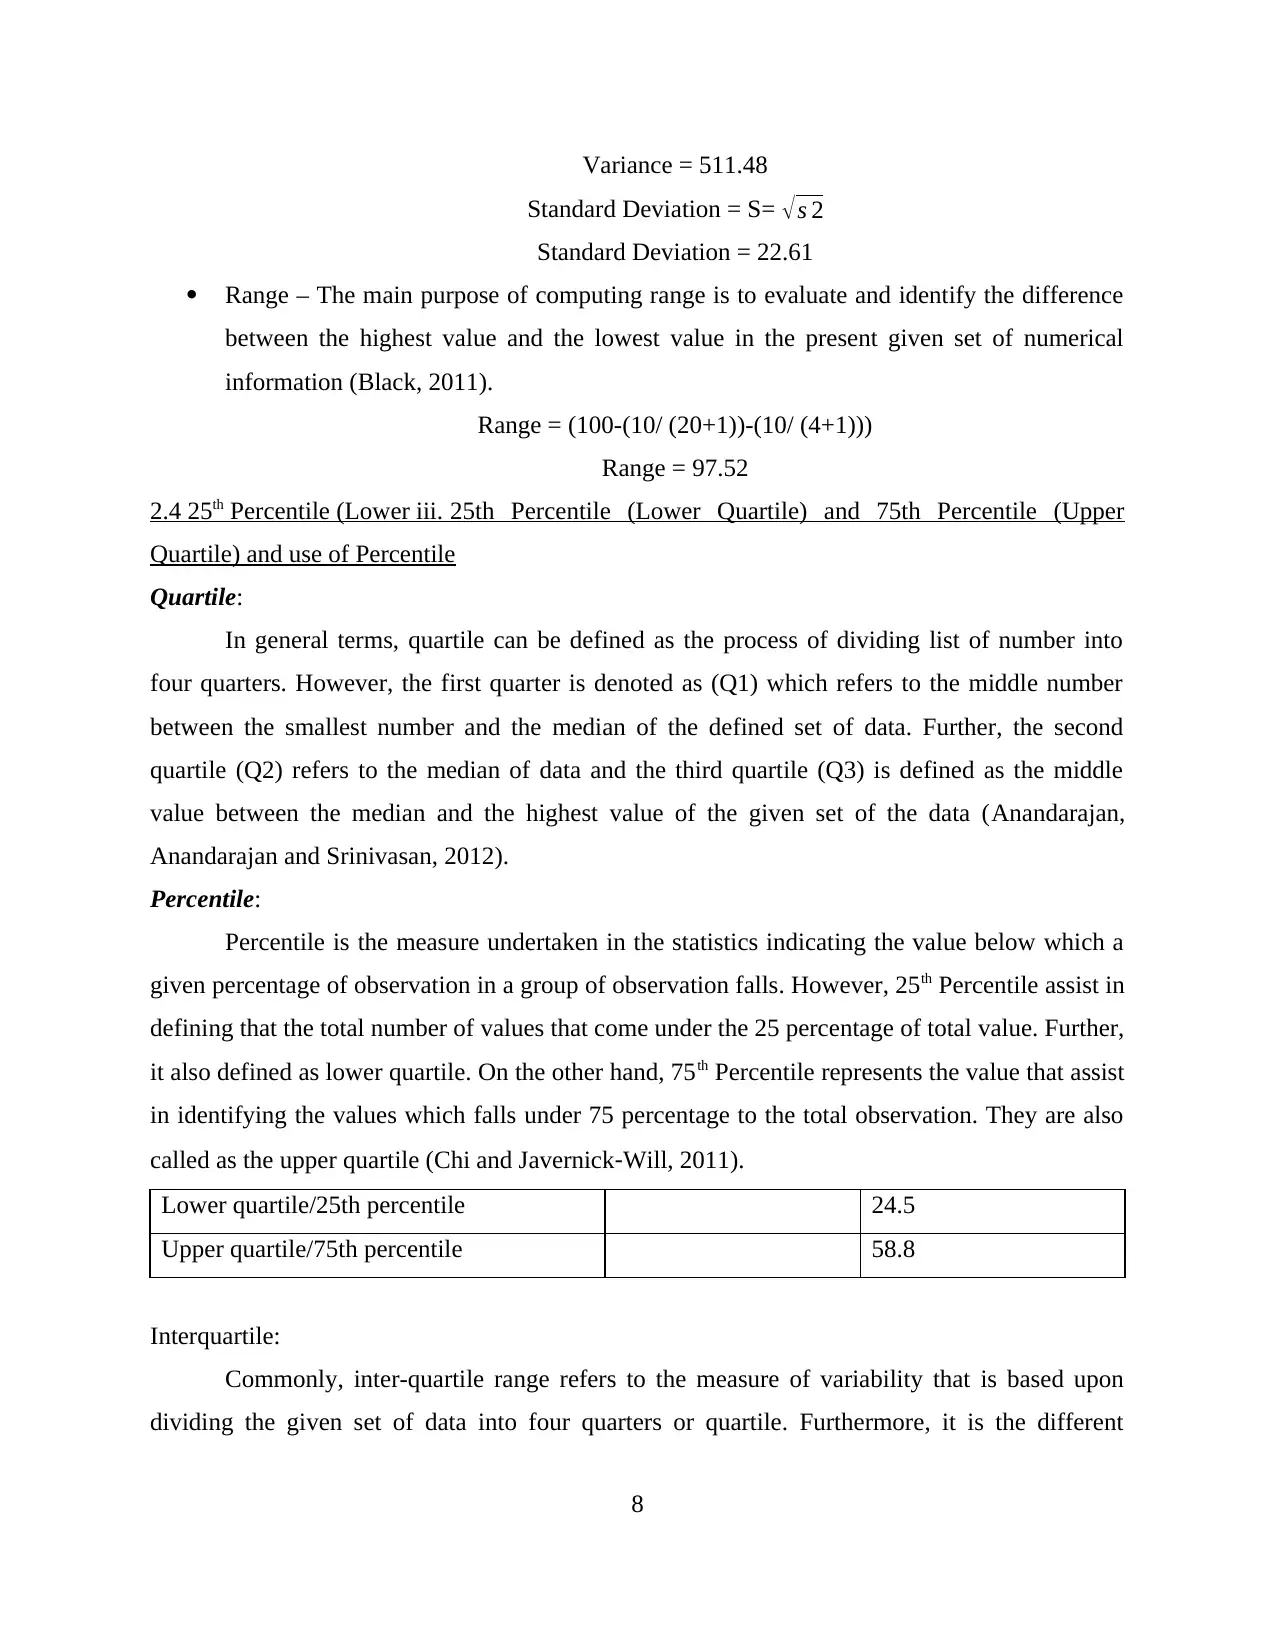
Variance = 511.48
Standard Deviation = S= √s 2
Standard Deviation = 22.61
Range – The main purpose of computing range is to evaluate and identify the difference
between the highest value and the lowest value in the present given set of numerical
information (Black, 2011).
Range = (100-(10/ (20+1))-(10/ (4+1)))
Range = 97.52
2.4 25th Percentile (Lower iii. 25th Percentile (Lower Quartile) and 75th Percentile (Upper
Quartile) and use of Percentile
Quartile:
In general terms, quartile can be defined as the process of dividing list of number into
four quarters. However, the first quarter is denoted as (Q1) which refers to the middle number
between the smallest number and the median of the defined set of data. Further, the second
quartile (Q2) refers to the median of data and the third quartile (Q3) is defined as the middle
value between the median and the highest value of the given set of the data (Anandarajan,
Anandarajan and Srinivasan, 2012).
Percentile:
Percentile is the measure undertaken in the statistics indicating the value below which a
given percentage of observation in a group of observation falls. However, 25th Percentile assist in
defining that the total number of values that come under the 25 percentage of total value. Further,
it also defined as lower quartile. On the other hand, 75th Percentile represents the value that assist
in identifying the values which falls under 75 percentage to the total observation. They are also
called as the upper quartile (Chi and Javernick‐Will, 2011).
Lower quartile/25th percentile 24.5
Upper quartile/75th percentile 58.8
Interquartile:
Commonly, inter-quartile range refers to the measure of variability that is based upon
dividing the given set of data into four quarters or quartile. Furthermore, it is the different
8
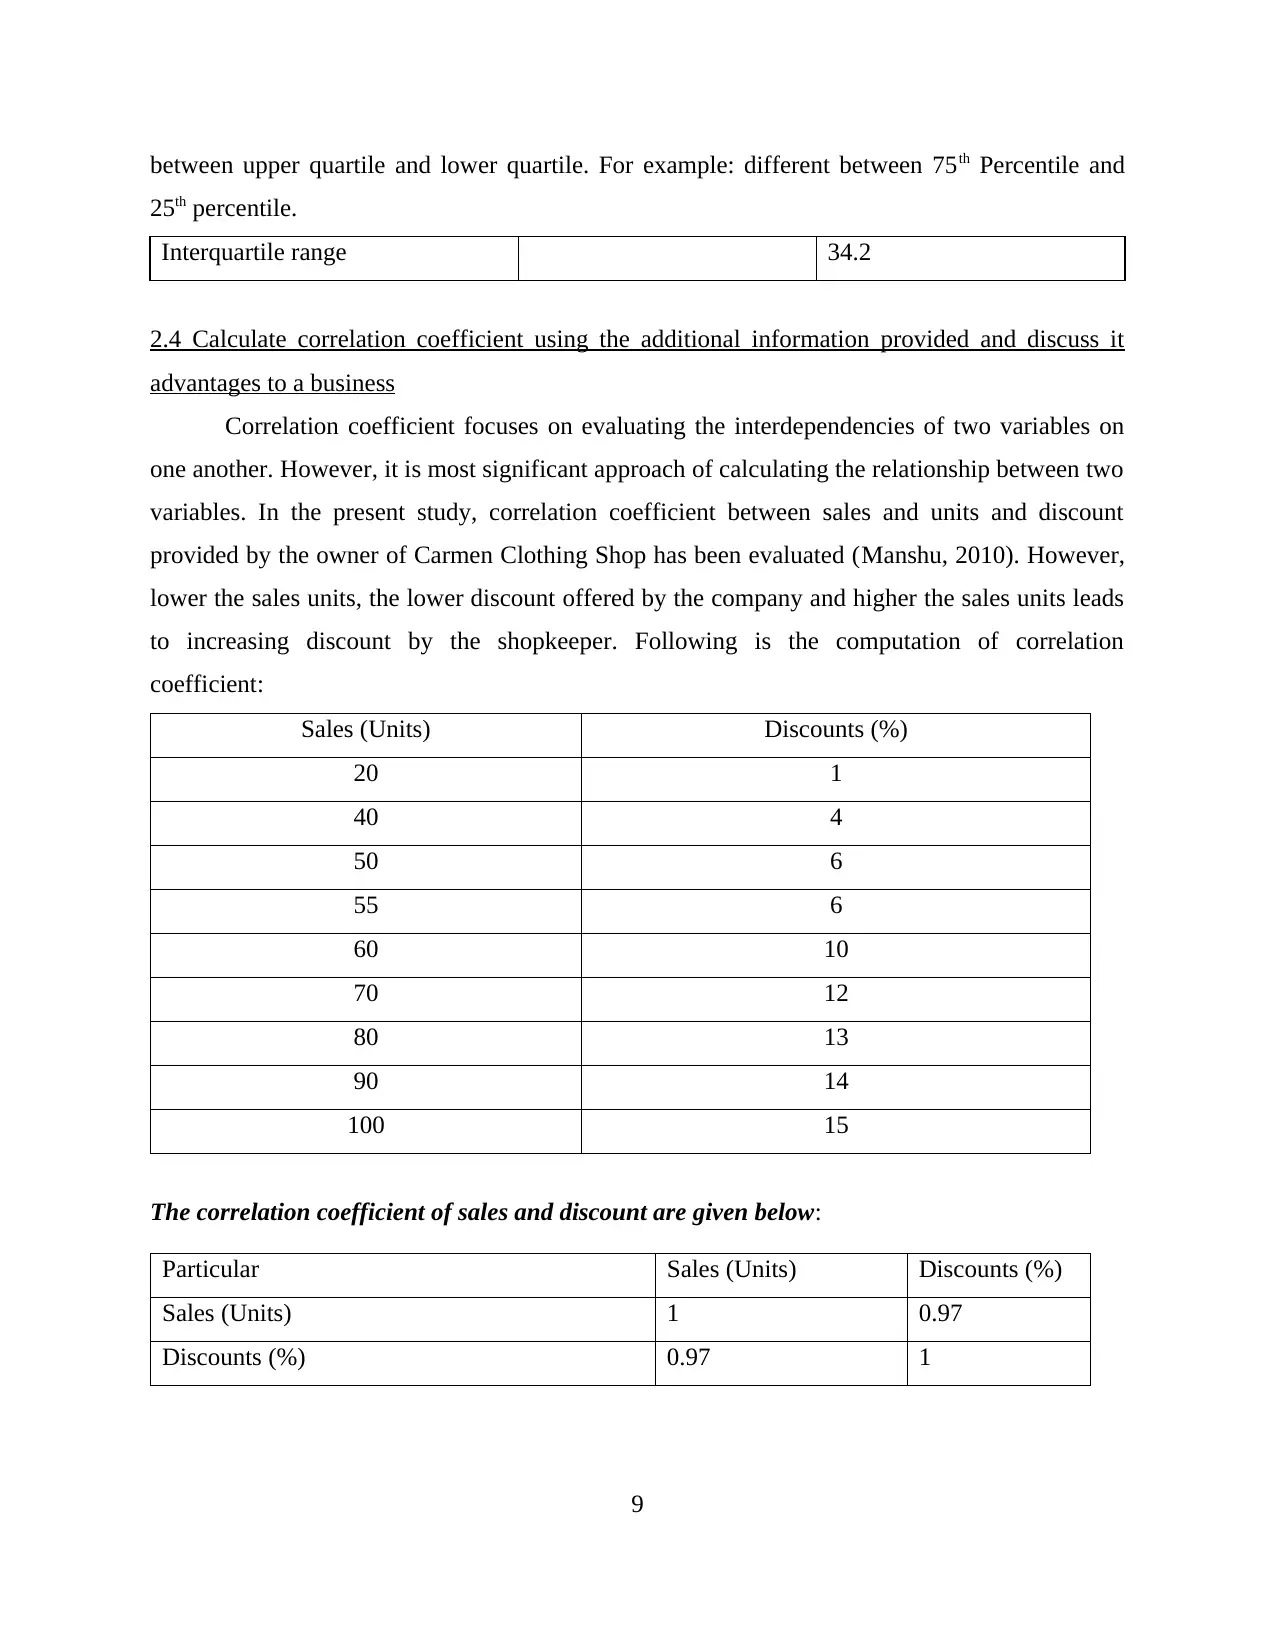
between upper quartile and lower quartile. For example: different between 75th Percentile and
25th percentile.
Interquartile range 34.2
2.4 Calculate correlation coefficient using the additional information provided and discuss it
advantages to a business
Correlation coefficient focuses on evaluating the interdependencies of two variables on
one another. However, it is most significant approach of calculating the relationship between two
variables. In the present study, correlation coefficient between sales and units and discount
provided by the owner of Carmen Clothing Shop has been evaluated (Manshu, 2010). However,
lower the sales units, the lower discount offered by the company and higher the sales units leads
to increasing discount by the shopkeeper. Following is the computation of correlation
coefficient:
Sales (Units) Discounts (%)
20 1
40 4
50 6
55 6
60 10
70 12
80 13
90 14
100 15
The correlation coefficient of sales and discount are given below:
Particular Sales (Units) Discounts (%)
Sales (Units) 1 0.97
Discounts (%) 0.97 1
9
⊘ This is a preview!⊘
Do you want full access?
Subscribe today to unlock all pages.
Trusted by 1+ million students worldwide
1 out of 24
Related Documents


Your All-in-One AI-Powered Toolkit for Academic Success.
+13062052269
info@desklib.com
Available 24*7 on WhatsApp / Email
![[object Object]](/_next/static/media/star-bottom.7253800d.svg)
Unlock your academic potential
Copyright © 2020–2026 A2Z Services. All Rights Reserved. Developed and managed by ZUCOL.