Business Decision Making: Data Visualization and Performance Analysis
VerifiedAdded on 2023/04/04
|19
|532
|393
Report
AI Summary
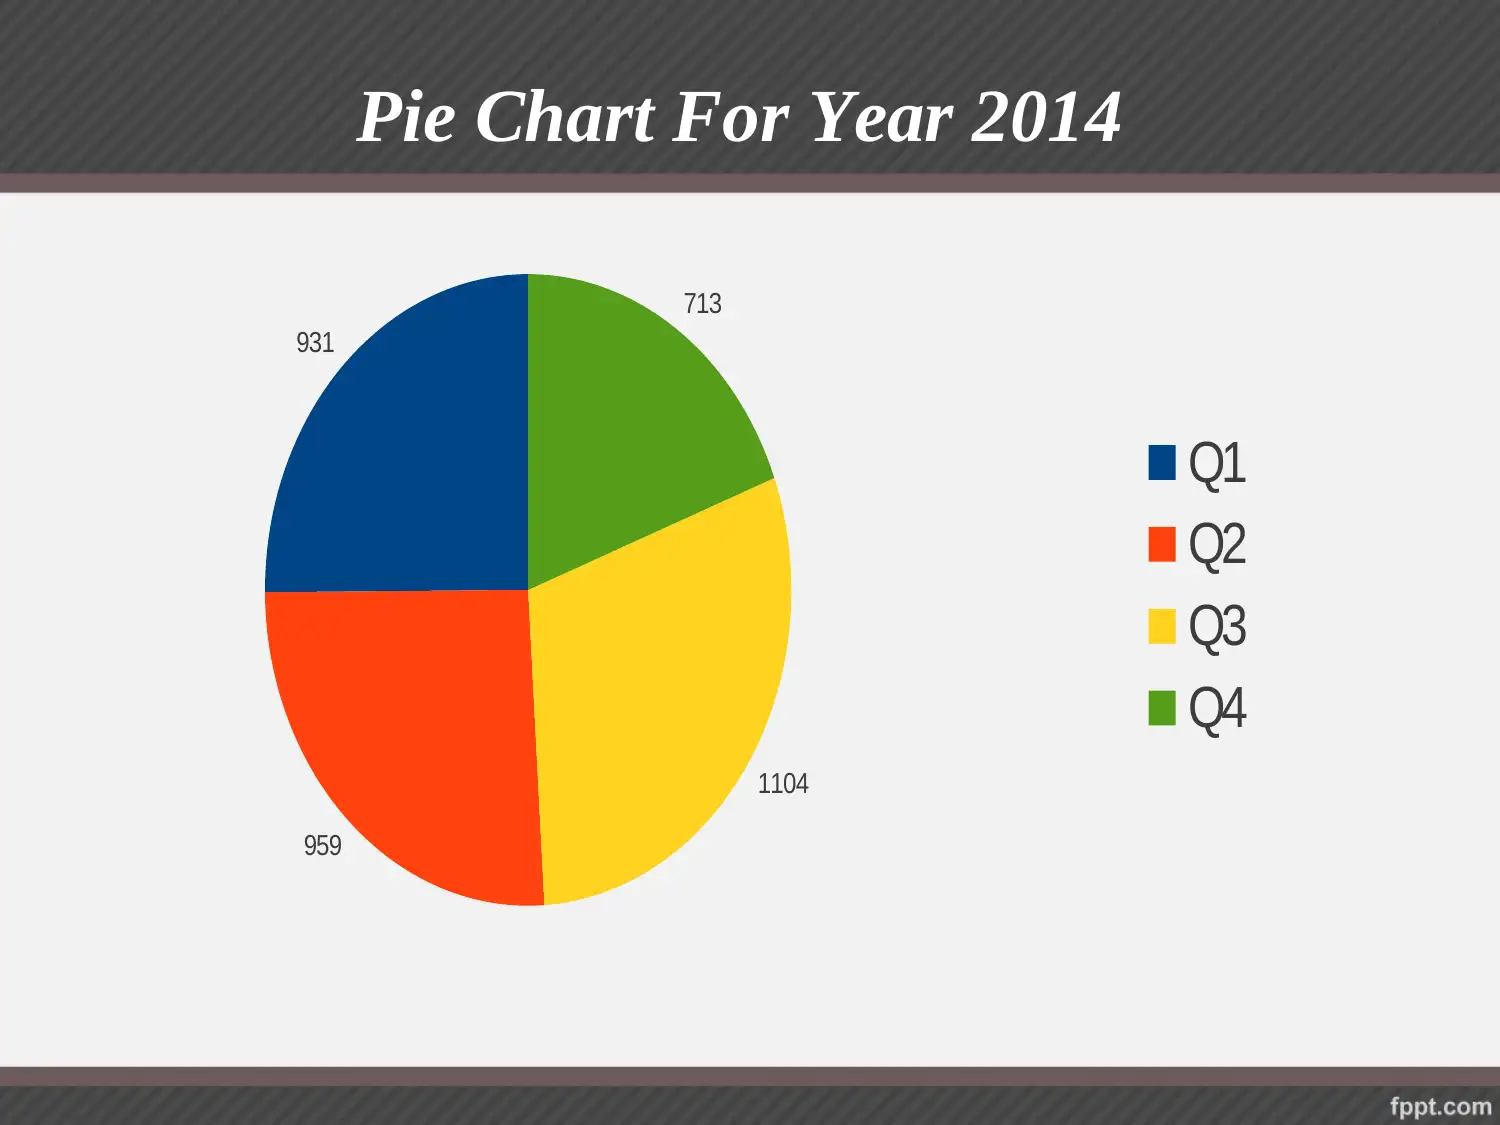
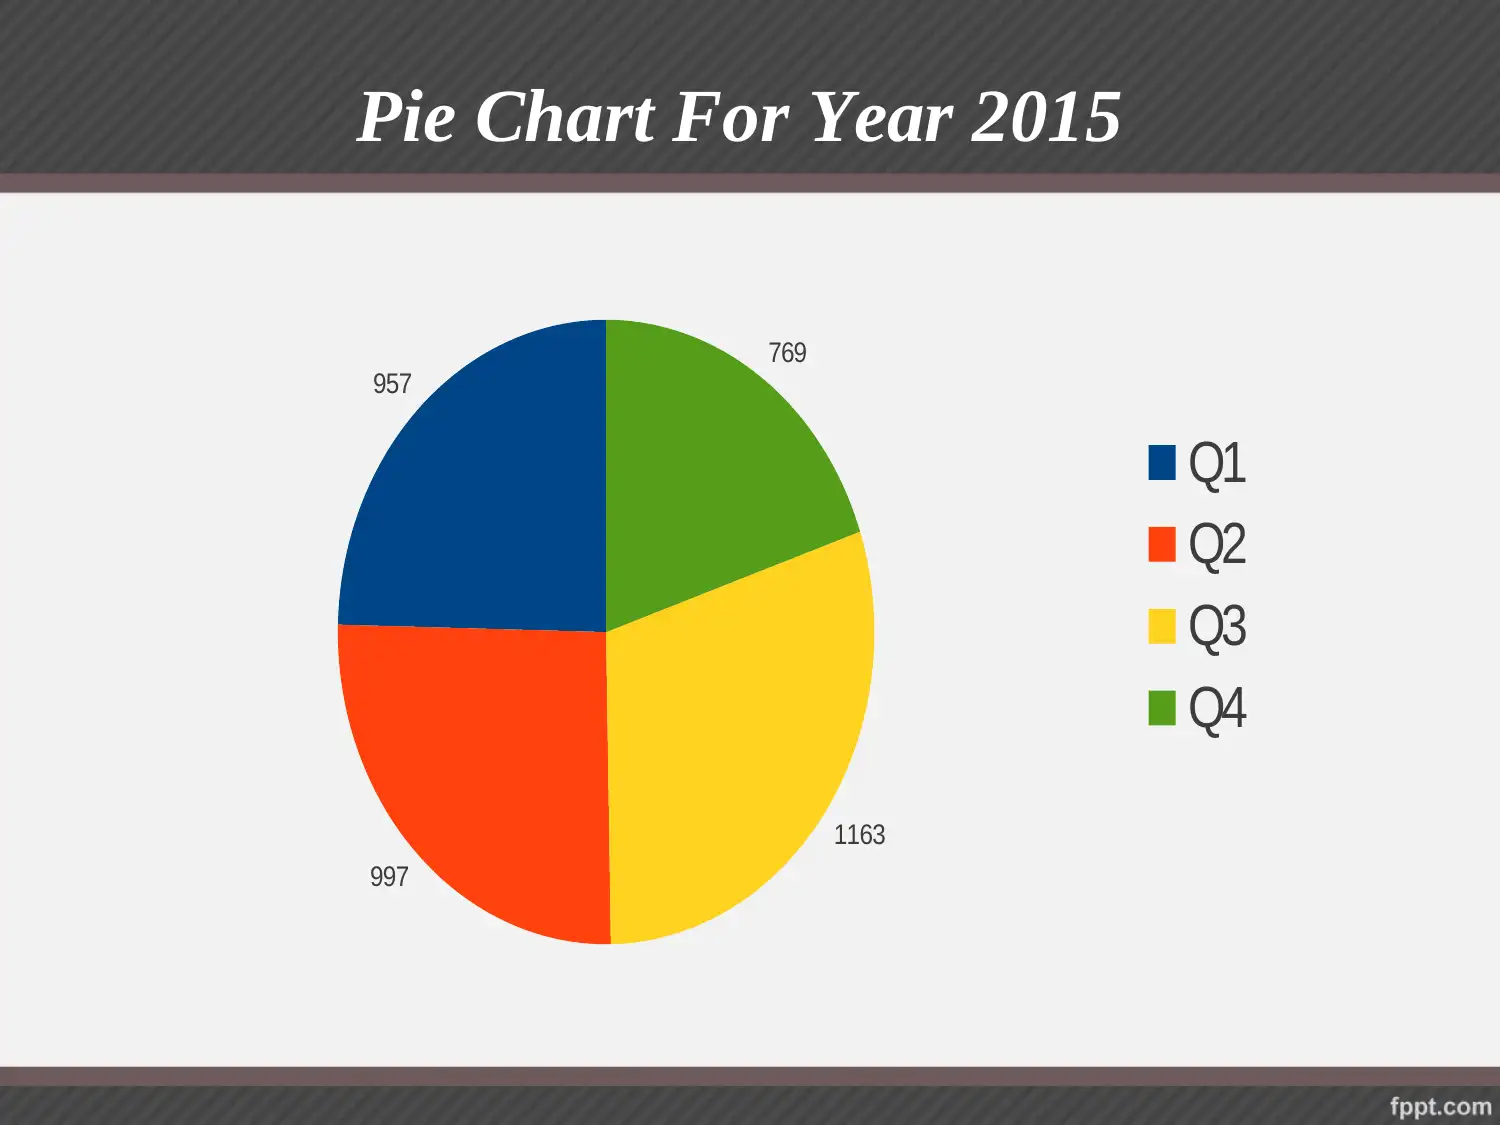
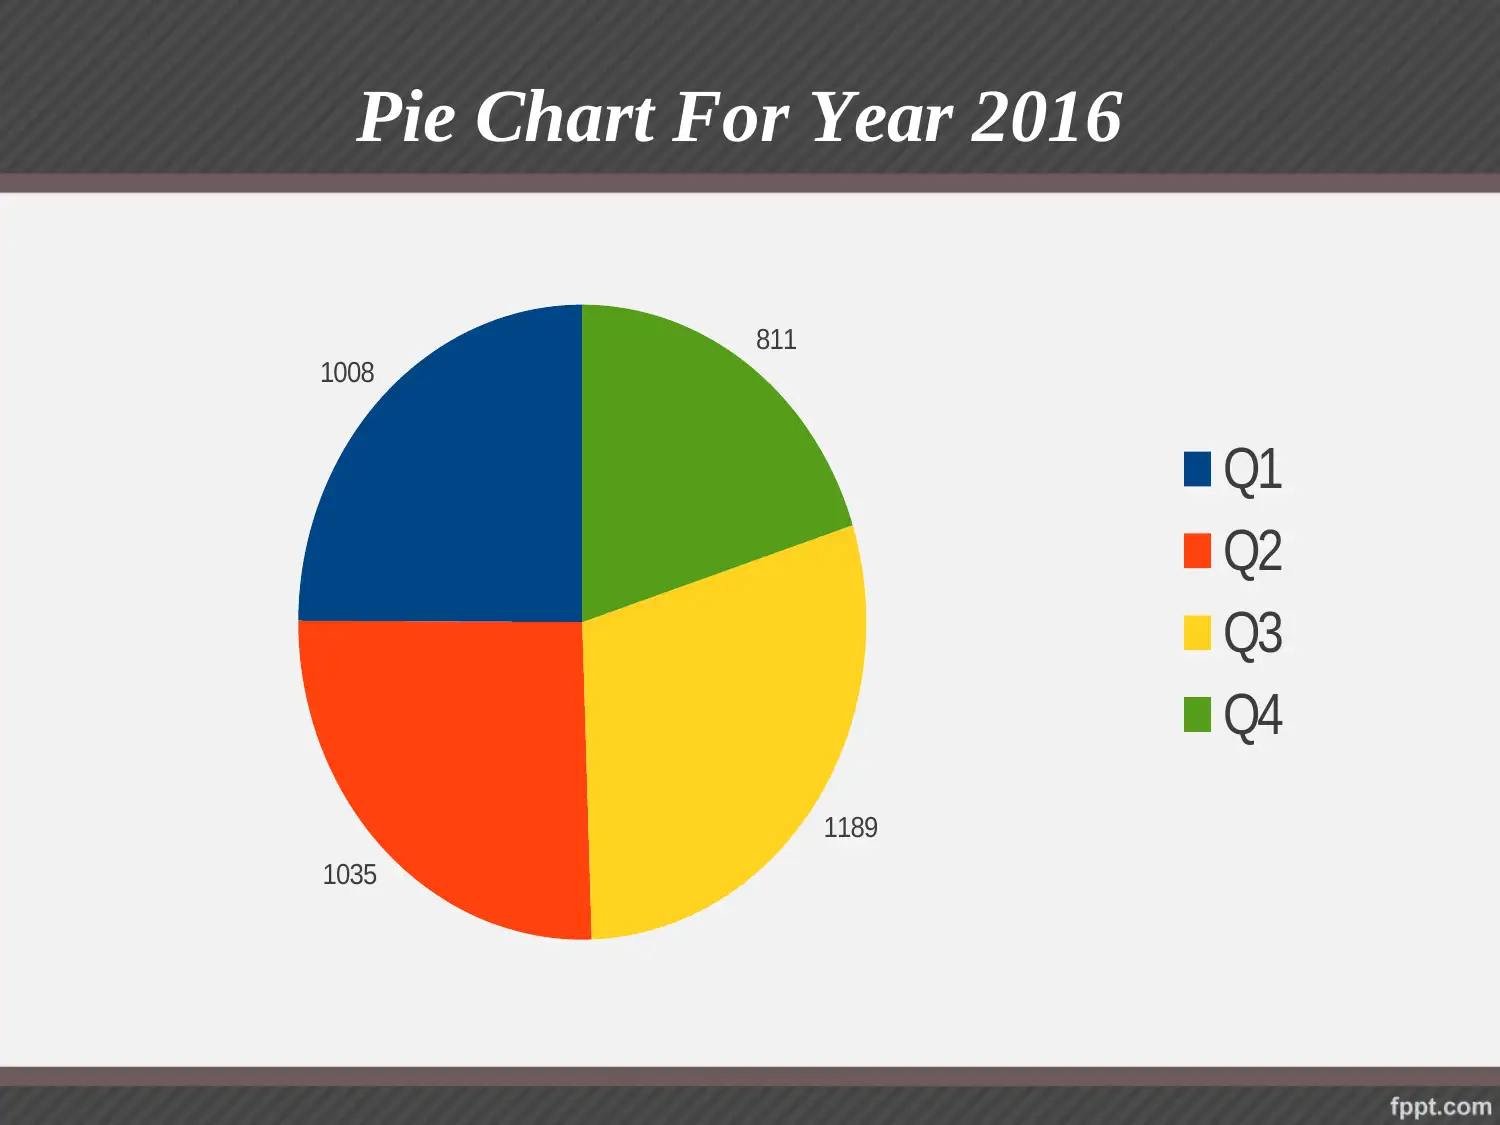
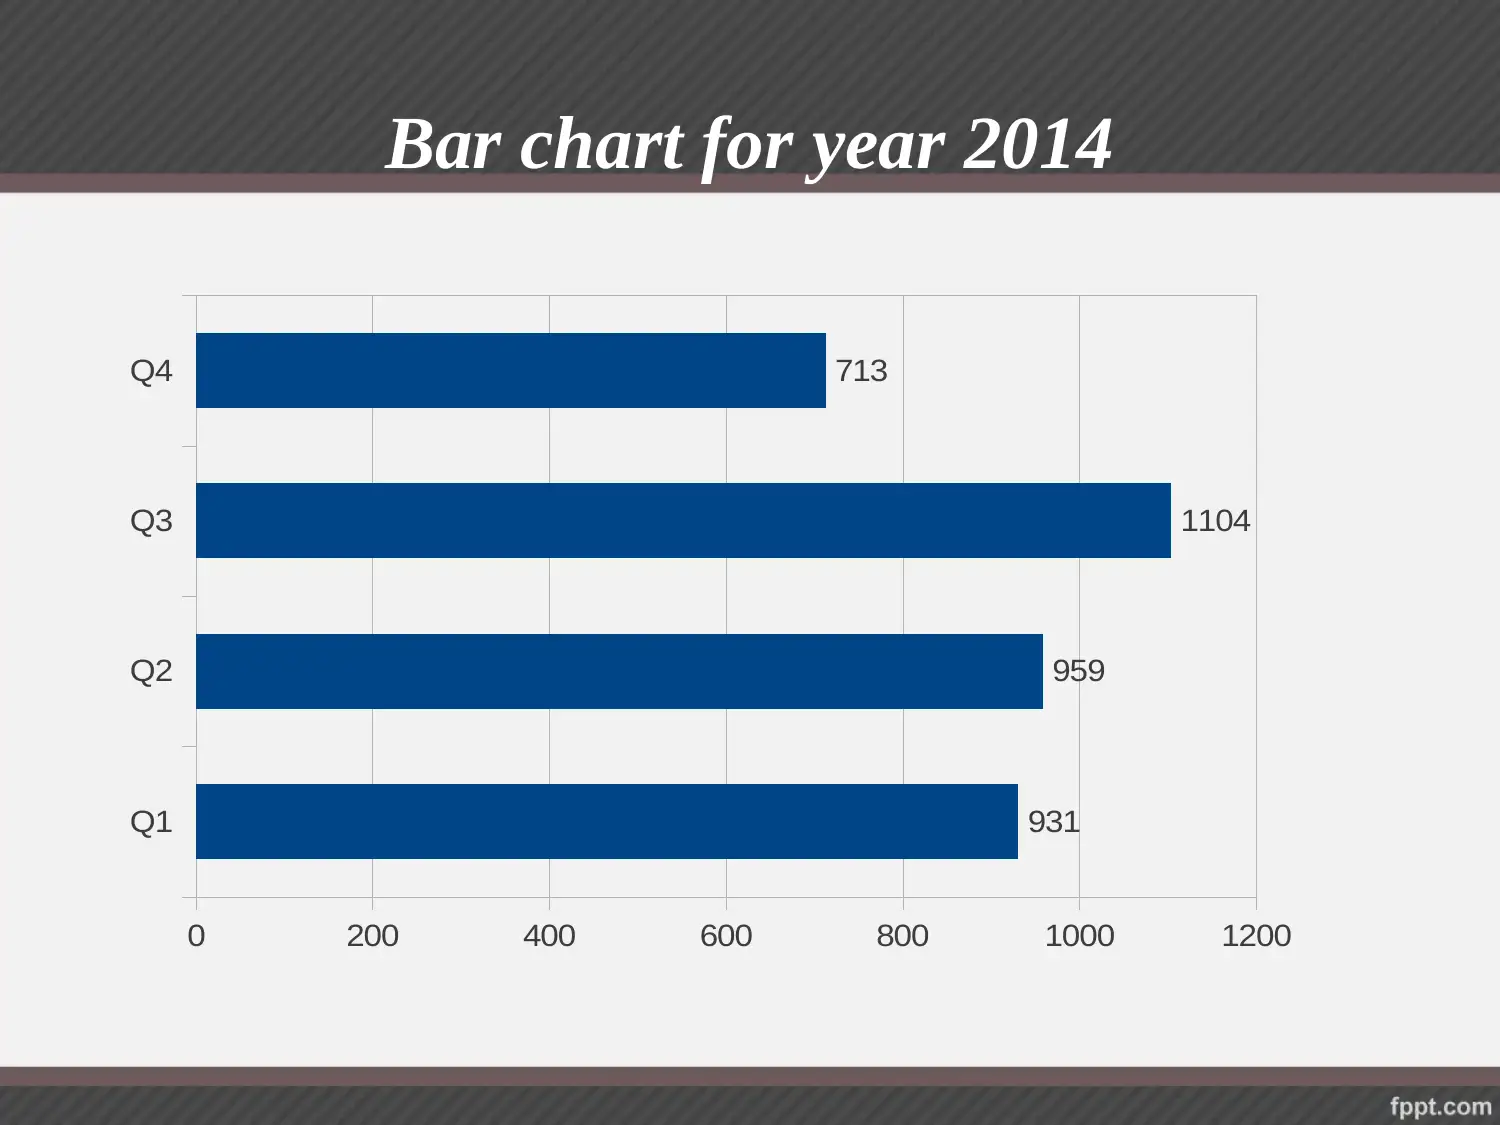
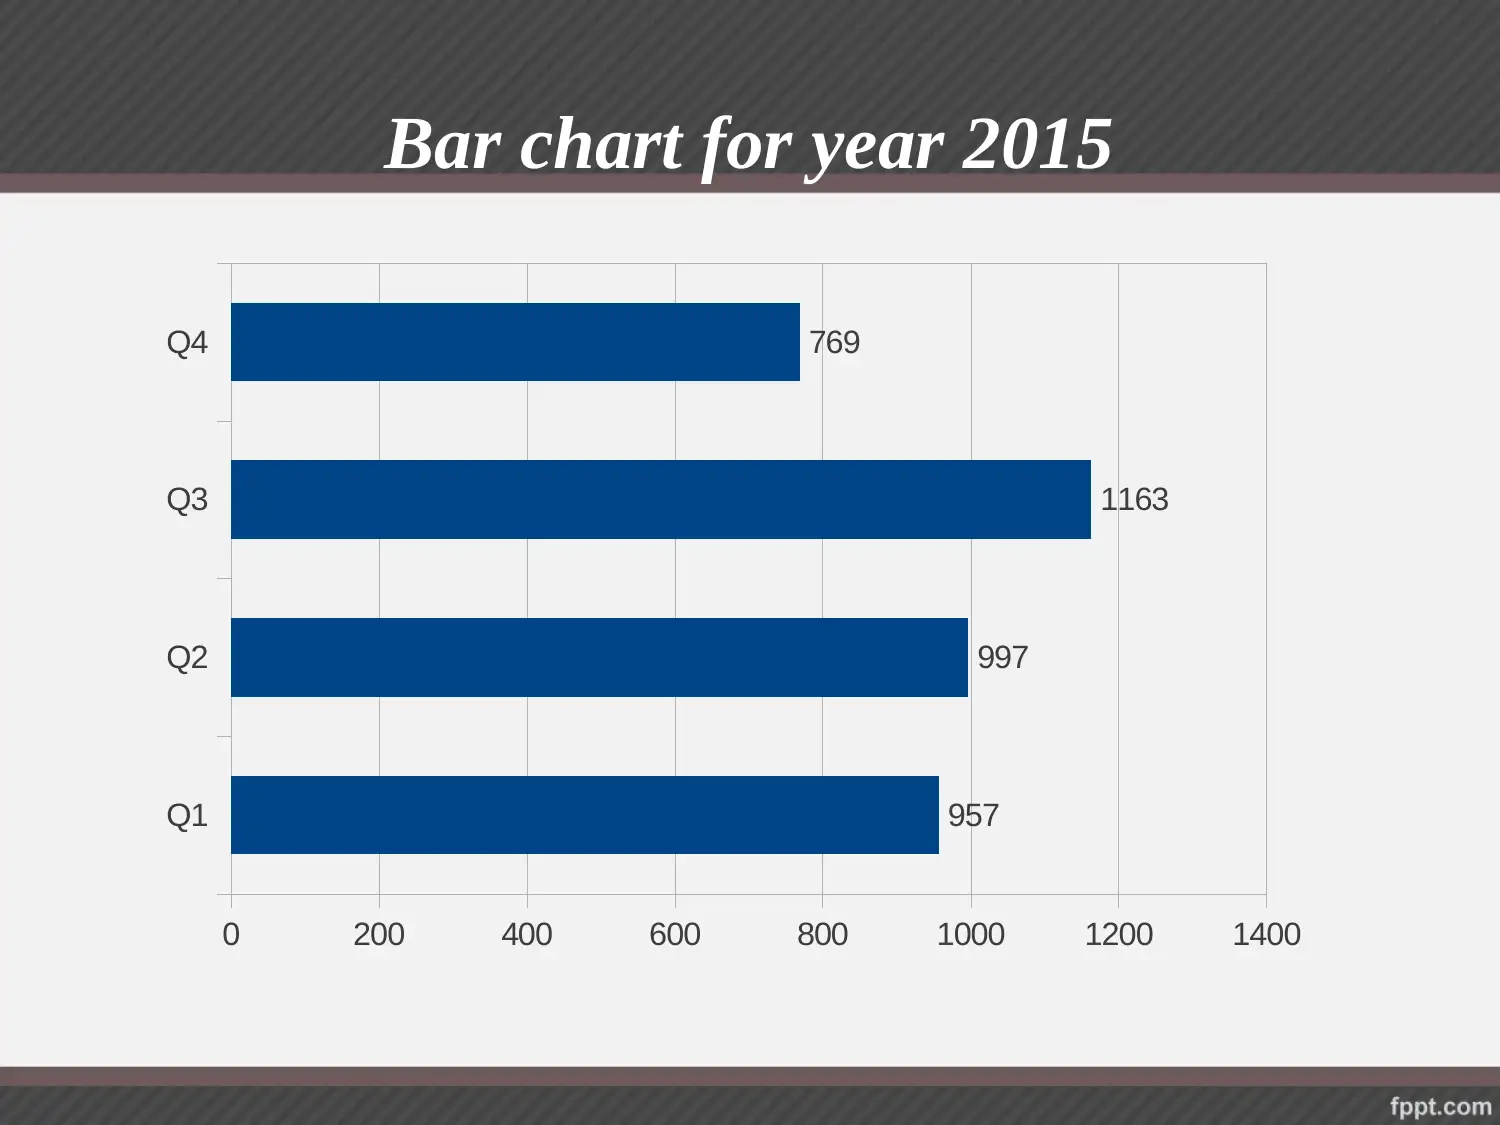
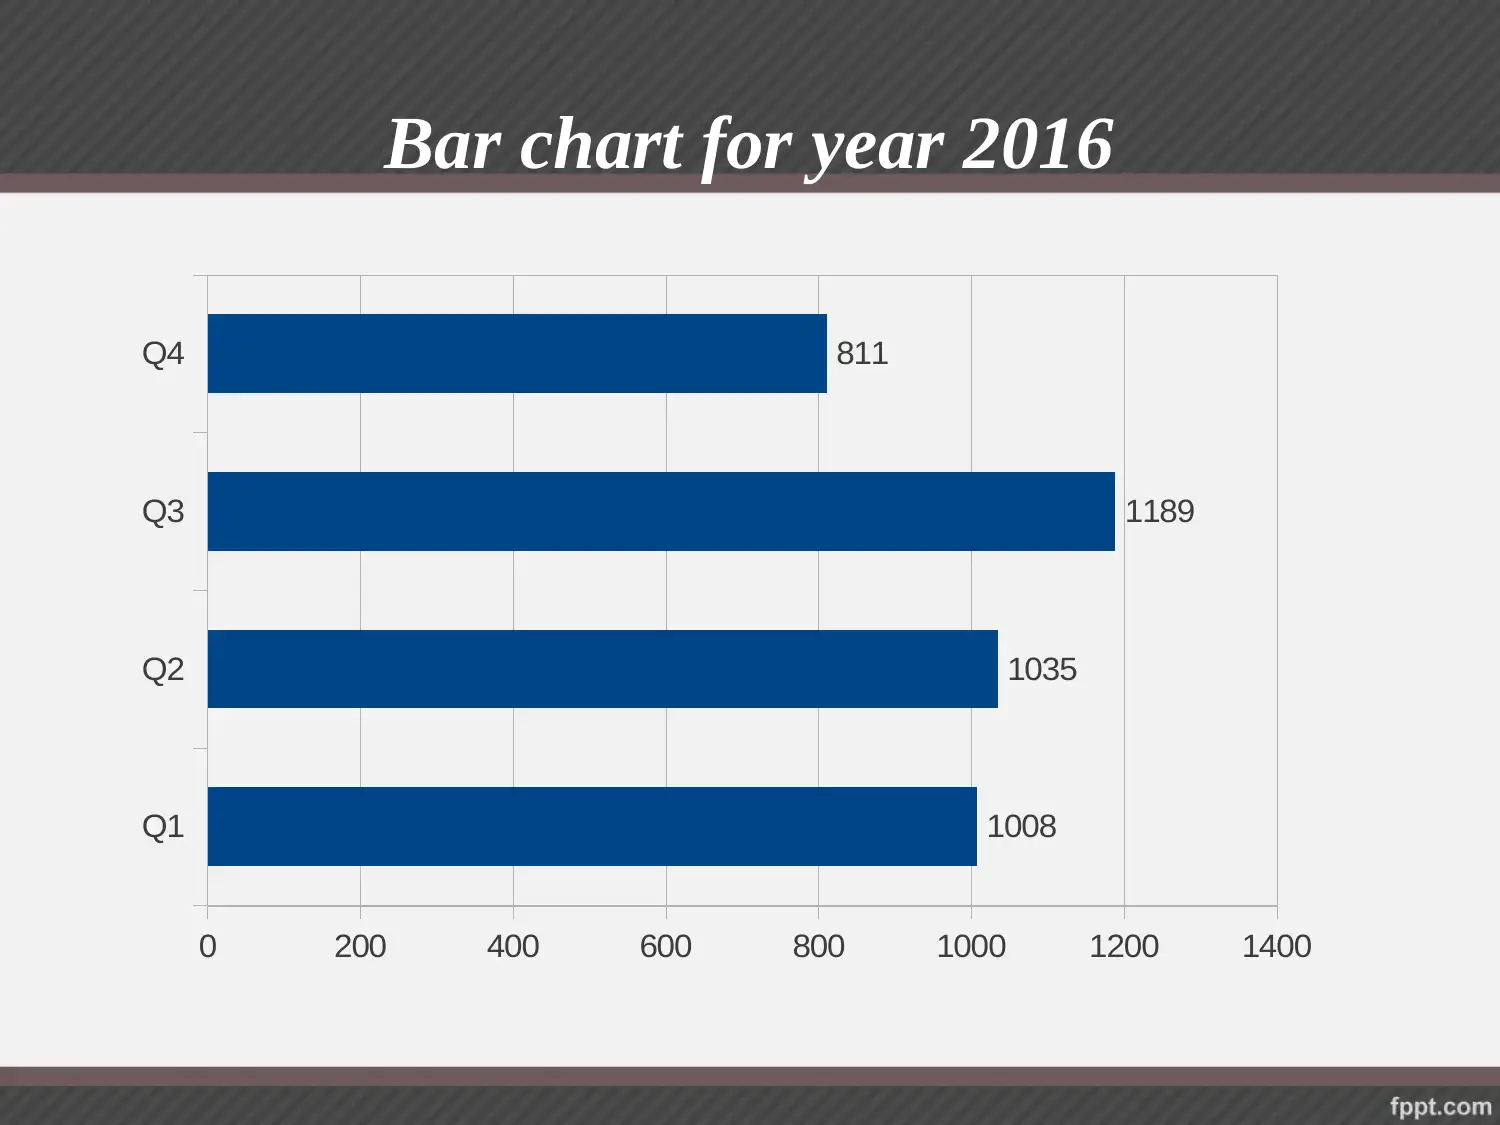
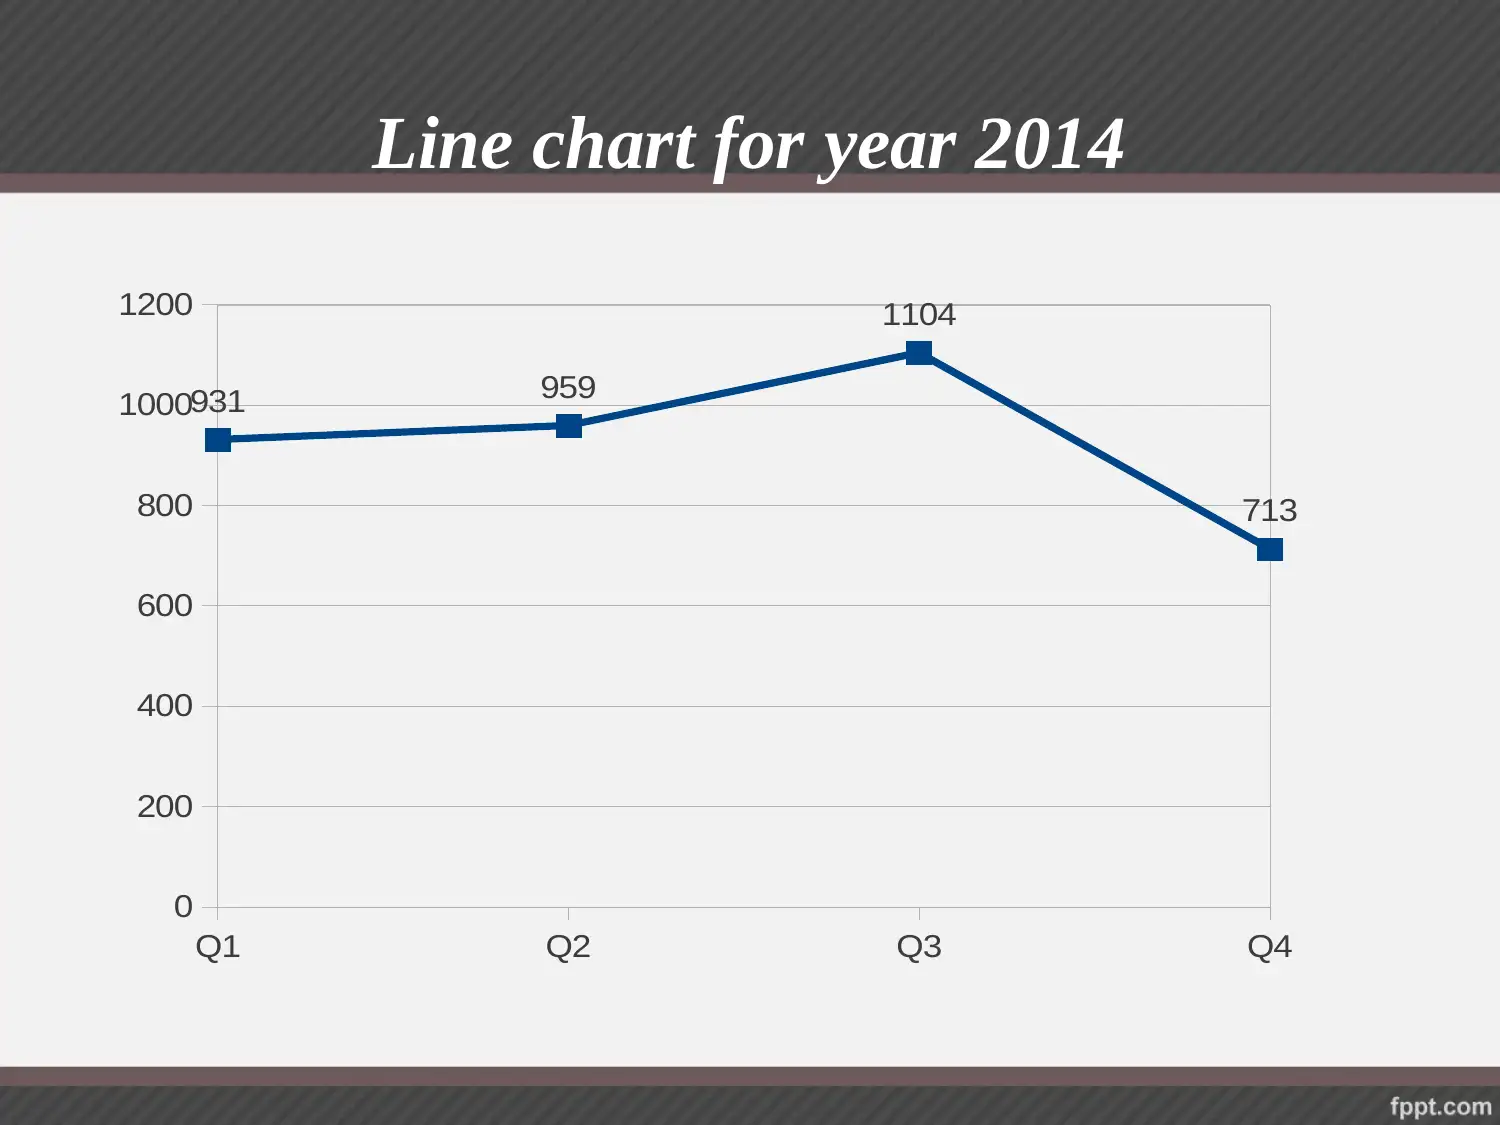
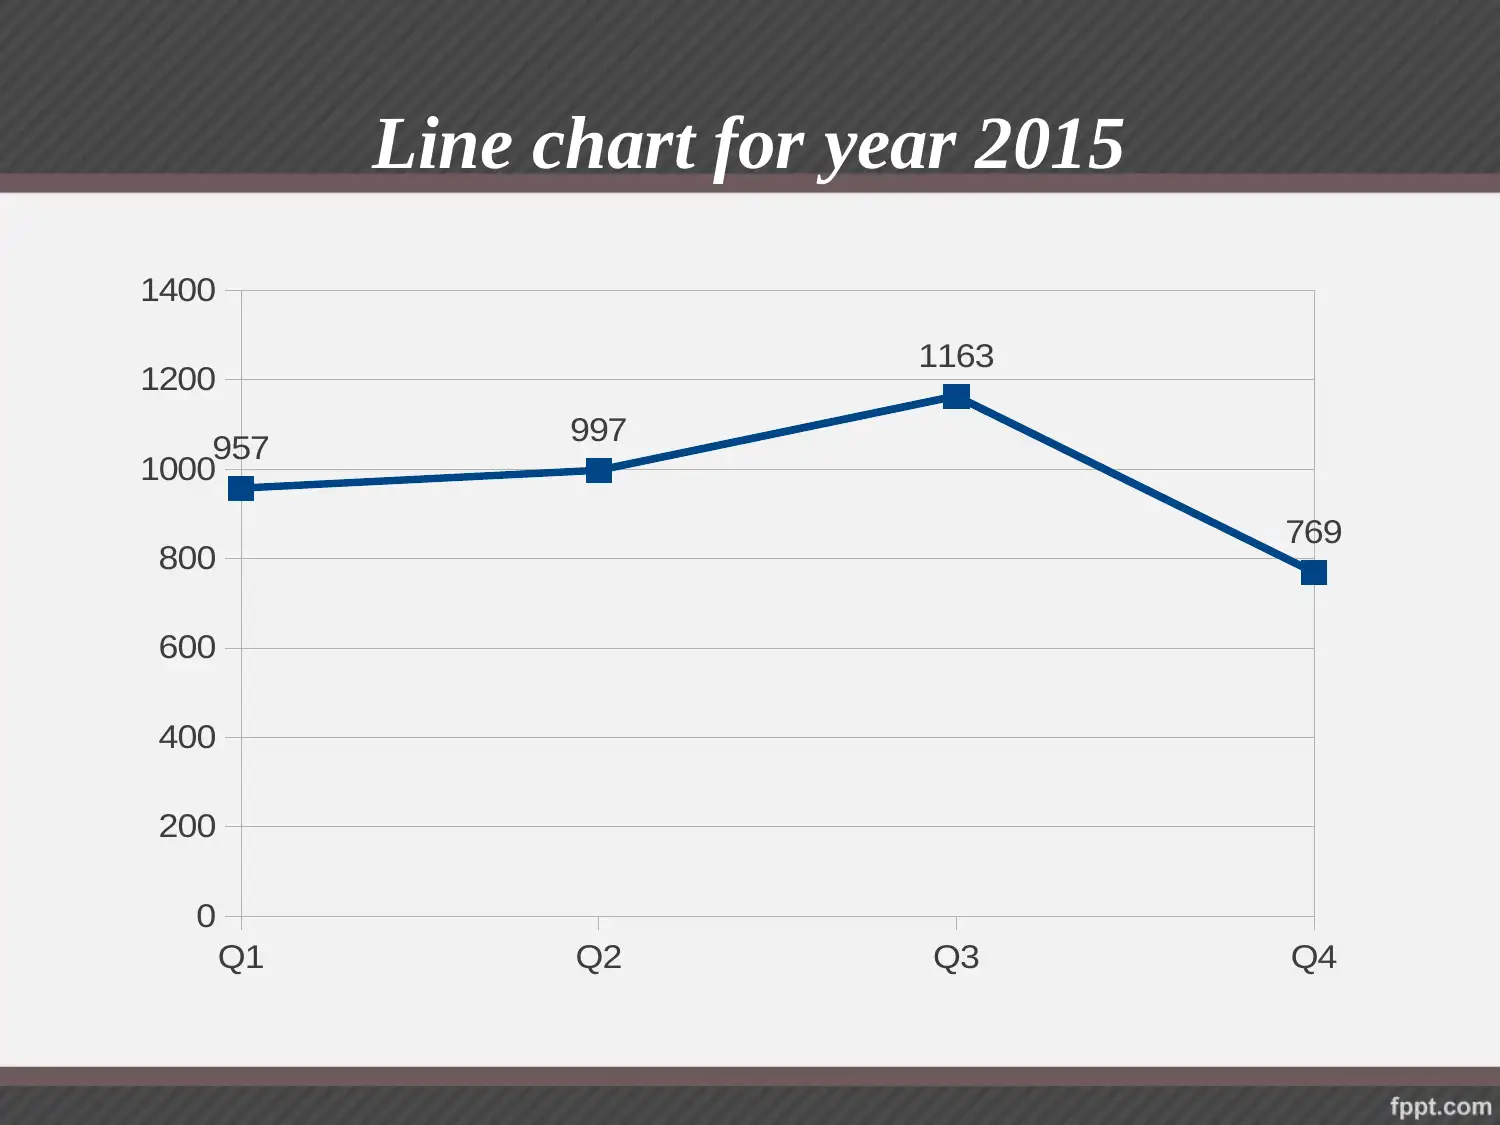
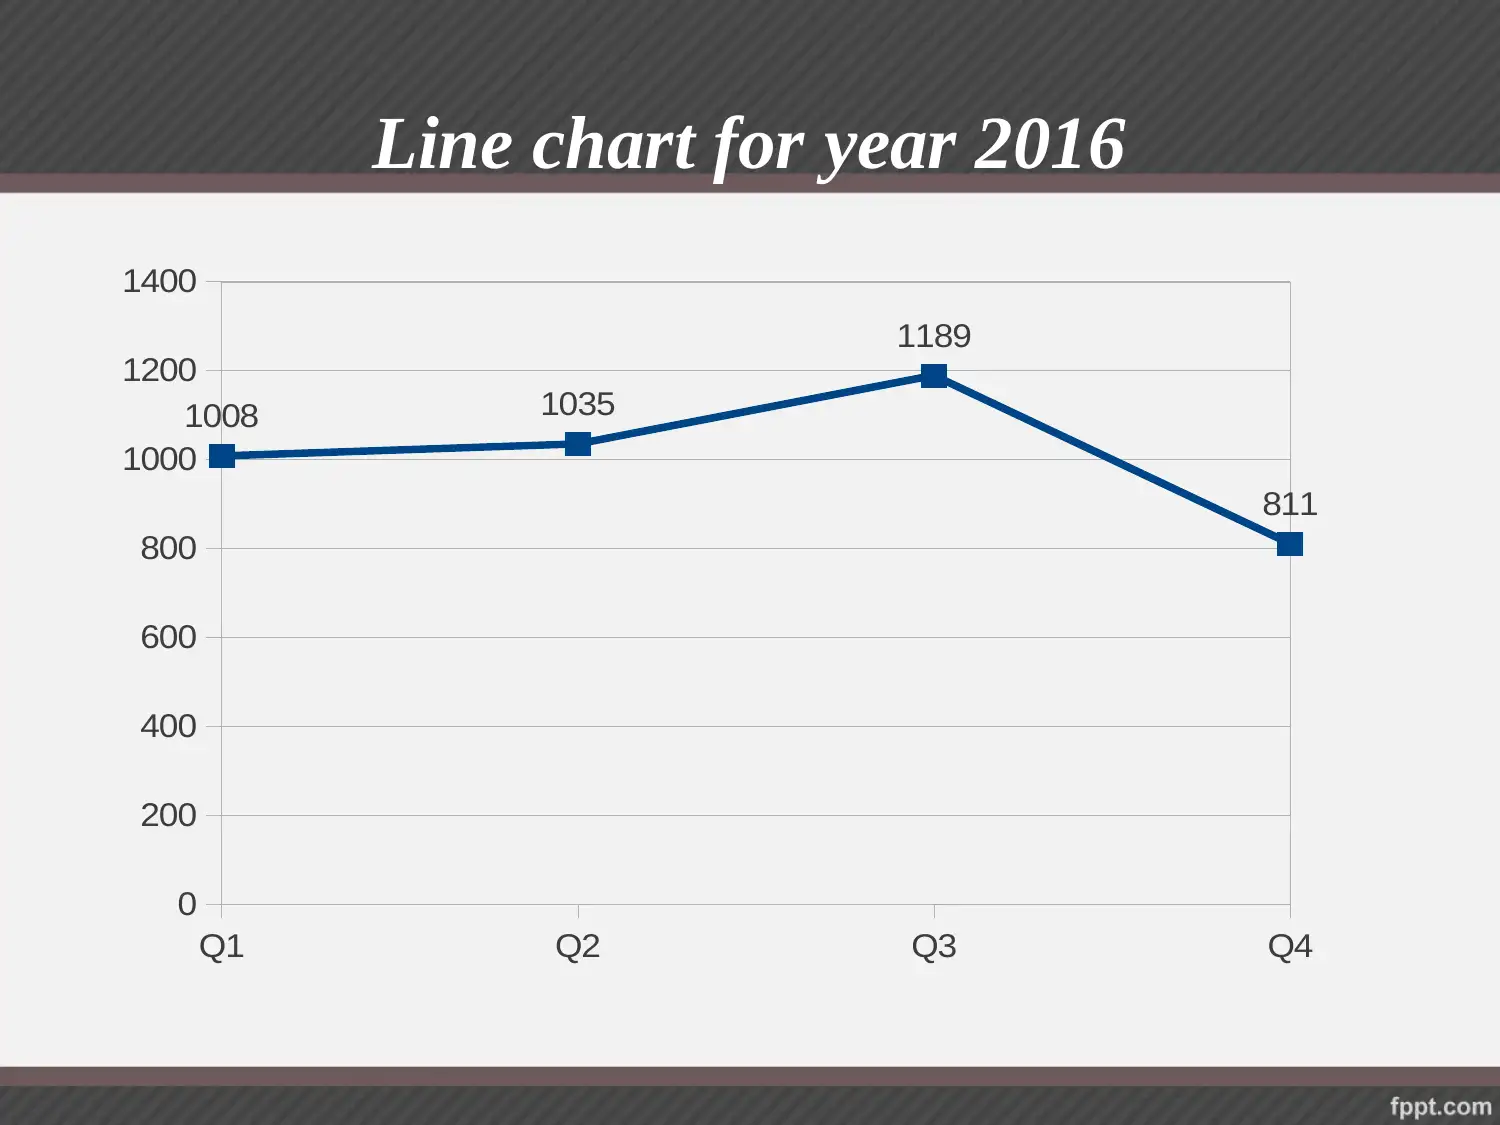
This report focuses on utilizing data presentation methods for effective business decision-making. It includes interpretations of pie charts, bar charts, and line charts for the years 2014, 2015, and 2016, highlighting the increasing business performance over time. Trend lines are also analyzed to predict future performance based on current data. The report references relevant literature on principal component analysis and property investment appraisal, providing a comprehensive overview of data-driven business analysis. Desklib offers additional resources for students seeking solved assignments and study materials.
1 out of 19
Related Documents


Your All-in-One AI-Powered Toolkit for Academic Success.
+13062052269
info@desklib.com
Available 24*7 on WhatsApp / Email
![[object Object]](/_next/static/media/star-bottom.7253800d.svg)
Copyright © 2020–2026 A2Z Services. All Rights Reserved. Developed and managed by ZUCOL.