Data Collection and Statistical Analysis in Business Decision Making
VerifiedAdded on 2023/04/04
|13
|3361
|151
Report
AI Summary
This report analyzes business decision-making through data collection and statistical tools, focusing on a restaurant's expansion into a new market. It outlines a plan for collecting primary and secondary data, utilizing questionnaires and annual reports, respectively, to understand customer behavior and market trends. The report discusses survey methodologies, including online surveys and sampling techniques like stratified, cluster, simple random, and convenience sampling. A sample questionnaire is provided to gather customer preferences. Furthermore, the study incorporates descriptive statistics such as mean, median, and mode to analyze sales data, alongside measures of dispersion and correlation coefficients to provide a comprehensive understanding of the data. This assignment is available on Desklib, where students can find similar solved assignments and past papers.

BUSINESS DECISION MAKING
Paraphrase This Document
Need a fresh take? Get an instant paraphrase of this document with our AI Paraphraser
TABLE OF CONTENTS
INTRODUCTION.......................................................................................................................................3
TASK 1Plan for collecting different types of data...................................................................................3
TASK 3Questionnaire for the research....................................................................................................6
TASK 4 Descriptive statistics..................................................................................................................8
Task 5 Measures of dispersion.................................................................................................................9
Task 6 Use of statistical tools correlation coefficient and quartile as well as percentile........................10
CONCLUSION.........................................................................................................................................11
REFERENCES..........................................................................................................................................12
INTRODUCTION
In the business there are various types of complex and typical situations are arises which are
necessary to resolve. In order to this, there are various tools and techniques are available on the basis of
which such complex decisions are taken. The current case study is based on the restaurant which is going
to expand in the another country. Due to the respective reason it wants to analyze and research. The report
shows about the plan for data collection through which information and data are to be collected further
research. Describes about the research questionnaire which will be distribute for analysis. In the second
part, the study looks upon the statistical tools and techniques like as mean, mode, median, standard
deviation, correlation, quartiles, percentiles etc.
TASK 1Plan for collecting different types of data
When a scholar is going to analyze about the research and particular topic then data and
information’s are necessary. These are plays as a raw material of the overall analysis and
research because without information it is not possible to carry out appropriate research. Data
collection is a method in which various information gathered using several techniques and frame
into structure for further analysis. Moreover, there are various types of techniques and methods
are available with the help of which the investigator collect and gather data. Further, there are
mainly two types of information as well as data are collected by the scholar for analyse about the
selected topic and research problem (Sullivan-Bolyai, Bova and Singh, 2012). Furthermore, both
kinds of approaches are like as primary as well as the secondary which are based on different
methods. The primary data collection is mainly based on the qualitative method through which
highly appropriate as well as reliable data are to be gathered. On the basis of primary data
collection the scholar get proper, current, true and reliable data which is the most required for
such analysis. On the other side with the help of secondary approach old data are collected which
not show current market trend and scenario of the firm and industry as well. Hence, it can be
assessed that most of the scholars use the primary method of collecting data due to its
appropriateness and reliableness.
Those types of data and informations which are gathered by the investigator at the first
time by analysing in the market with one hand are known as primary data. For collecting primary
type of data there are number of sources are available which helps to the researcher to collect
data up to greater level. The primary sources are like as survey, interviews, questionnaire, group
⊘ This is a preview!⊘
Do you want full access?
Subscribe today to unlock all pages.
Trusted by 1+ million students worldwide
discussion, observation etc. When the scholar uses such kind of sources then he able to know that
in the market currently which kind of trend is going on. Apart from this, the data which are
already collected, used as well as published by the another investigator or scholar are called as
secondary data (Taylor, Bogdan and DeVault, 2015). On the basis of another data the researcher
determine past information and trend which is less helpful to carry out the current research as
well as analysis. In this case also there are wide ranges of sources available with the scholar
which helps to take and gather secondary information. The sources of another data collection
technique are like as publications, newspapers, articles, templates etc. by which the investigator
gather usable information.
In the current scenario the restaurant is going to open a new branch in another market for
which the present research is carry on. For collect and gather the data to know buying behaviour,
tests and preferences, wants, requirements etc. of the customers related to food items there are
primary and secondary both the methods are used by scholar. The primary data are collected for
survey about the restaurant there is questionnaire are to be framed as well as designed by the
analyser. Further, the questionnaire which are framed that are distributed among the local
community of the country where the restaurant currently operates. The questionnaire are
distributed among local community as well as customers of the country (Kerr and et.al., 2014).
On the other side secondary data are gathered using annual report of the restaurant. On the basis
of selected secondary source i.e. annual report the scholar able to derive sales, profit and another
financial data for the current research. Hence, it can be said that to collect primary and secondary
data the investigator uses questionnaire and annual report respectively.
Task2 Survey methodology as well as technique for taking sample data
The method with the help of survey is conducted as well as questionnaire are distributed
among the respondents is called as a survey methodology. In the current case, marketing
manager want to know about the responses of customers and local community related to the
restaurant and then gather data. in order to carry out survey in present report there is online
methodology is to be used by the scholar. Further, with the help of online tools like as direct e-
mail, social media networks etc. the framed questionnaire distributed to the local community.
Apart from this, responses as well as feedbacks from the potential and selected respondents are
taken through online. This is one of the most used survey methodology because it takes very less
time to carry out the whole research (Palinkas and et.al., 2015).
Paraphrase This Document
Need a fresh take? Get an instant paraphrase of this document with our AI Paraphraser
In addition to this, there are too much people and local community is available and it is
not possible to take feedbacks and suggestions from the whole. For this, it is compulsory to
determine and take sample for analyse properly and appropriate research. There are several kinds
of methods as well as techniques are to be used by the investigator to assess sample data from the
whole local community. The methods are elaborated as below:
Stratified sampling method: As per current technique the sample data are collected on
the basis of different demographic factors. The overall local community is to be divided
into small groups as per the marital status, age, gender, living standard, income,
education etc. It is one of the mostly used methods for taking sample from the available
whole local community. Here the small groups are made such as income of the people,
age of their, which type and level of education etc (Stewart and et.al., 2013). Further, the
questionnaire is to be emailed and distribute among them and analysed.
Cluster sampling method: Another method of the sampling for assess the sample data
from whole available local community is cluster. In this, there are the different kinds of
geographic factors and locations are considered for analysing and researching for the
current business problem. The respective type of method of sampling divides the whole
area in small small areas for conduct survey and carries out the research. According to the
region wise the survey is to be conducted and questionnaire distributed as per the areas.
Moreover, the respective kind of sampling method is mostly used for carry out marketing
research and takes appropriate decisions.
Simple random sampling method: The respective type of method to collect sample data
is based on the randomly and very easy for the investigators. When the scholar is going to
derive the sample data then there are any kinds of parameters and theories are not used
while using the current method. It is the widely used technique for taking sample due to
its simplicity and easiness (Kinalis and et.al., 2014). When the researcher take sample
from the local community of the country then it uses the simple random method. On the
basis of this appropriate and effective sample is to be assessed and then designed
questionnaire distributed between them.
Convenience method of sampling: The last and other type of sampling technique is
convenience where the scholar takes and derives sample data on the basis of their
understanding. In this type of sampling technique also there are any parameters and
theories are not used by the investigator. It is very less used sampling method by the
researcher for determining sample data because it sometimes not gives effective data
(Jimenez-Soto and et.al., 2014).
In the current case the restaurant is going to expand its business where questionnaire are
distributed in local community. Further, to take sample data in current case simple random
sampling method is used and data derived randomly basis. The sample of 40 people is to be
taken at here and among them the questionnaire is to be distributed for analysing about their
buying behavior etc.
TASK 3Questionnaire for the research
Name...
Age....
Income....
1. In the month time period how frequent you visit the Murano restaurant in order to take lunch
or dinner.
2-3 ( )
4-5 ( )
5-6 ( )
2. Are you agree with the fact that Murano restaurant is making available excellent quality
service to the people in its premises?
Agree ()
Strongly agree ()
Neutral ()
Disagree ()
Strongly disagree ()
Highly dissatisfied ()
3. It is normally observed that there are multiple factors that heavily affect the individual choice
about the restaurant. Some factors are given below, out of these factors which one mostly affects
your choice of restaurant.
Interior ( )
Amenities ( )
⊘ This is a preview!⊘
Do you want full access?
Subscribe today to unlock all pages.
Trusted by 1+ million students worldwide
Proximity to home ( )
Hygiene ( )
4. Interior create a good image of the premises or restaurant among the people and is ann
important tool of the advertising appeal?
Yes ()
No ()
5. There are number of dishes that are available in the market. Which sort of below give dish you
often prefer to eat.?
Spicy ()
Healthier ()
Both ()
6. Employees of the Murano restaurant are making available ordered item on time to the people?
Agree ( )
Strongly agree ( )
Neutral ( )
Disagree ( )
Strongly disagree ( )
7.Employees of our restaurant are behaving with full courtesy to the customers that visit our
restaurant?
Agree ( )
Strongly agree ( )
Neutral ( )
Disagree ( )
Strongly disagree ( )
8. There are number of competitors of the Murano restaurant. Below a list of some of the
competitors of our restaurant is given. Which of below given restaurant is the major competitor
of Murano restaurant?
Balti palace ()
Blackfriars restaurant ()
Food for friends ()
Paraphrase This Document
Need a fresh take? Get an instant paraphrase of this document with our AI Paraphraser
9. Dishes are available at the appropriate price in the Murano restaurant. Do you agree with
mentioned statement?
Agree ()
Strongly agree ()
Neutral ()
Disagree ()
Highly disagree()
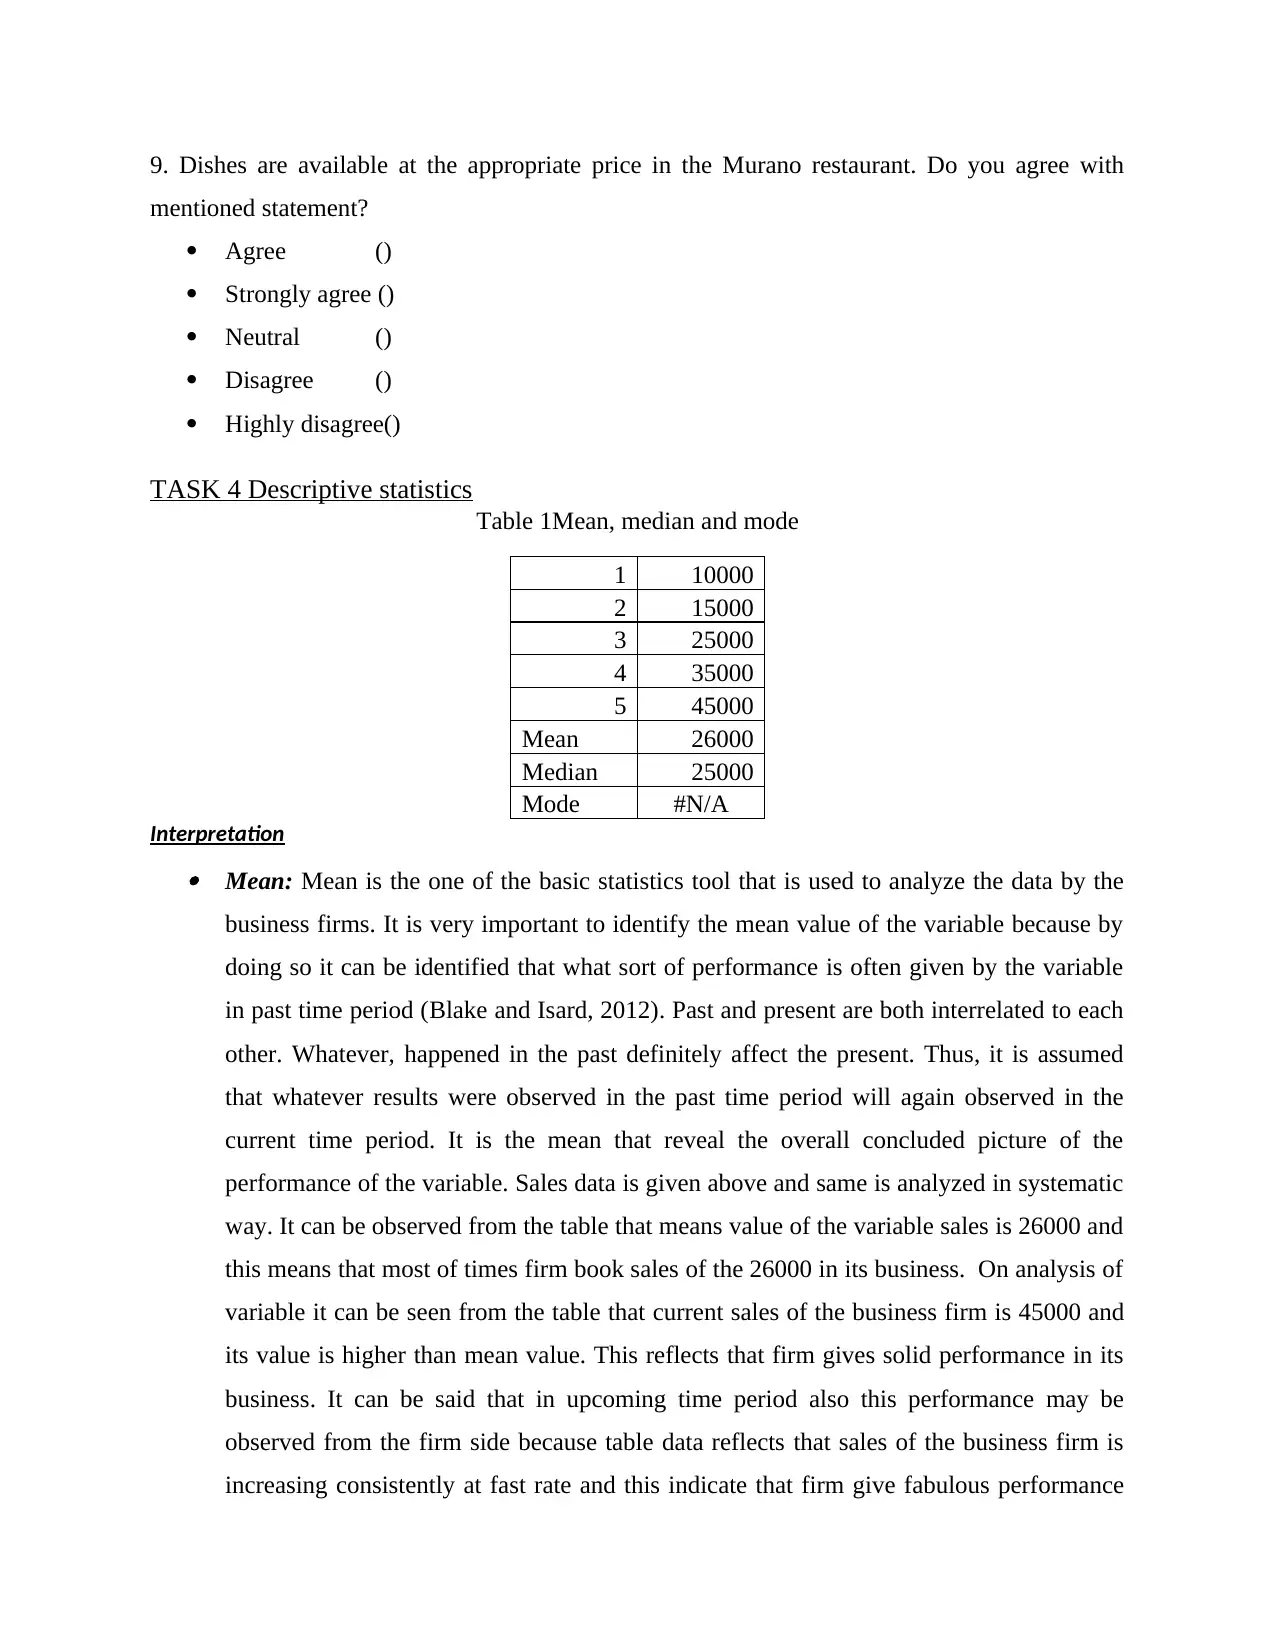
TASK 4 Descriptive statistics
Table 1Mean, median and mode
1 10000
2 15000
3 25000
4 35000
5 45000
Mean 26000
Median 25000
Mode #N/A
Interpretation Mean: Mean is the one of the basic statistics tool that is used to analyze the data by the
business firms. It is very important to identify the mean value of the variable because by
doing so it can be identified that what sort of performance is often given by the variable
in past time period (Blake and Isard, 2012). Past and present are both interrelated to each
other. Whatever, happened in the past definitely affect the present. Thus, it is assumed
that whatever results were observed in the past time period will again observed in the
current time period. It is the mean that reveal the overall concluded picture of the
performance of the variable. Sales data is given above and same is analyzed in systematic
way. It can be observed from the table that means value of the variable sales is 26000 and
this means that most of times firm book sales of the 26000 in its business. On analysis of
variable it can be seen from the table that current sales of the business firm is 45000 and
its value is higher than mean value. This reflects that firm gives solid performance in its
business. It can be said that in upcoming time period also this performance may be
observed from the firm side because table data reflects that sales of the business firm is
increasing consistently at fast rate and this indicate that firm give fabulous performance
mentioned statement?
Agree ()
Strongly agree ()
Neutral ()
Disagree ()
Highly disagree()
TASK 4 Descriptive statistics
Table 1Mean, median and mode
1 10000
2 15000
3 25000
4 35000
5 45000
Mean 26000
Median 25000
Mode #N/A
Interpretation Mean: Mean is the one of the basic statistics tool that is used to analyze the data by the
business firms. It is very important to identify the mean value of the variable because by
doing so it can be identified that what sort of performance is often given by the variable
in past time period (Blake and Isard, 2012). Past and present are both interrelated to each
other. Whatever, happened in the past definitely affect the present. Thus, it is assumed
that whatever results were observed in the past time period will again observed in the
current time period. It is the mean that reveal the overall concluded picture of the
performance of the variable. Sales data is given above and same is analyzed in systematic
way. It can be observed from the table that means value of the variable sales is 26000 and
this means that most of times firm book sales of the 26000 in its business. On analysis of
variable it can be seen from the table that current sales of the business firm is 45000 and
its value is higher than mean value. This reflects that firm gives solid performance in its
business. It can be said that in upcoming time period also this performance may be
observed from the firm side because table data reflects that sales of the business firm is
increasing consistently at fast rate and this indicate that firm give fabulous performance
in its business. Hence, it can be concluded that in the upcoming time period also sales of
the business firm will be enhanced. Median: Median is another important tool that is used for analysis of data. It can be
observed that it is the tool that divides entire set of data in to multiple parts (Bland,
2015). It is usually observed that analysts find it hard to analyze the data in the systematic
way. This is because data size is so huge and it is very difficult to identify multiple trends
that are hidden in the data set. It can be seen from the table that median value is 25000.
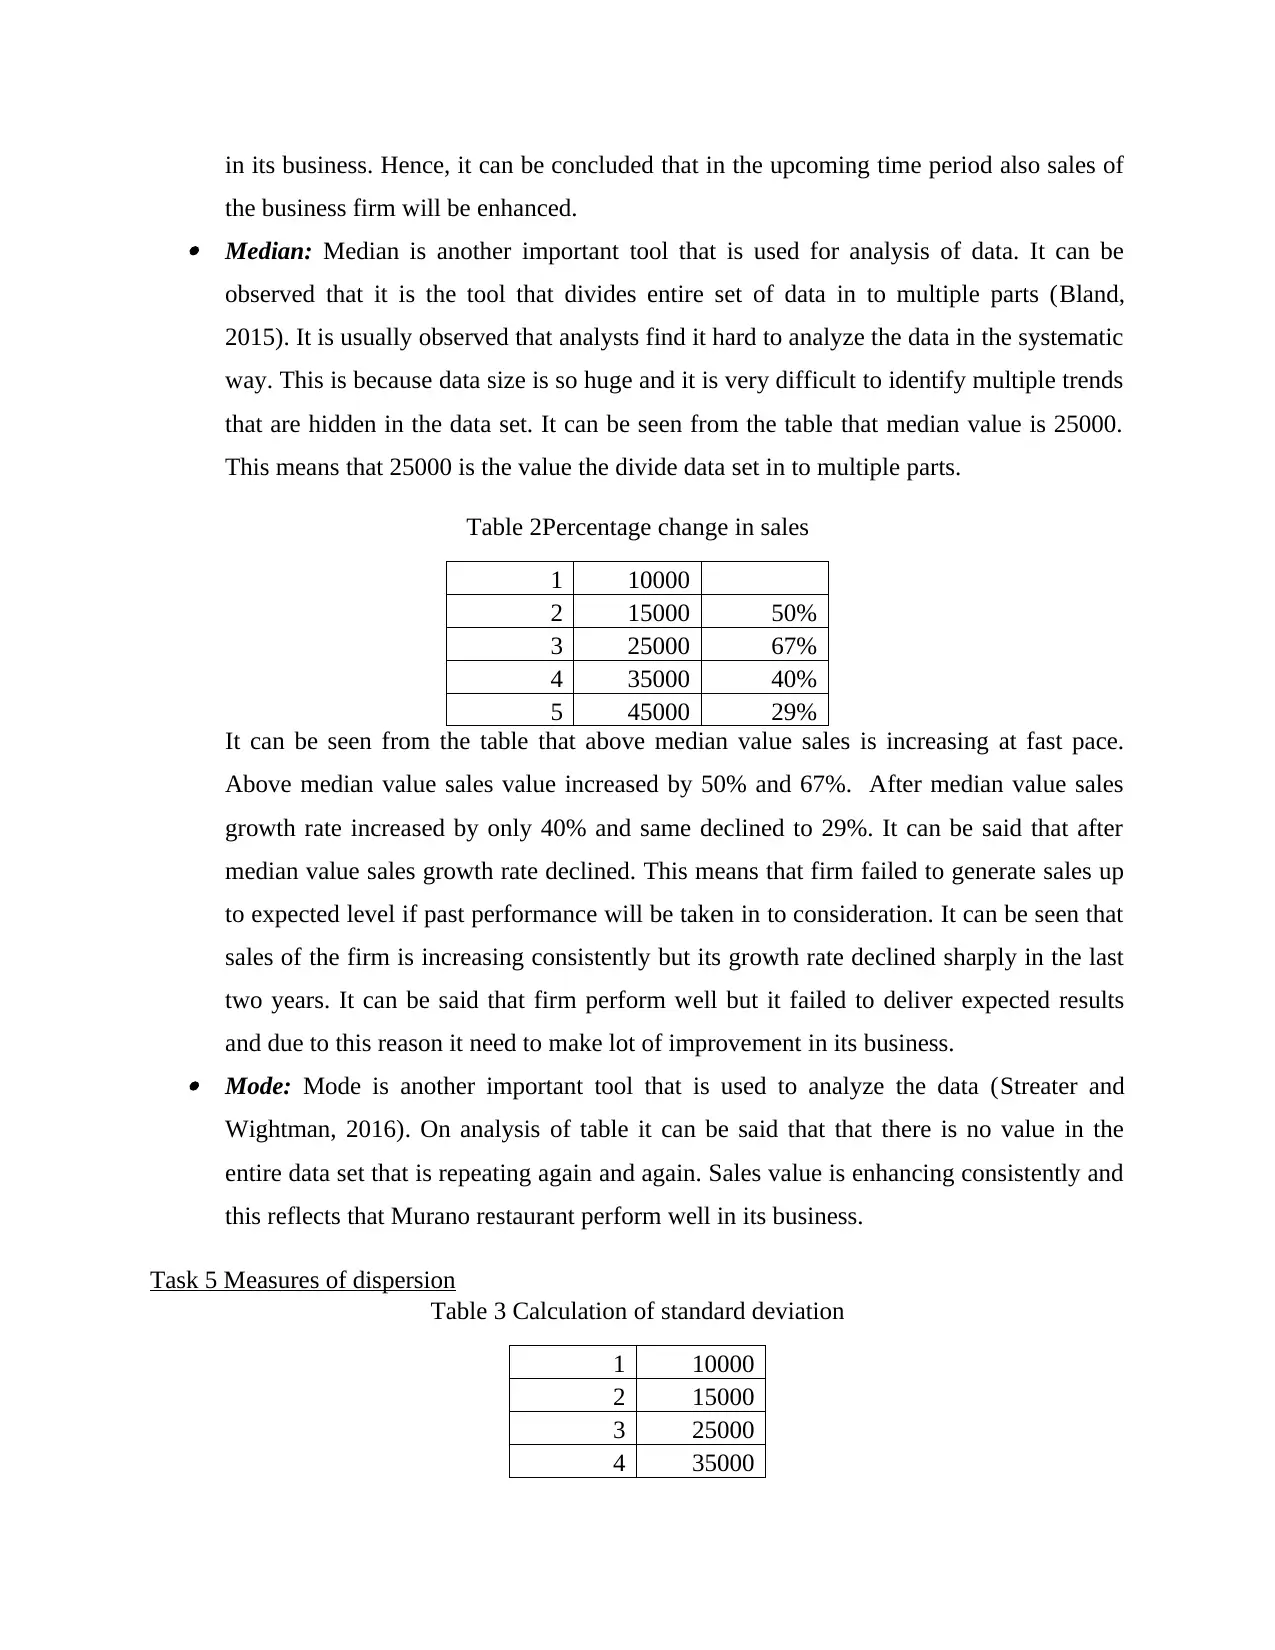
This means that 25000 is the value the divide data set in to multiple parts.
Table 2Percentage change in sales
1 10000
2 15000 50%
3 25000 67%
4 35000 40%
5 45000 29%
It can be seen from the table that above median value sales is increasing at fast pace.
Above median value sales value increased by 50% and 67%. After median value sales
growth rate increased by only 40% and same declined to 29%. It can be said that after
median value sales growth rate declined. This means that firm failed to generate sales up
to expected level if past performance will be taken in to consideration. It can be seen that
sales of the firm is increasing consistently but its growth rate declined sharply in the last
two years. It can be said that firm perform well but it failed to deliver expected results
and due to this reason it need to make lot of improvement in its business. Mode: Mode is another important tool that is used to analyze the data (Streater and
Wightman, 2016). On analysis of table it can be said that that there is no value in the
entire data set that is repeating again and again. Sales value is enhancing consistently and
this reflects that Murano restaurant perform well in its business.
Task 5 Measures of dispersion
Table 3 Calculation of standard deviation
1 10000
2 15000
3 25000
4 35000
the business firm will be enhanced. Median: Median is another important tool that is used for analysis of data. It can be
observed that it is the tool that divides entire set of data in to multiple parts (Bland,
2015). It is usually observed that analysts find it hard to analyze the data in the systematic
way. This is because data size is so huge and it is very difficult to identify multiple trends
that are hidden in the data set. It can be seen from the table that median value is 25000.
This means that 25000 is the value the divide data set in to multiple parts.
Table 2Percentage change in sales
1 10000
2 15000 50%
3 25000 67%
4 35000 40%
5 45000 29%
It can be seen from the table that above median value sales is increasing at fast pace.
Above median value sales value increased by 50% and 67%. After median value sales
growth rate increased by only 40% and same declined to 29%. It can be said that after
median value sales growth rate declined. This means that firm failed to generate sales up
to expected level if past performance will be taken in to consideration. It can be seen that
sales of the firm is increasing consistently but its growth rate declined sharply in the last
two years. It can be said that firm perform well but it failed to deliver expected results
and due to this reason it need to make lot of improvement in its business. Mode: Mode is another important tool that is used to analyze the data (Streater and
Wightman, 2016). On analysis of table it can be said that that there is no value in the
entire data set that is repeating again and again. Sales value is enhancing consistently and
this reflects that Murano restaurant perform well in its business.
Task 5 Measures of dispersion
Table 3 Calculation of standard deviation
1 10000
2 15000
3 25000
4 35000
⊘ This is a preview!⊘
Do you want full access?
Subscribe today to unlock all pages.
Trusted by 1+ million students worldwide
5 45000
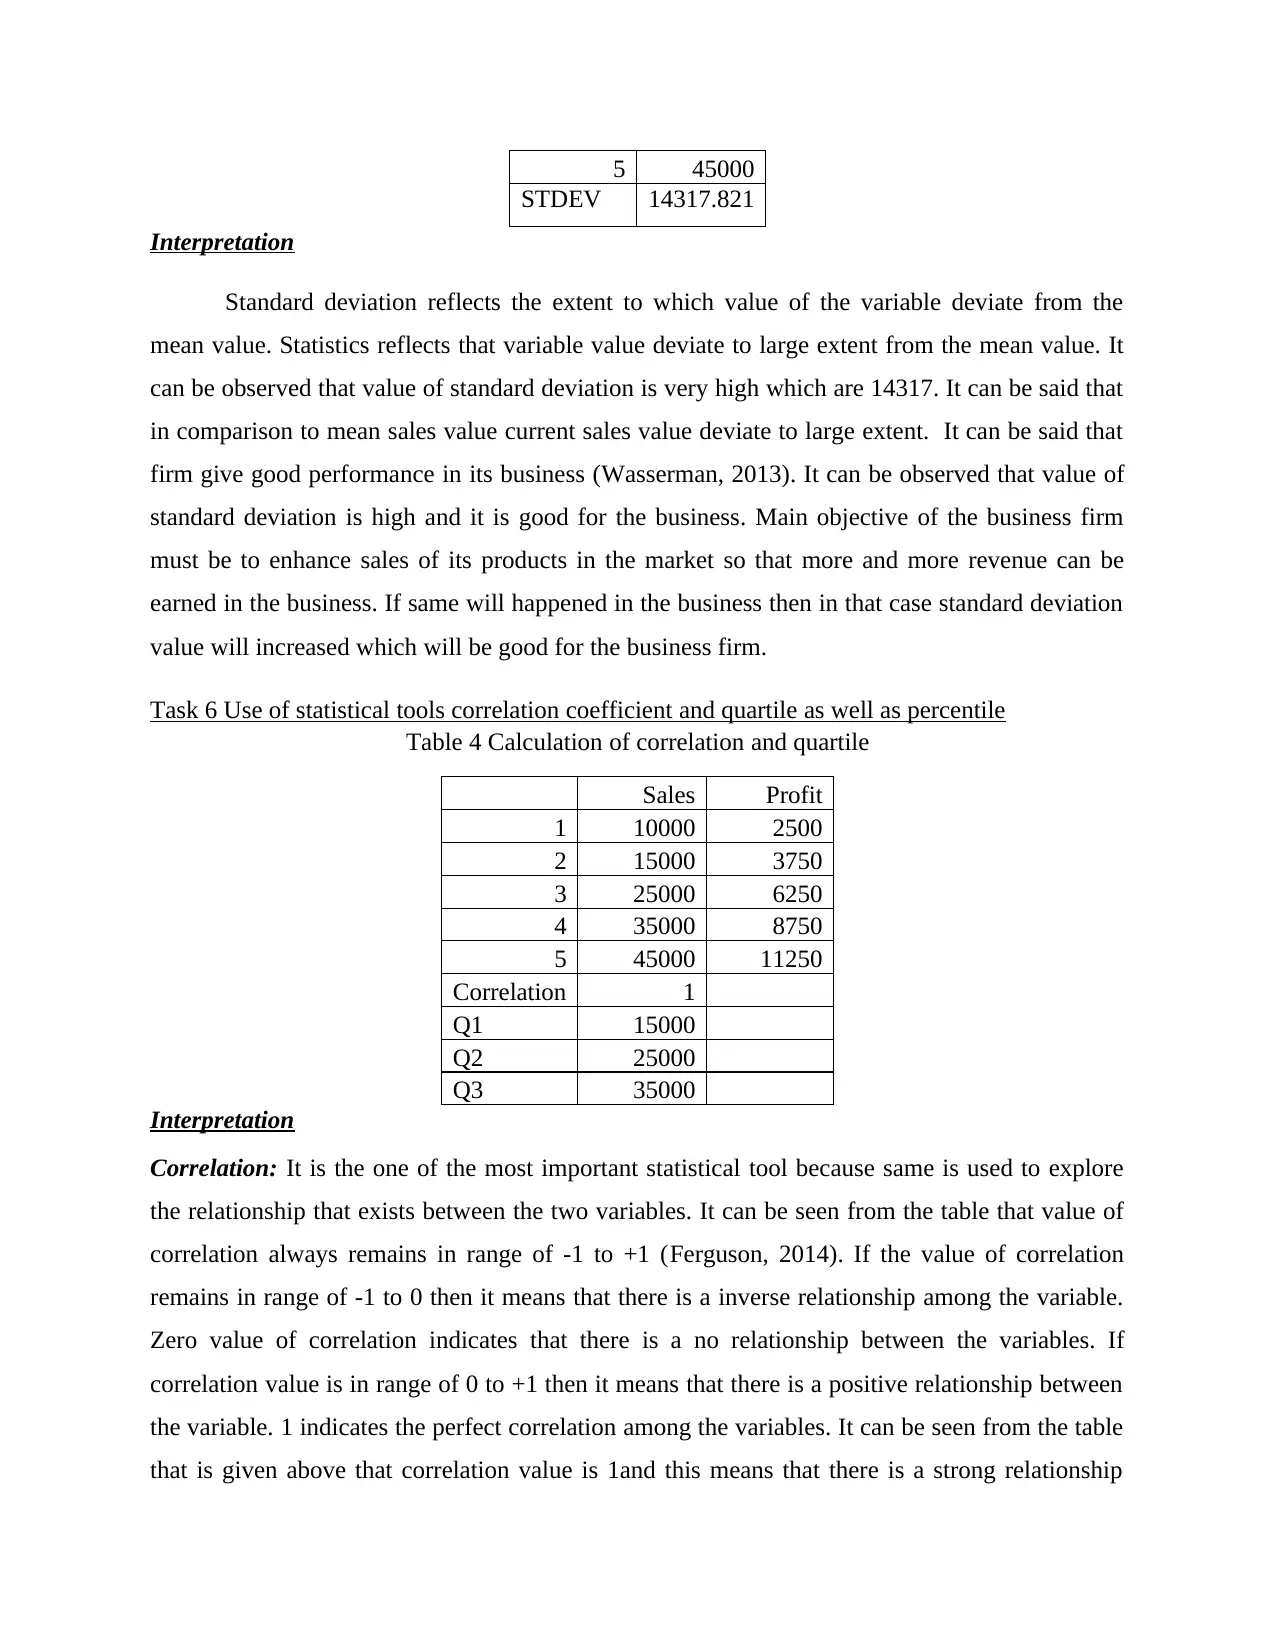
STDEV 14317.821
Interpretation
Standard deviation reflects the extent to which value of the variable deviate from the
mean value. Statistics reflects that variable value deviate to large extent from the mean value. It
can be observed that value of standard deviation is very high which are 14317. It can be said that
in comparison to mean sales value current sales value deviate to large extent. It can be said that
firm give good performance in its business (Wasserman, 2013). It can be observed that value of
standard deviation is high and it is good for the business. Main objective of the business firm
must be to enhance sales of its products in the market so that more and more revenue can be
earned in the business. If same will happened in the business then in that case standard deviation
value will increased which will be good for the business firm.
Task 6 Use of statistical tools correlation coefficient and quartile as well as percentile
Table 4 Calculation of correlation and quartile
Sales Profit
1 10000 2500
2 15000 3750
3 25000 6250
4 35000 8750
5 45000 11250
Correlation 1
Q1 15000
Q2 25000
Q3 35000
Interpretation
Correlation: It is the one of the most important statistical tool because same is used to explore
the relationship that exists between the two variables. It can be seen from the table that value of
correlation always remains in range of -1 to +1 (Ferguson, 2014). If the value of correlation
remains in range of -1 to 0 then it means that there is a inverse relationship among the variable.
Zero value of correlation indicates that there is a no relationship between the variables. If
correlation value is in range of 0 to +1 then it means that there is a positive relationship between
the variable. 1 indicates the perfect correlation among the variables. It can be seen from the table
that is given above that correlation value is 1and this means that there is a strong relationship
Paraphrase This Document
Need a fresh take? Get an instant paraphrase of this document with our AI Paraphraser
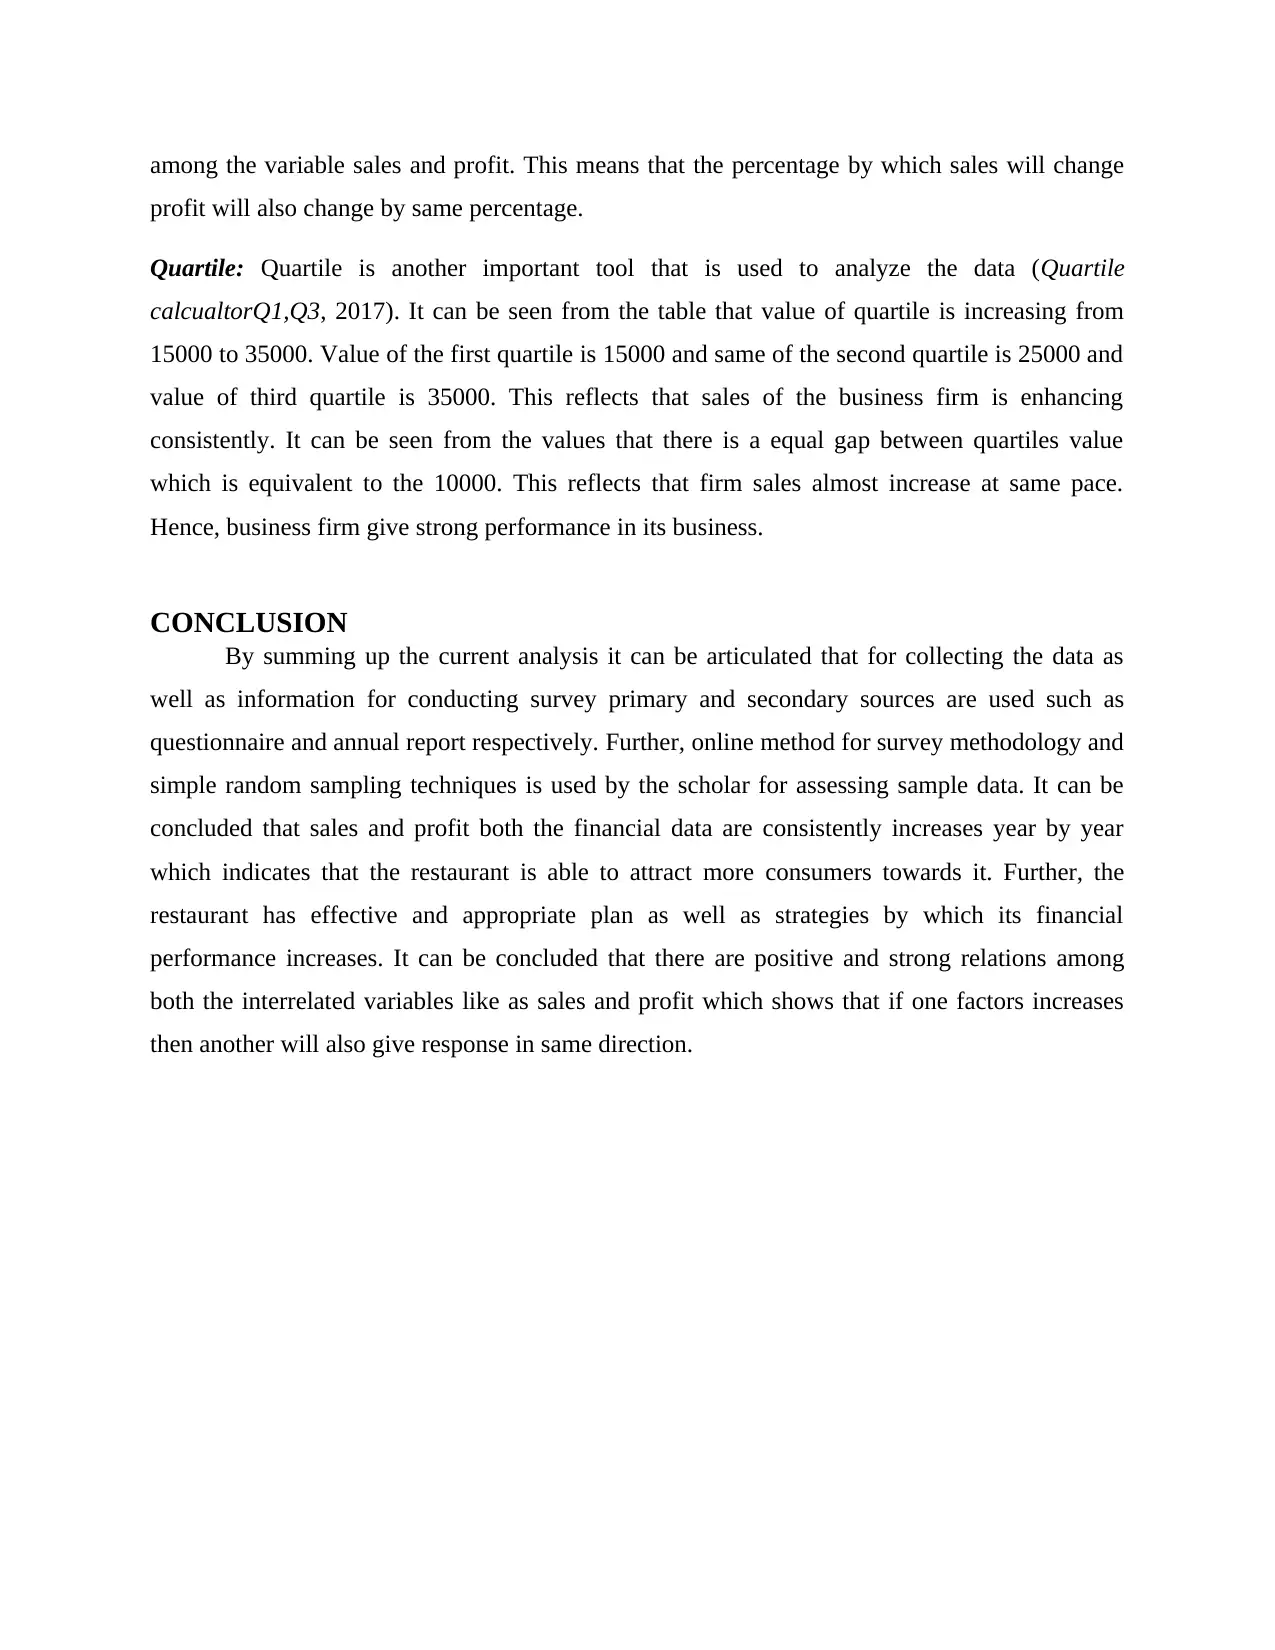
among the variable sales and profit. This means that the percentage by which sales will change
profit will also change by same percentage.
Quartile: Quartile is another important tool that is used to analyze the data (Quartile
calcualtorQ1,Q3, 2017). It can be seen from the table that value of quartile is increasing from
15000 to 35000. Value of the first quartile is 15000 and same of the second quartile is 25000 and
value of third quartile is 35000. This reflects that sales of the business firm is enhancing
consistently. It can be seen from the values that there is a equal gap between quartiles value
which is equivalent to the 10000. This reflects that firm sales almost increase at same pace.
Hence, business firm give strong performance in its business.
CONCLUSION
By summing up the current analysis it can be articulated that for collecting the data as
well as information for conducting survey primary and secondary sources are used such as
questionnaire and annual report respectively. Further, online method for survey methodology and
simple random sampling techniques is used by the scholar for assessing sample data. It can be
concluded that sales and profit both the financial data are consistently increases year by year
which indicates that the restaurant is able to attract more consumers towards it. Further, the
restaurant has effective and appropriate plan as well as strategies by which its financial
performance increases. It can be concluded that there are positive and strong relations among
both the interrelated variables like as sales and profit which shows that if one factors increases
then another will also give response in same direction.
REFERENCES
Books and journals
Blake, A. and Isard, M., 2012. Active contours: the application of techniques from graphics,
vision, control theory and statistics to visual tracking of shapes in motion. Springer
Science & Business Media.
Bland, M., 2015. An introduction to medical statistics. Oxford University Press (UK).
Ferguson, T.S., 2014. Mathematical statistics: A decision theoretic approach. Academic press.
Jimenez-Soto, E. and et.al., 2014. A framework for the economic analysis of data collection methods for
vital statistics. PloS one. 9(8). pp. e106234.
Kerr, Z. Y. and et.al., 2014. National Collegiate Athletic Association Injury Surveillance System: review
of methods for 2004–2005 through 2013–2014 data collection. Journal of athletic training. 49(4).
pp. 552-560.
Kinalis, A. and et.al., 2014. Biased sink mobility with adaptive stop times for low latency data collection
in sensor networks. Information fusion. 15. pp. 56-63.
Mertens, D. M., 2014. Research and evaluation in education and psychology: Integrating diversity with
quantitative, qualitative, and mixed methods. Sage publications.
Palinkas, L. and et.al., 2015. Purposeful sampling for qualitative data collection and analysis in mixed
method implementation research. Administration and Policy in Mental Health and Mental Health
Services Research. 42(5). pp. 533-544.
Schiller, J.S. and et.al., 2012. Summary health statistics for US Adults: National health interview
survey, 2010. Vital and Health Statistics. Series 10, Data from The National Health
Survey. (252). pp.1-207.
Stewart, M. C. and et.al., 2013. A comparison of histomorphometric data collection methods. Journal of
forensic sciences. 58(1). pp. 109-113.
Streater, R.F. and Wightman, A.S., 2016. PCT, spin and statistics, and all that. Princeton
University Press.
Sullivan-Bolyai, S., Bova, C. and Singh, M. D., 2012. Data-collection methods. Nursing Research in
Canada: Methods, Critical Appraisal, and Utilization. pp. 287.
⊘ This is a preview!⊘
Do you want full access?
Subscribe today to unlock all pages.
Trusted by 1+ million students worldwide
1 out of 13
Related Documents


Your All-in-One AI-Powered Toolkit for Academic Success.
+13062052269
info@desklib.com
Available 24*7 on WhatsApp / Email
![[object Object]](/_next/static/media/star-bottom.7253800d.svg)
Unlock your academic potential
Copyright © 2020–2026 A2Z Services. All Rights Reserved. Developed and managed by ZUCOL.