Business Decision Making and Analysis: Gillette's Strategy
VerifiedAdded on 2019/12/04
|19
|4078
|139
Report
AI Summary
This report provides a comprehensive analysis of Gillette's business decision-making process, focusing on the UK market. It begins with an introduction to business decision-making and its significance, followed by an examination of data collection methods, including primary and secondary research. The report details the design of a questionnaire, survey methodology, and sampling frame used for collecting customer data. The analysis includes summarizing collected data, calculating measures of dispersion, and utilizing quartile, percentile, and correlation coefficients to draw conclusions about sales and profitability trends. Spreadsheet graphs, including column, bar, and histograms, are used to visually represent the data, alongside trend line analysis for forecasting. The report also covers the creation of a Gantt chart for project planning and the application of financial tools for strategic decision-making, culminating in a formal business report and conclusion. The study highlights the importance of data-driven insights for enhancing customer satisfaction and achieving competitive advantages in the market.

Business Decision Making
Paraphrase This Document
Need a fresh take? Get an instant paraphrase of this document with our AI Paraphraser
TABLE OF CONTENTS
INTRODUCTION ..........................................................................................................................3
TASK 1............................................................................................................................................3
1.1 Creation of plan for collection of primary and secondary data for Gillette the UK business3
1.2 Presentation of survey methodology and sampling frame used for research.........................4
1.3 Designing questionnaire.........................................................................................................4
TASK 2............................................................................................................................................5
2.1 Summarizing data collected for Gillette................................................................................5
2.2 Analysis of results..................................................................................................................6
2.3 Analyzing data using measures of dispersion........................................................................6
2.4 Quartile, percentile and correlation coefficient to draw useful conclusions..........................7
TASK 3............................................................................................................................................8
3.1 Preparing range of graph using spreadsheets.........................................................................8
3.2 Creating trend line in spreadsheet graph..............................................................................12
3.3 Business presentation using suitable software and technique..............................................13
3.4 Producing formal business report........................................................................................13
TASK 4..........................................................................................................................................13
4.1 Appropriate information processing tools...........................................................................13
4.2 Project plan using Gantt chart for Gillette's strategy...........................................................14
4.3 Financial tools for decision making for Gillette's strategy..................................................15
CONLUSION ...............................................................................................................................17
REFERENCES..............................................................................................................................18
2
INTRODUCTION
Business decision making is regarded as one of the crucial organizational activity. It is
conducted with the aim to select suitable course of action that acts as an aid for the business in
achieving success (Morato, 2013). In the present study, business decision making has been
discussed in context of Gillette's case study. The company is one of the leading brands in shaving
industry. The present study entails to gain insight into the variety of sources which can be
utilized for collecting data. The report involves several techniques of analysing data with greater
effectiveness. The study covers the use of financial tools that can assist in decision making
process.
TASK 1
1.1 Creation of plan for collection of primary and secondary data for Gillette the UK business
Data collection is regarded as an essential activity of firm that aids in making appropriate
decisions. Gillette is one of the leading brands in shaving industry. Through analysis of the
behaviour of customers, organisation determine their taste and preferences. It supports Gillette in
the development of new product and attains success in the market. In the present report, data
collection will be carried out through means of primary and secondary sources. This will assist in
developing clear knowledge regarding the beliefs of consumers towards developing new product
for Gillette: Primary research: Through primary research, collection of fresh information can be
done. In this, information gathering is done for the first time through reaching selected
population directly (Newbold and et.al., 2010). Various tools can be used for the purpose
of collecting primary data. This involves techniques such as questionnaire, interview and
observation. In the present study, questionnaire is being utilized with the aim to make
evaluation of customer's perception regarding development of new product by Gillette.
Secondary research: In this, researcher evaluates studies carried out in the past that is
related with similar subject matter. This is considered as an effective technique that
assists in gathering information for attaining appropriate resultants (Yu, 2013). In the
present report, secondary data will be gathered through financial data, past studies and
new articles.
⊘ This is a preview!⊘
Do you want full access?
Subscribe today to unlock all pages.
Trusted by 1+ million students worldwide
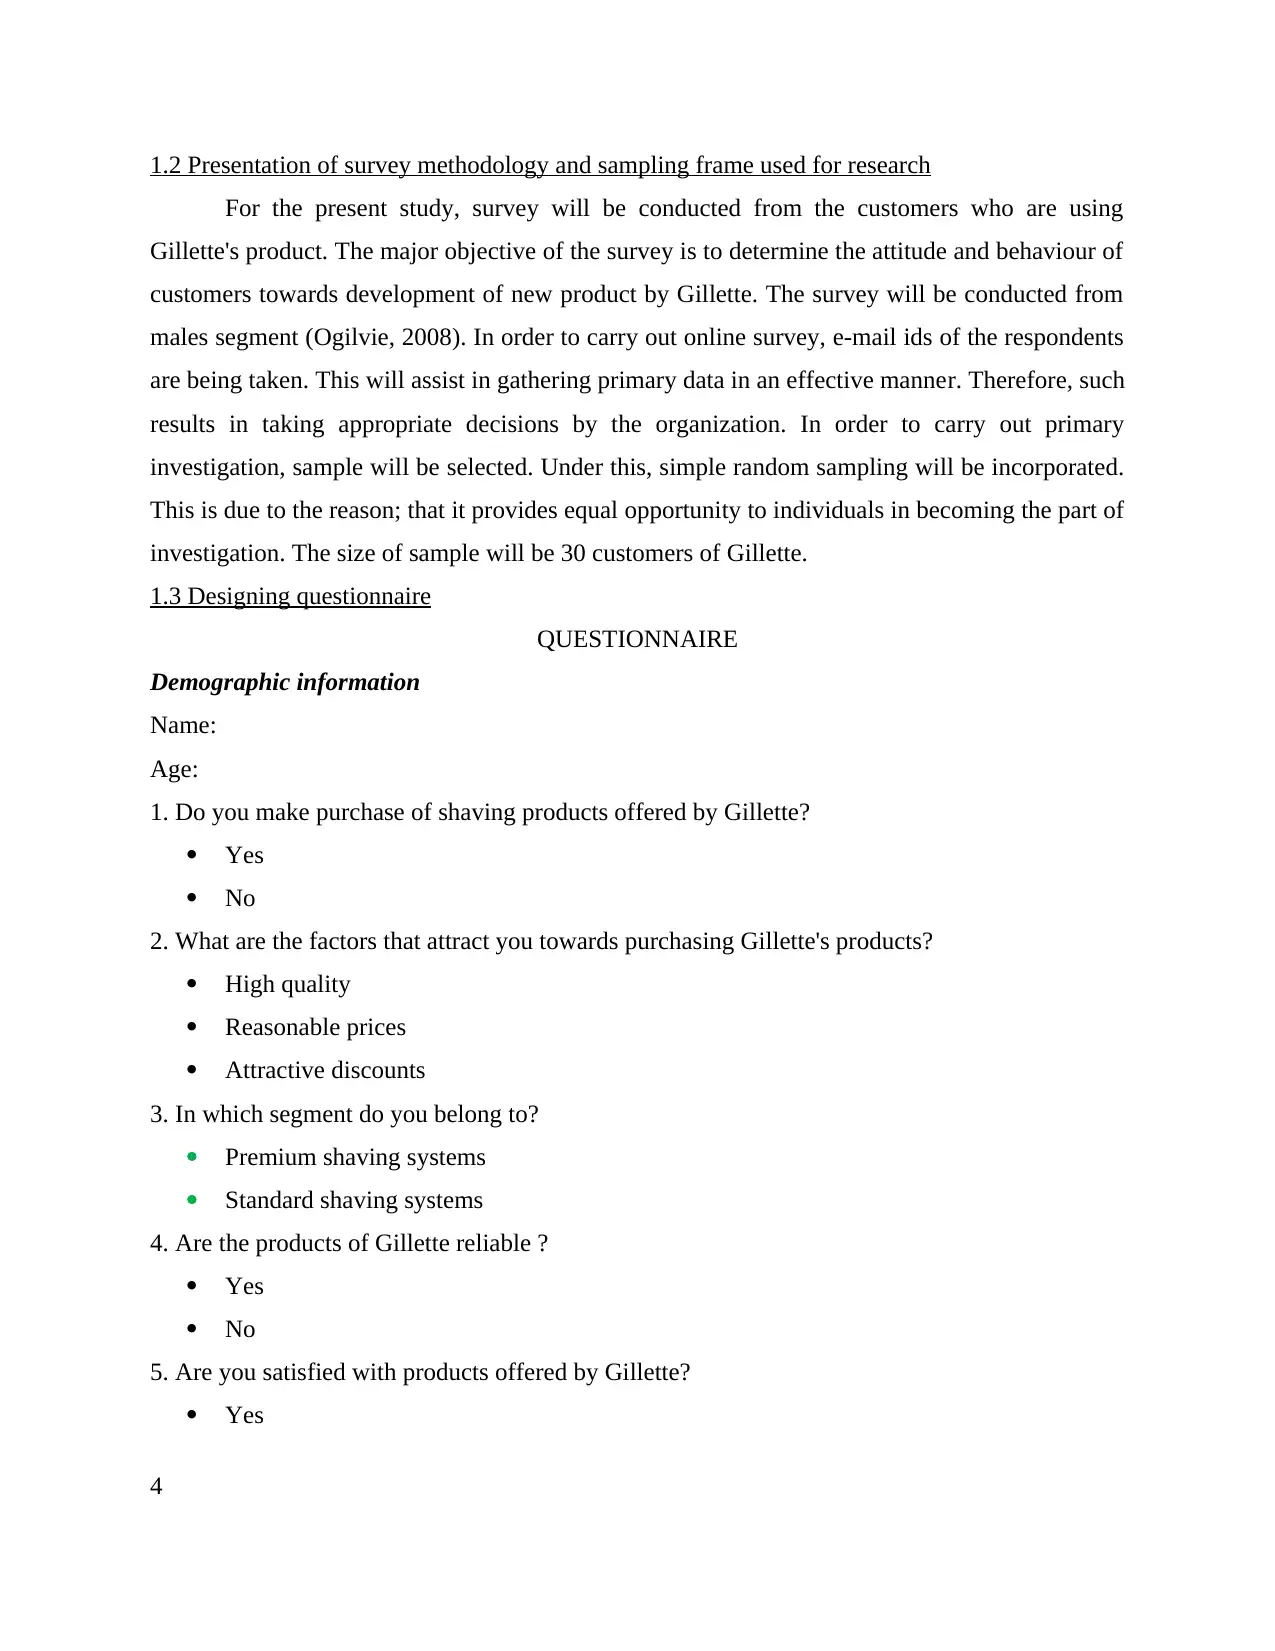
1.2 Presentation of survey methodology and sampling frame used for research
For the present study, survey will be conducted from the customers who are using
Gillette's product. The major objective of the survey is to determine the attitude and behaviour of
customers towards development of new product by Gillette. The survey will be conducted from
males segment (Ogilvie, 2008). In order to carry out online survey, e-mail ids of the respondents
are being taken. This will assist in gathering primary data in an effective manner. Therefore, such
results in taking appropriate decisions by the organization. In order to carry out primary
investigation, sample will be selected. Under this, simple random sampling will be incorporated.
This is due to the reason; that it provides equal opportunity to individuals in becoming the part of
investigation. The size of sample will be 30 customers of Gillette.
1.3 Designing questionnaire
QUESTIONNAIRE
Demographic information
Name:
Age:
1. Do you make purchase of shaving products offered by Gillette?
Yes
No
2. What are the factors that attract you towards purchasing Gillette's products?
High quality
Reasonable prices
Attractive discounts
3. In which segment do you belong to?
Premium shaving systems
Standard shaving systems
4. Are the products of Gillette reliable ?
Yes
No
5. Are you satisfied with products offered by Gillette?
Yes
4
Paraphrase This Document
Need a fresh take? Get an instant paraphrase of this document with our AI Paraphraser
No
6. Give recommendation for the improvement required in the development of new product?
______________________________________________________________________________
____________________________________________________________________________
TASK 2
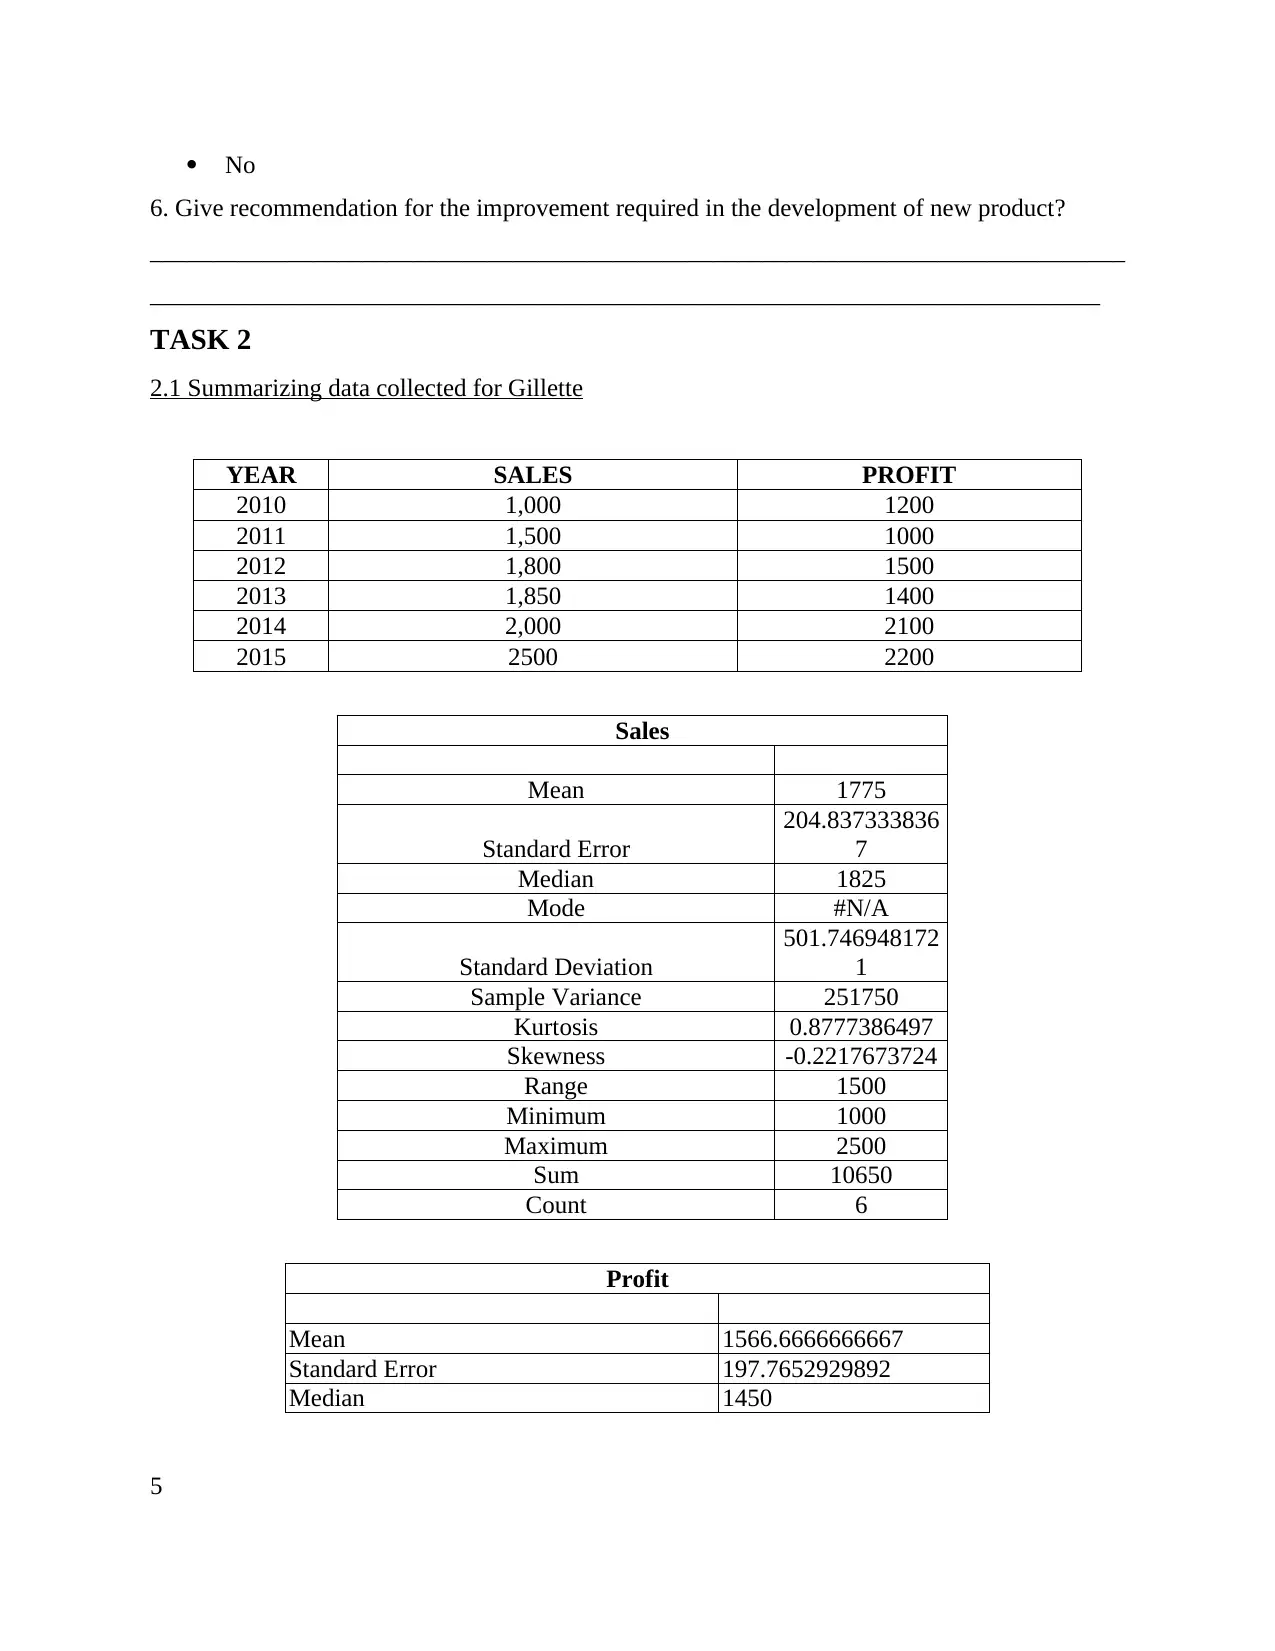
2.1 Summarizing data collected for Gillette
YEAR SALES PROFIT
2010 1,000 1200
2011 1,500 1000
2012 1,800 1500
2013 1,850 1400
2014 2,000 2100
2015 2500 2200
Sales
Mean 1775
Standard Error
204.837333836
7
Median 1825
Mode #N/A
Standard Deviation
501.746948172
1
Sample Variance 251750
Kurtosis 0.8777386497
Skewness -0.2217673724
Range 1500
Minimum 1000
Maximum 2500
Sum 10650
Count 6
Profit
Mean 1566.6666666667
Standard Error 197.7652929892
Median 1450
5
6. Give recommendation for the improvement required in the development of new product?
______________________________________________________________________________
____________________________________________________________________________
TASK 2
2.1 Summarizing data collected for Gillette
YEAR SALES PROFIT
2010 1,000 1200
2011 1,500 1000
2012 1,800 1500
2013 1,850 1400
2014 2,000 2100
2015 2500 2200
Sales
Mean 1775
Standard Error
204.837333836
7
Median 1825
Mode #N/A
Standard Deviation
501.746948172
1
Sample Variance 251750
Kurtosis 0.8777386497
Skewness -0.2217673724
Range 1500
Minimum 1000
Maximum 2500
Sum 10650
Count 6
Profit
Mean 1566.6666666667
Standard Error 197.7652929892
Median 1450
5
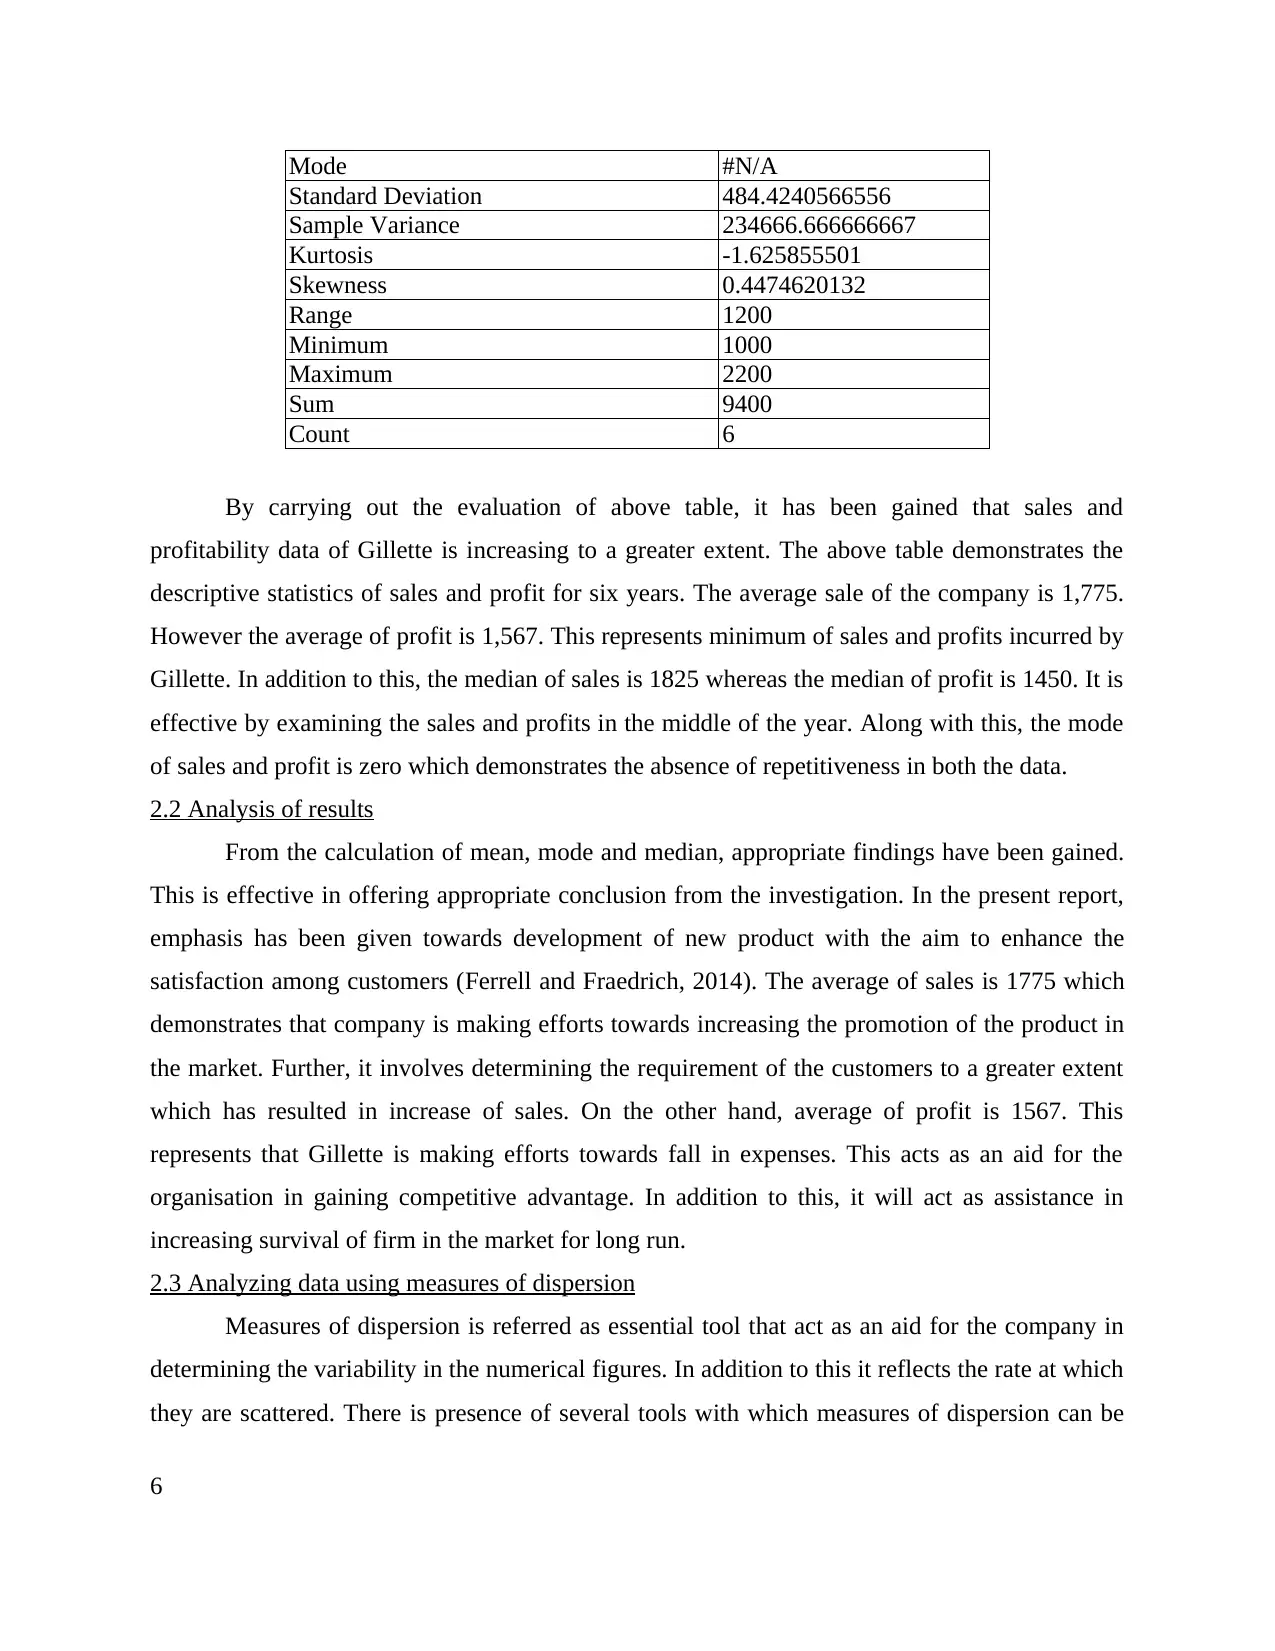
Mode #N/A
Standard Deviation 484.4240566556
Sample Variance 234666.666666667
Kurtosis -1.625855501
Skewness 0.4474620132
Range 1200
Minimum 1000
Maximum 2200
Sum 9400
Count 6
By carrying out the evaluation of above table, it has been gained that sales and
profitability data of Gillette is increasing to a greater extent. The above table demonstrates the
descriptive statistics of sales and profit for six years. The average sale of the company is 1,775.
However the average of profit is 1,567. This represents minimum of sales and profits incurred by
Gillette. In addition to this, the median of sales is 1825 whereas the median of profit is 1450. It is
effective by examining the sales and profits in the middle of the year. Along with this, the mode
of sales and profit is zero which demonstrates the absence of repetitiveness in both the data.
2.2 Analysis of results
From the calculation of mean, mode and median, appropriate findings have been gained.
This is effective in offering appropriate conclusion from the investigation. In the present report,
emphasis has been given towards development of new product with the aim to enhance the
satisfaction among customers (Ferrell and Fraedrich, 2014). The average of sales is 1775 which
demonstrates that company is making efforts towards increasing the promotion of the product in
the market. Further, it involves determining the requirement of the customers to a greater extent
which has resulted in increase of sales. On the other hand, average of profit is 1567. This
represents that Gillette is making efforts towards fall in expenses. This acts as an aid for the
organisation in gaining competitive advantage. In addition to this, it will act as assistance in
increasing survival of firm in the market for long run.
2.3 Analyzing data using measures of dispersion
Measures of dispersion is referred as essential tool that act as an aid for the company in
determining the variability in the numerical figures. In addition to this it reflects the rate at which
they are scattered. There is presence of several tools with which measures of dispersion can be
6
⊘ This is a preview!⊘
Do you want full access?
Subscribe today to unlock all pages.
Trusted by 1+ million students worldwide
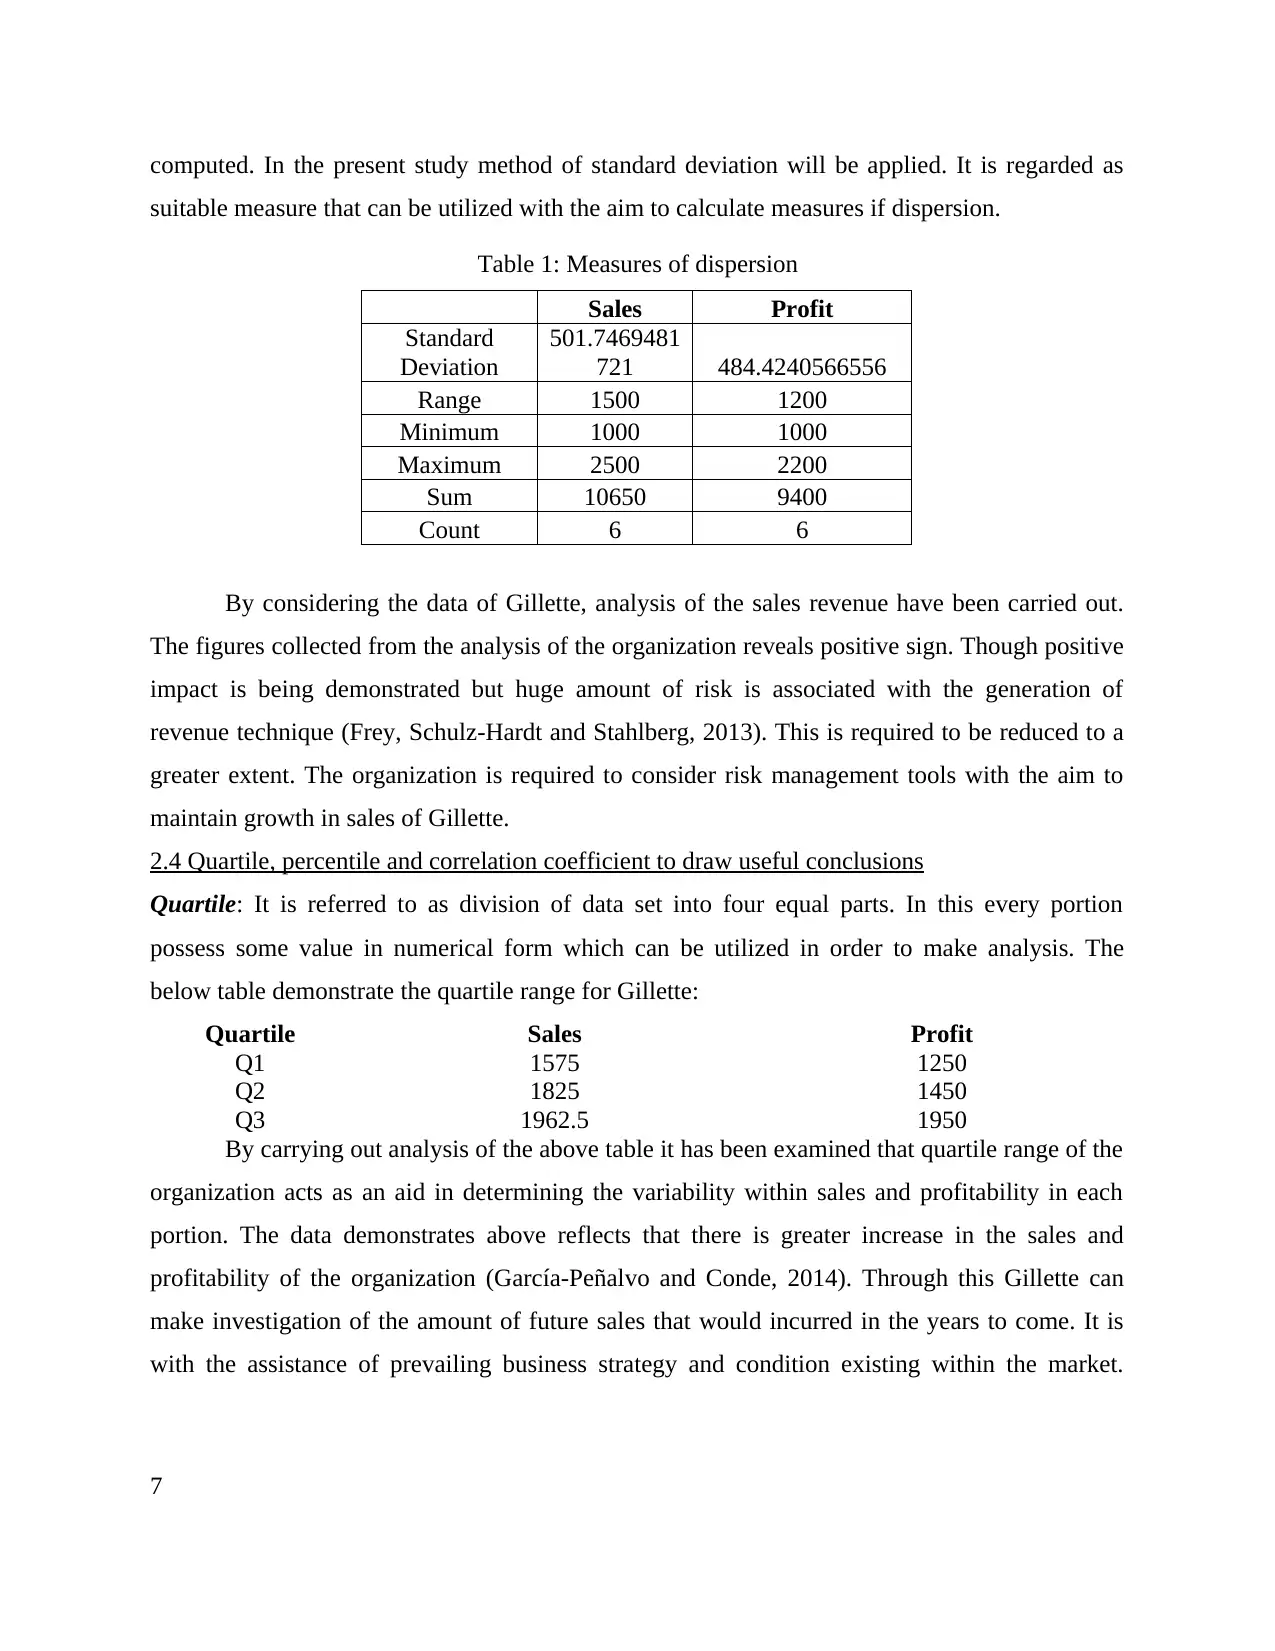
computed. In the present study method of standard deviation will be applied. It is regarded as
suitable measure that can be utilized with the aim to calculate measures if dispersion.
Table 1: Measures of dispersion
Sales Profit
Standard
Deviation
501.7469481
721 484.4240566556
Range 1500 1200
Minimum 1000 1000
Maximum 2500 2200
Sum 10650 9400
Count 6 6
By considering the data of Gillette, analysis of the sales revenue have been carried out.
The figures collected from the analysis of the organization reveals positive sign. Though positive
impact is being demonstrated but huge amount of risk is associated with the generation of
revenue technique (Frey, Schulz-Hardt and Stahlberg, 2013). This is required to be reduced to a
greater extent. The organization is required to consider risk management tools with the aim to
maintain growth in sales of Gillette.
2.4 Quartile, percentile and correlation coefficient to draw useful conclusions
Quartile: It is referred to as division of data set into four equal parts. In this every portion
possess some value in numerical form which can be utilized in order to make analysis. The
below table demonstrate the quartile range for Gillette:
Quartile Sales Profit
Q1 1575 1250
Q2 1825 1450
Q3 1962.5 1950
By carrying out analysis of the above table it has been examined that quartile range of the
organization acts as an aid in determining the variability within sales and profitability in each
portion. The data demonstrates above reflects that there is greater increase in the sales and
profitability of the organization (García-Peñalvo and Conde, 2014). Through this Gillette can
make investigation of the amount of future sales that would incurred in the years to come. It is
with the assistance of prevailing business strategy and condition existing within the market.
7
Paraphrase This Document
Need a fresh take? Get an instant paraphrase of this document with our AI Paraphraser
Therefore firm can investigate the future projects that can result in revenue generation for the
organization.
Percentile: It is considered as the tool that assists in categorizing the data set into 100 parts. It is
calculated with the aim to develop decision for long run. The table below reflects the
computation of percentile. The 25th percentile of Gillette for sales and profit is 1575 and 1250
respectively. On the other hand the value of 50th percentile for sales is 1825 whereas that of profit
it is 1450. This demonstrates there is effectiveness in the growth of organization. Therefore such
assist the business in taking appropriate strategic decisions.
Percentile Sales Profit
25th 1575 1250
50th 1825 1450
75th 1962.5 1950
Correlation: This technique has significant role in investigation the relationship between two
variables (Goetsch and Davis, 2014). Researcher has collected secondary information in relation
to profitability of the firm. The table below reflects correlation among sales and profit:
Sales Profit
Sales 1
Profit 0.826962118 1
Correlation coefficient is divided into two. This can be positive and negative. In case
when the range of correlation is between -1 to 0 then such demonstrates that variable are not
related in an effective way. The above calculation demonstrates that correlation between sales
and profit is 82%. This reveals that variables are highly correlated. Such implies that there is
huge impact of one factor on another. There is greater significance for Gillette to take into
account both the variables with the aim to take appropriate decisions for the firm to a greater
extent.
TASK 3
3.1 Preparing range of graph using spreadsheets
Column graph of sales and profitability of Gillette
8
Bar graph of sales and profit of Gillette
9
1 2 3 4 5 6
0
500
1000
1500
2000
2500
3000
Sales
Profit
9
1 2 3 4 5 6
0
500
1000
1500
2000
2500
3000
Sales
Profit
⊘ This is a preview!⊘
Do you want full access?
Subscribe today to unlock all pages.
Trusted by 1+ million students worldwide
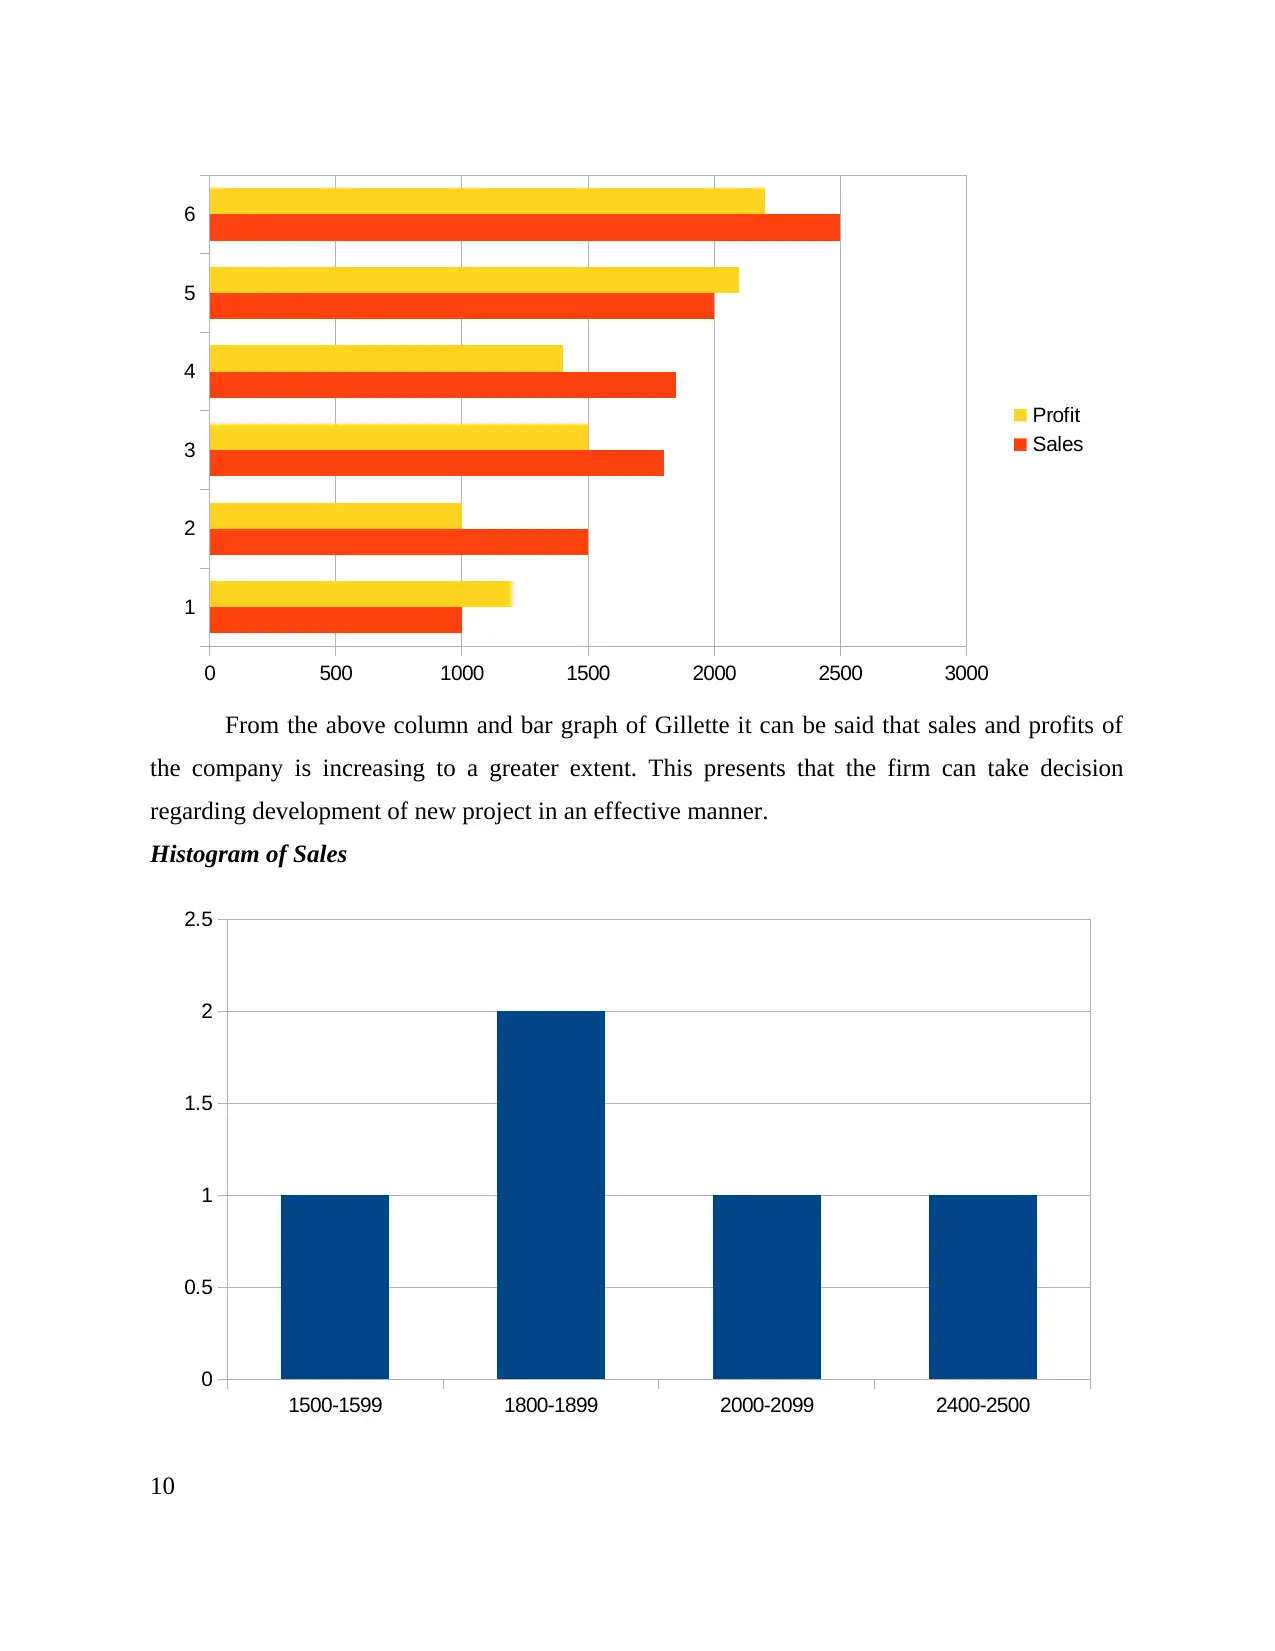
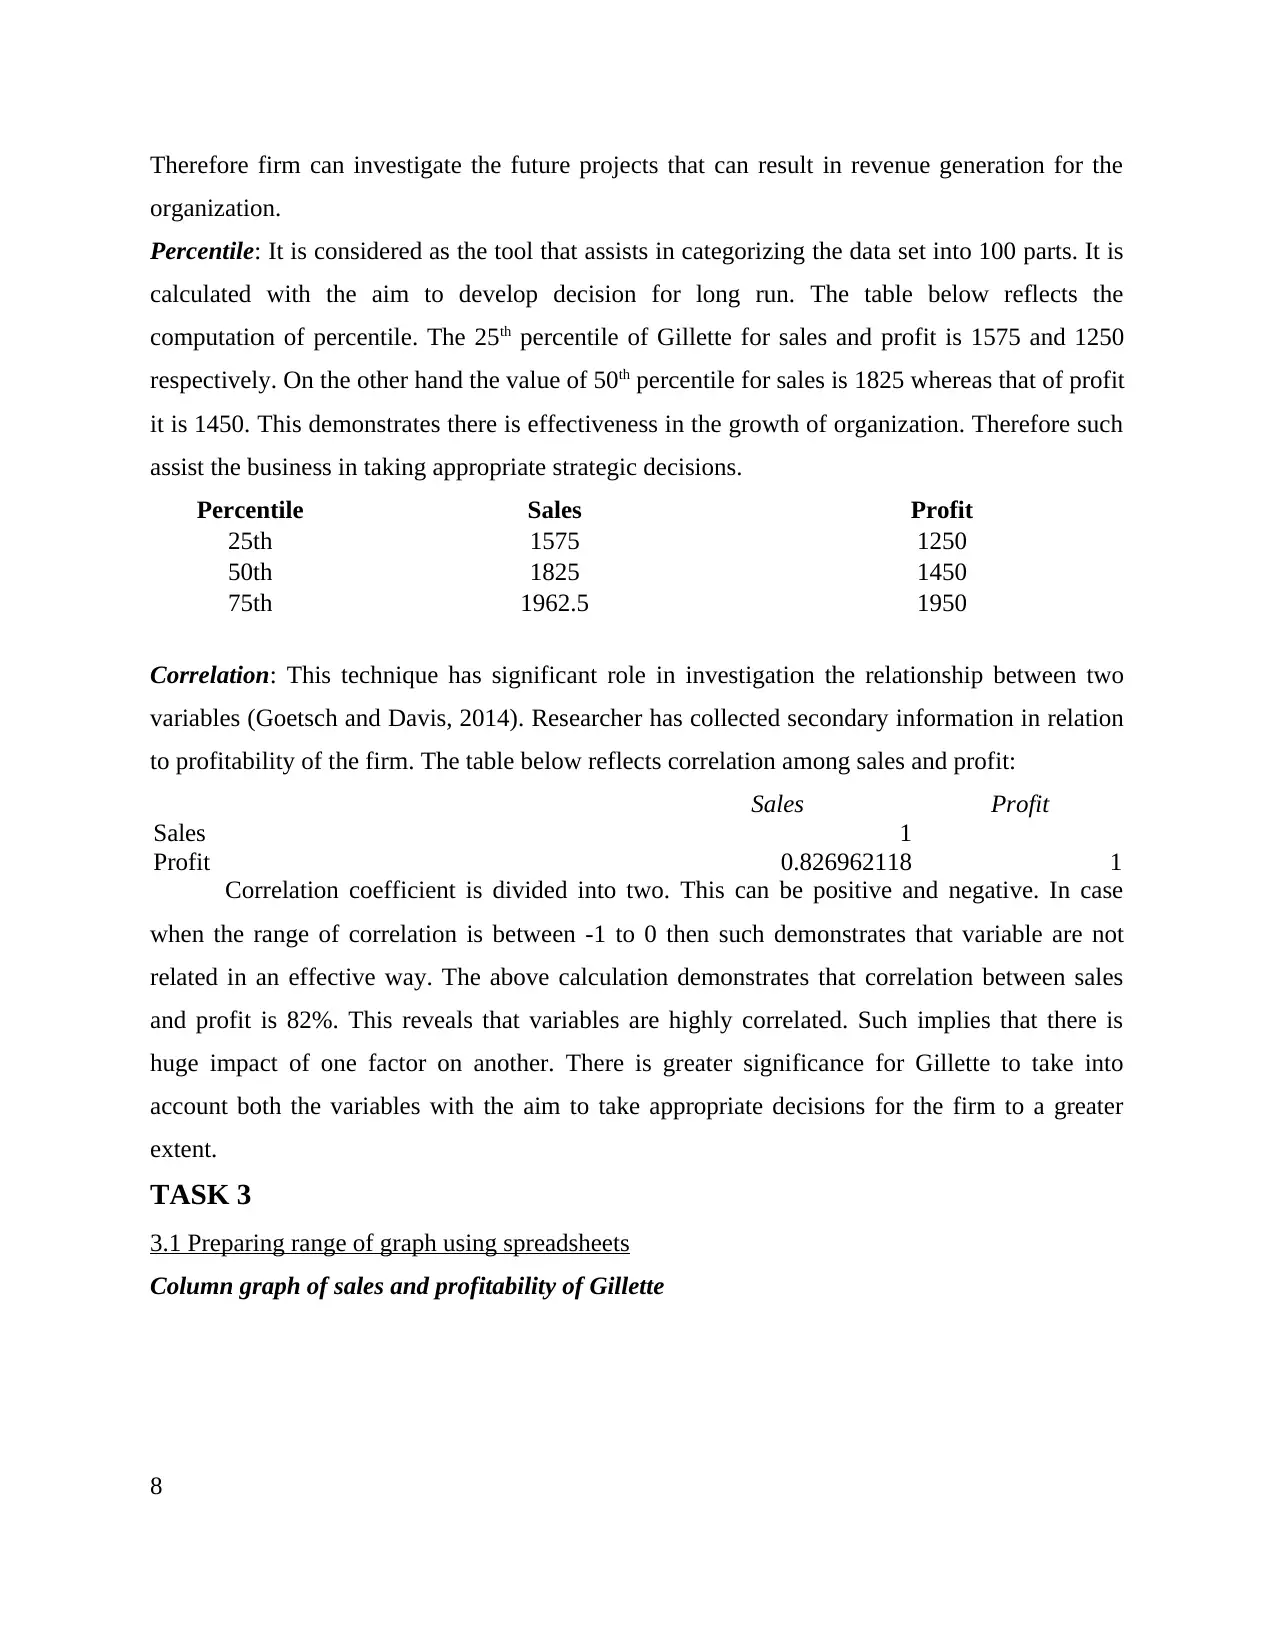
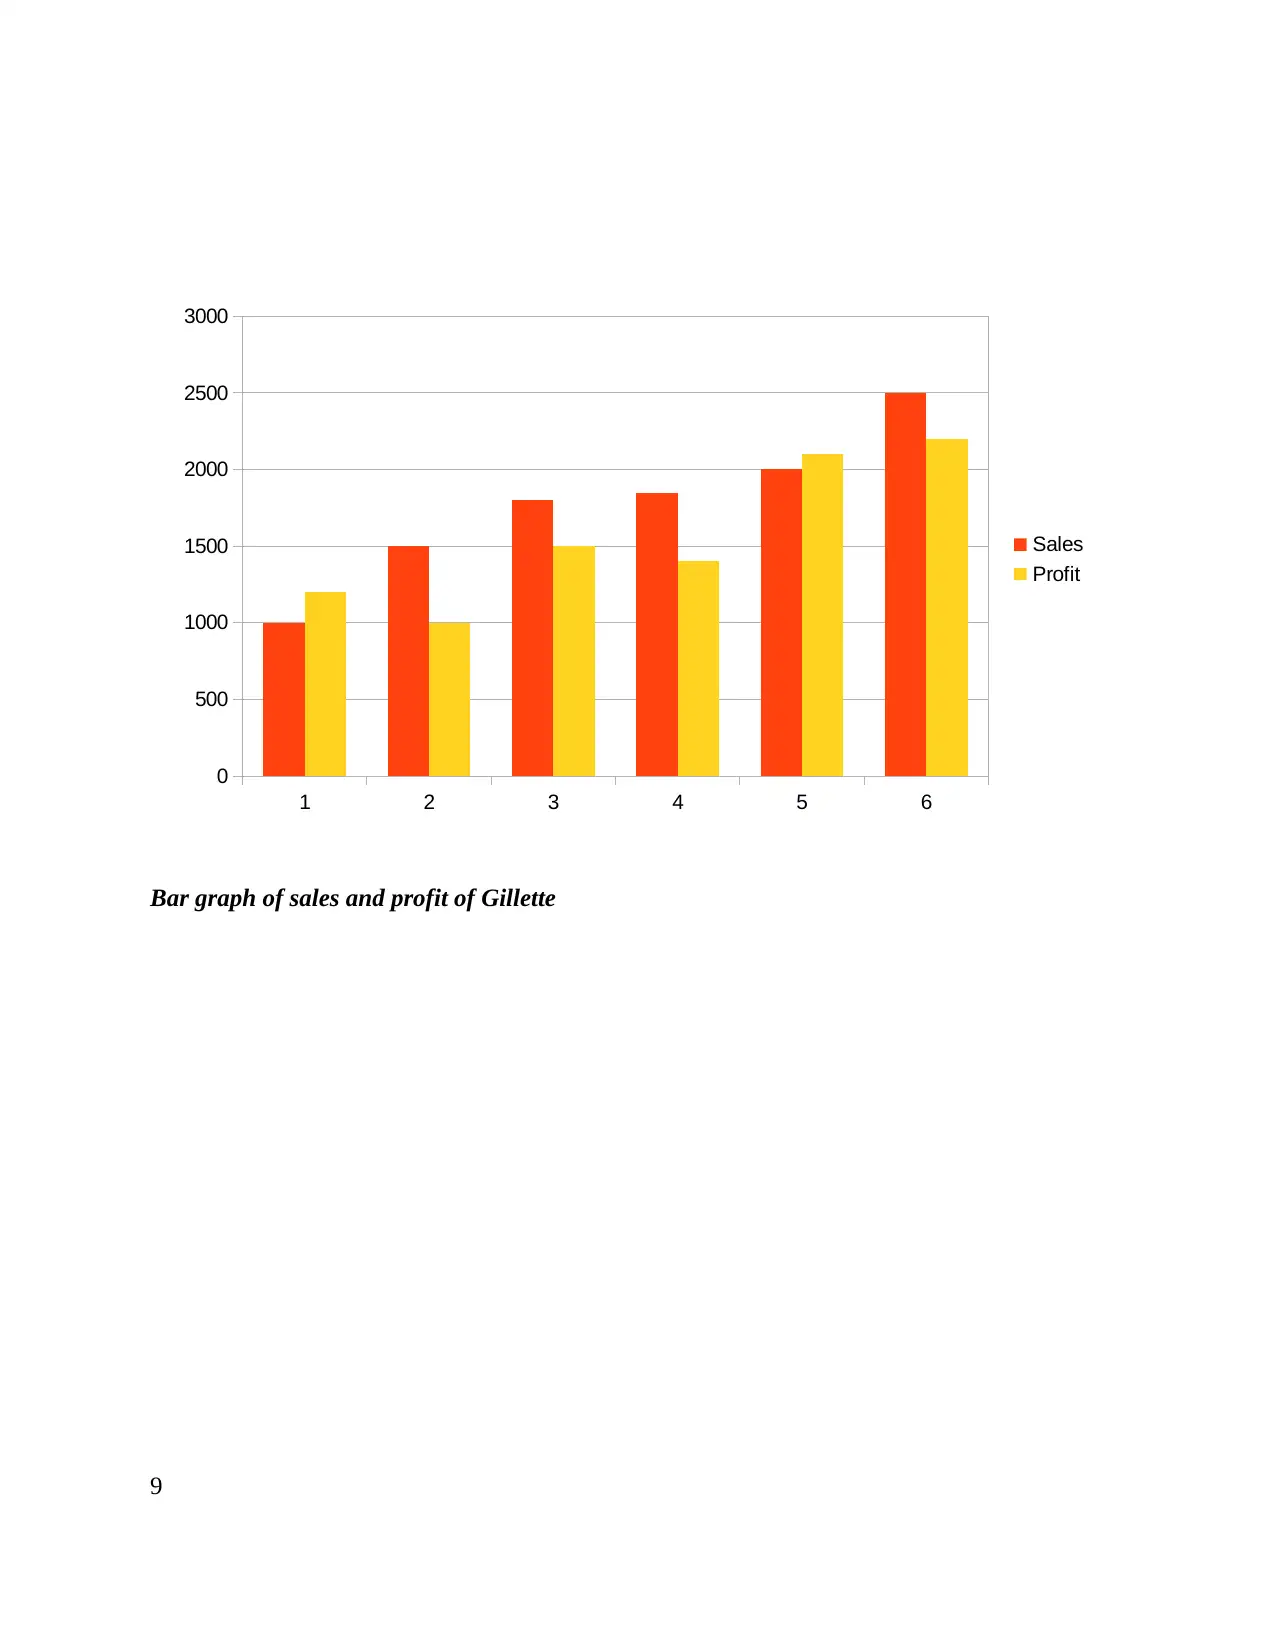
From the above column and bar graph of Gillette it can be said that sales and profits of
the company is increasing to a greater extent. This presents that the firm can take decision
regarding development of new project in an effective manner.
Histogram of Sales
10
1
2
3
4
5
6
0 500 1000 1500 2000 2500 3000
Profit
Sales
1500-1599 1800-1899 2000-2099 2400-2500
0
0.5
1
1.5
2
2.5
the company is increasing to a greater extent. This presents that the firm can take decision
regarding development of new project in an effective manner.
Histogram of Sales
10
1
2
3
4
5
6
0 500 1000 1500 2000 2500 3000
Profit
Sales
1500-1599 1800-1899 2000-2099 2400-2500
0
0.5
1
1.5
2
2.5
Paraphrase This Document
Need a fresh take? Get an instant paraphrase of this document with our AI Paraphraser
Row Labels Count of Sales
1000-1099 1
1500-1599 1
1800-1899 2
2000-2099 1
2400-2500 1
Grand Total 6
The above graph presents the histogram of sales of Gillette. It has been examined that
firm has constant growth and development. The sales of the company lies within the range of
1800-1899 possess highest frequency that is 2. In other ranges the frequency is one.
Histogram of Profit
Row Labels Count of Profit
1000-1099 1
1200-1299 1
11
1200-1299 1400-1499 1500-1599 2100-2200
0
0.5
1
1.5
2
2.5
1000-1099 1
1500-1599 1
1800-1899 2
2000-2099 1
2400-2500 1
Grand Total 6
The above graph presents the histogram of sales of Gillette. It has been examined that
firm has constant growth and development. The sales of the company lies within the range of
1800-1899 possess highest frequency that is 2. In other ranges the frequency is one.
Histogram of Profit
Row Labels Count of Profit
1000-1099 1
1200-1299 1
11
1200-1299 1400-1499 1500-1599 2100-2200
0
0.5
1
1.5
2
2.5
1400-1499 1
1500-1599 1
2100-2200 2
Grand Total 6
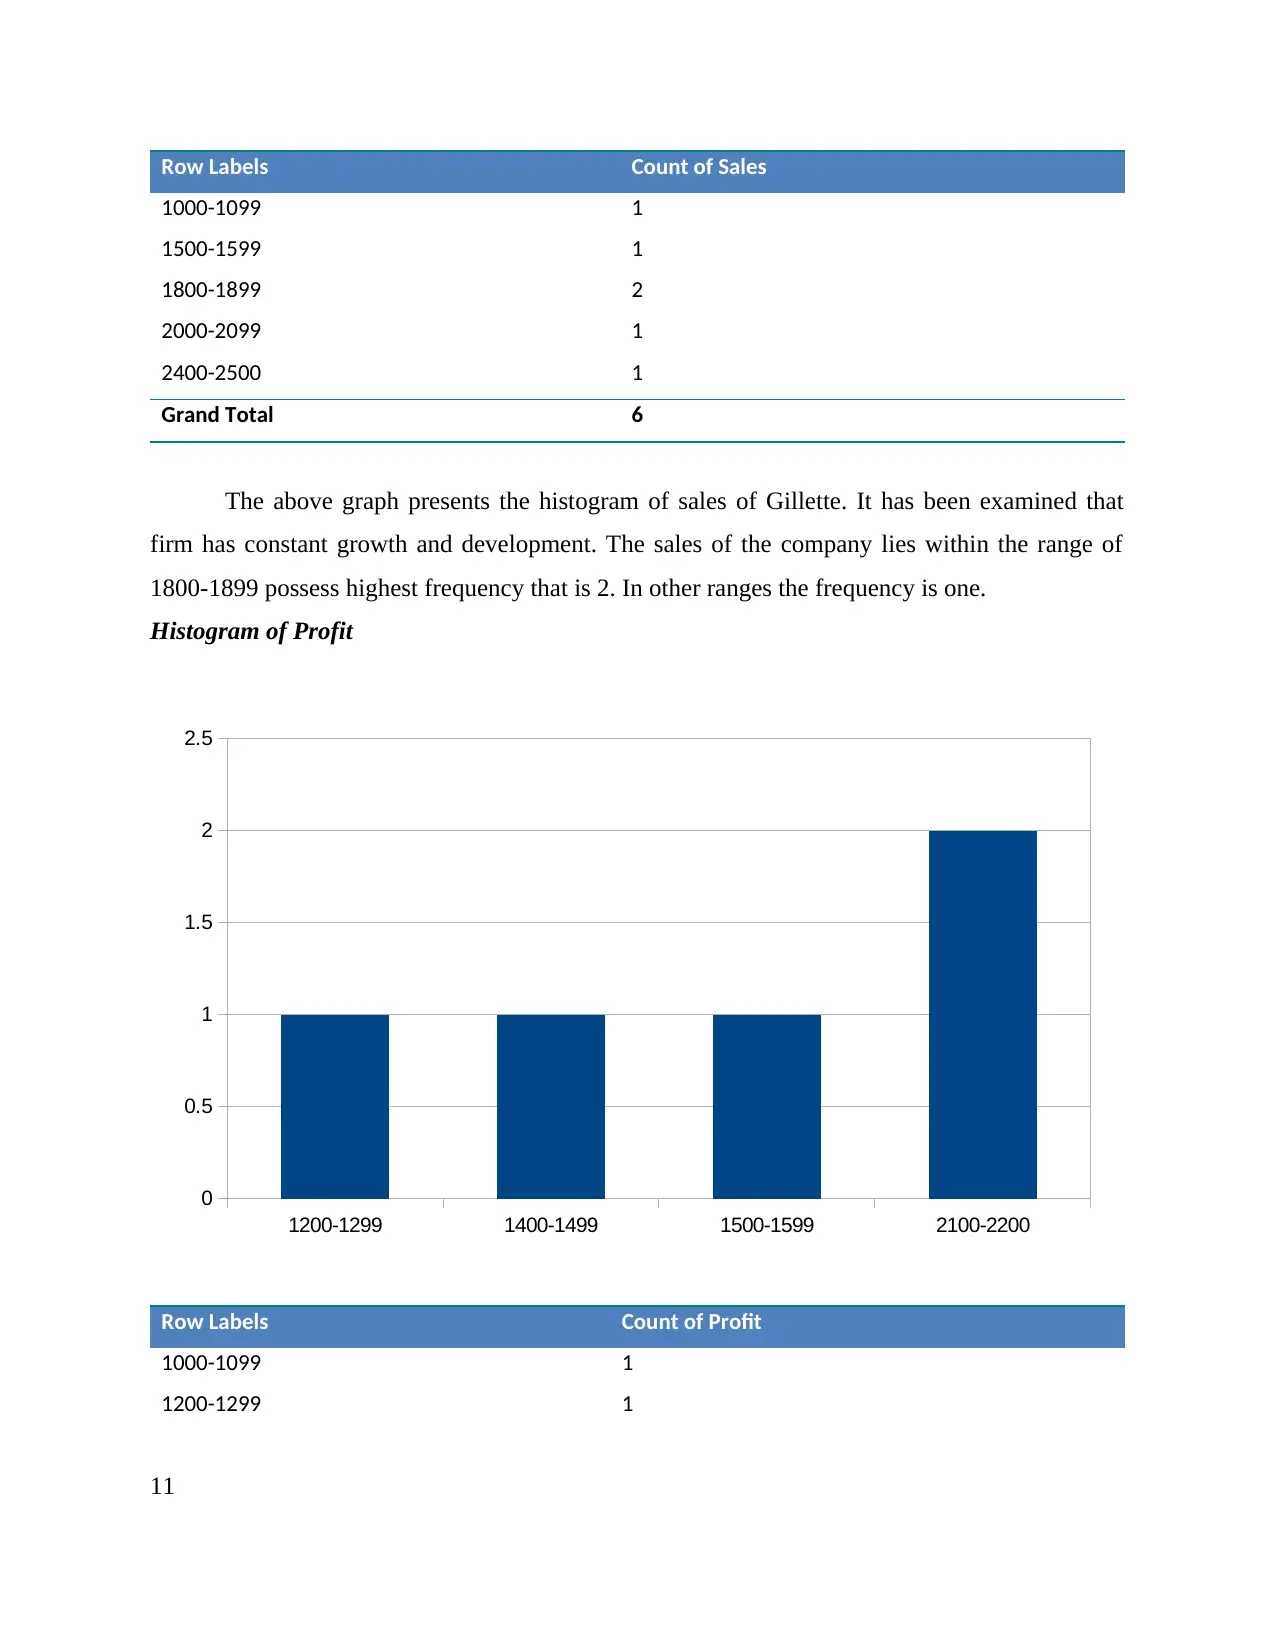
The graph above demonstrate the histogram of profit for Gillette. It has been examined
that firm has constant growth and development. The profit of the company lies within the range
of 2100-2200 possess highest frequency that is 2. However in other ranges the frequency is one.
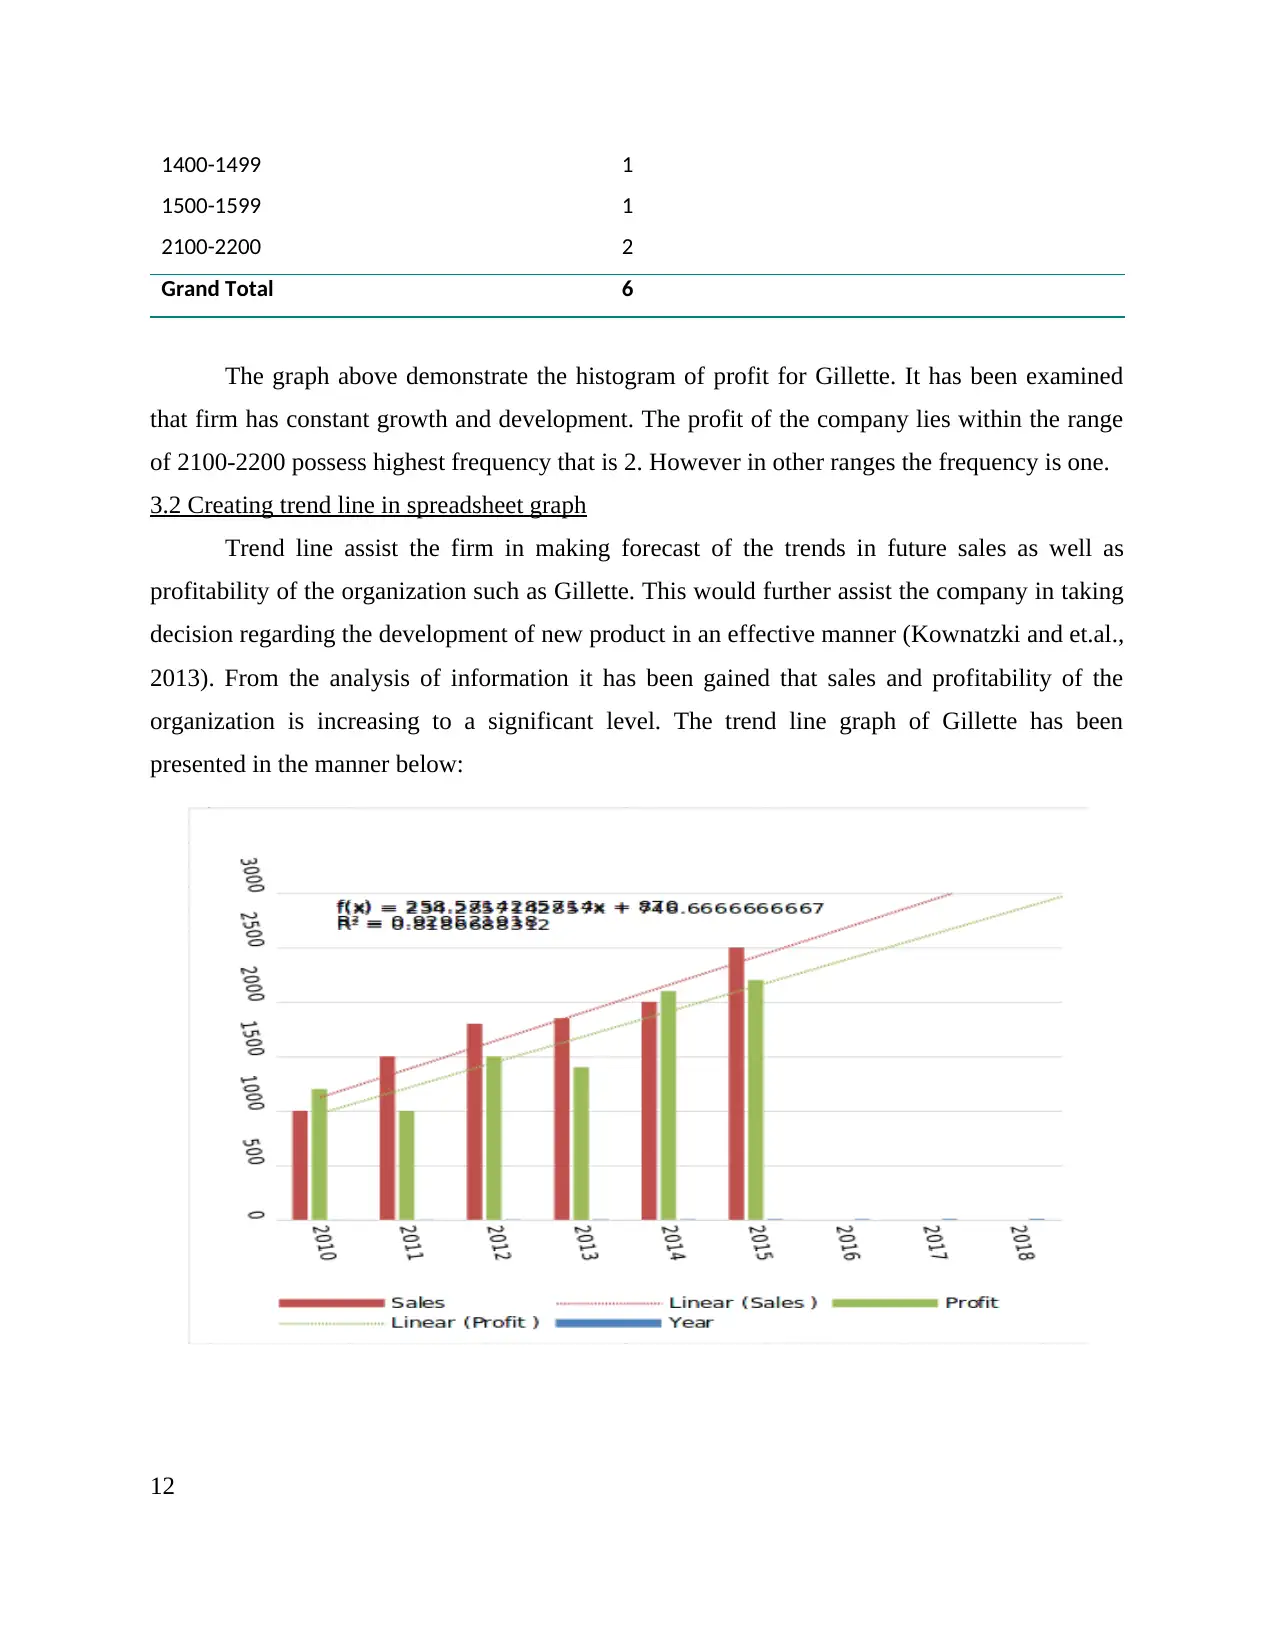
3.2 Creating trend line in spreadsheet graph
Trend line assist the firm in making forecast of the trends in future sales as well as
profitability of the organization such as Gillette. This would further assist the company in taking
decision regarding the development of new product in an effective manner (Kownatzki and et.al.,
2013). From the analysis of information it has been gained that sales and profitability of the
organization is increasing to a significant level. The trend line graph of Gillette has been
presented in the manner below:
12
1500-1599 1
2100-2200 2
Grand Total 6
The graph above demonstrate the histogram of profit for Gillette. It has been examined
that firm has constant growth and development. The profit of the company lies within the range
of 2100-2200 possess highest frequency that is 2. However in other ranges the frequency is one.
3.2 Creating trend line in spreadsheet graph
Trend line assist the firm in making forecast of the trends in future sales as well as
profitability of the organization such as Gillette. This would further assist the company in taking
decision regarding the development of new product in an effective manner (Kownatzki and et.al.,
2013). From the analysis of information it has been gained that sales and profitability of the
organization is increasing to a significant level. The trend line graph of Gillette has been
presented in the manner below:
12
⊘ This is a preview!⊘
Do you want full access?
Subscribe today to unlock all pages.
Trusted by 1+ million students worldwide
1 out of 19
Related Documents


Your All-in-One AI-Powered Toolkit for Academic Success.
+13062052269
info@desklib.com
Available 24*7 on WhatsApp / Email
![[object Object]](/_next/static/media/star-bottom.7253800d.svg)
Unlock your academic potential
Copyright © 2020–2026 A2Z Services. All Rights Reserved. Developed and managed by ZUCOL.