Business Decision Making Report: Restaurant in London Analysis, Data
VerifiedAdded on 2020/01/28
|23
|3767
|271
Report
AI Summary
This report focuses on the business decision-making process for opening a new restaurant in London. It begins with an introduction that highlights the importance of decisions in business and the role of management. Task 1 outlines a plan for data collection, including primary and secondary methods, and presents a detailed survey methodology with a designed questionnaire. The data is then summarized and analyzed using statistical measures such as mean, median, and mode. Task 2 involves producing graphs, trend lines, and business presentations, as well as formal reports. Furthermore, the report delves into information processing tools, project planning to determine the critical path, and the application of financial tools for decision-making. The conclusion summarizes the findings, and a list of references is provided to support the analysis.

BUSINESS DECISION
MAKING
MAKING
Paraphrase This Document
Need a fresh take? Get an instant paraphrase of this document with our AI Paraphraser
Table of Contents
INTRODUCTION...........................................................................................................................4
TASK 1............................................................................................................................................4
1.1 Create plan for data collection...............................................................................................4
1.2 present survey methodology...................................................................................................5
1.3 Design questionnaire..............................................................................................................6
2.2 Analyze the results.................................................................................................................8
2.3 Analyze data using measures of dispersion............................................................................9
2.4 Explain quartiles, percentiles and correlation......................................................................11
TASK 2..........................................................................................................................................13
3.1 Producing graphs..................................................................................................................13
3.2 Trend line.............................................................................................................................17
3.3 Business presentation...........................................................................................................18
3.4 Business formal report.........................................................................................................18
4.1 Information processing tools................................................................................................18
4.2 Prepare project plan to determine critical path.....................................................................19
4.3 Using financial tool for decision making.............................................................................21
CONCLUSION..............................................................................................................................22
REFERENCES..............................................................................................................................23
INTRODUCTION
Decisions are integral part of the business which enhances the role of management in the
external market. Skills and the capabilities of an individual improve with the passage of time.
This project is all about opening a new restaurant in the city of London. This report stresses on
organizing research study in which research design and collection of data has framed. The
statistical measures are used in the business such as mean, median and mode. Graphs and
spreadsheets software’s are used in better presentation of the collected data. The projects
viability is judged on the basis of applying the capital budgeting technique.
TASK 1
1.1 Create plan for data collection
Current research study report is conducted by the existing owner of restaurant chain who
intends to open its new restaurant in the London. This is regarded as one of the strategy of
business expansion by the owner in order to gather large number of customers along with higher
market share (Welsh and Birch, 2015). Opening new restaurant in the London is beneficial for
the firm as this city is the famous tourist destinations in the whole world. There are two method
of collection of data will be used by the researcher which is given as below:
Primary collection- It is that technique in which supervisors are appointed by the firm
who are marketers of the firm. The attributes of customers are surveyed in order to design the
best suitable product according to the tastes and preferences of the customers. The survey will be
focuses on various parameters like product price, quality of the products liked by the customers,
fashion running in the market.
Secondary collection- Online surveyors will collect information on the current project of
the restaurant owner. Census data records are observed in order to know everything about the
local citizens of the London such as their family size, income of an individual.
Research plan:
⊘ This is a preview!⊘
Do you want full access?
Subscribe today to unlock all pages.
Trusted by 1+ million students worldwide
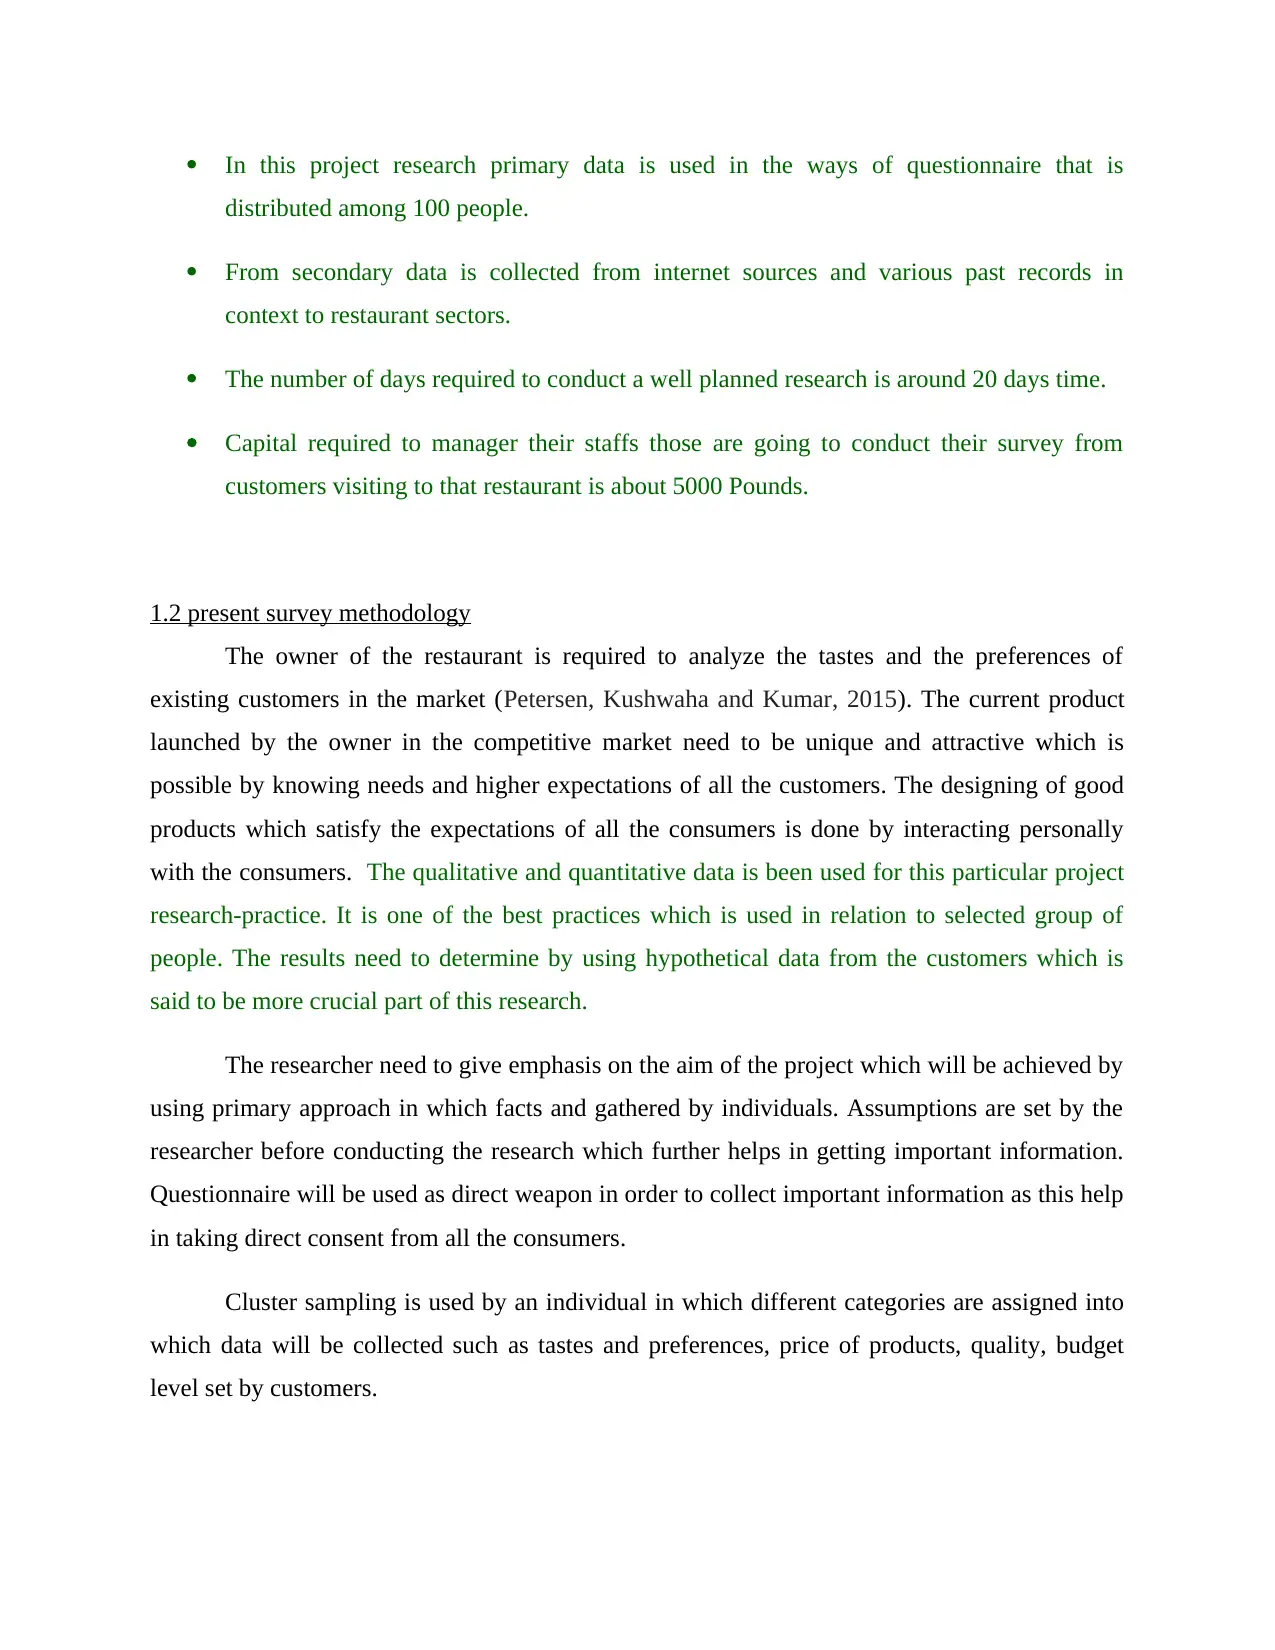
In this project research primary data is used in the ways of questionnaire that is
distributed among 100 people.
From secondary data is collected from internet sources and various past records in
context to restaurant sectors.
The number of days required to conduct a well planned research is around 20 days time.
Capital required to manager their staffs those are going to conduct their survey from
customers visiting to that restaurant is about 5000 Pounds.
1.2 present survey methodology
The owner of the restaurant is required to analyze the tastes and the preferences of
existing customers in the market (Petersen, Kushwaha and Kumar, 2015). The current product
launched by the owner in the competitive market need to be unique and attractive which is
possible by knowing needs and higher expectations of all the customers. The designing of good
products which satisfy the expectations of all the consumers is done by interacting personally
with the consumers. The qualitative and quantitative data is been used for this particular project
research-practice. It is one of the best practices which is used in relation to selected group of
people. The results need to determine by using hypothetical data from the customers which is
said to be more crucial part of this research.
The researcher need to give emphasis on the aim of the project which will be achieved by
using primary approach in which facts and gathered by individuals. Assumptions are set by the
researcher before conducting the research which further helps in getting important information.
Questionnaire will be used as direct weapon in order to collect important information as this help
in taking direct consent from all the consumers.
Cluster sampling is used by an individual in which different categories are assigned into
which data will be collected such as tastes and preferences, price of products, quality, budget
level set by customers.
Paraphrase This Document
Need a fresh take? Get an instant paraphrase of this document with our AI Paraphraser
Random sampling: With the every time gap an imperative data is collected from the
number of population.
Under this research, the most corrective option of sampling is random sample. This an
effective method by which proper results can framed and researchers would get more fast and
positive results.
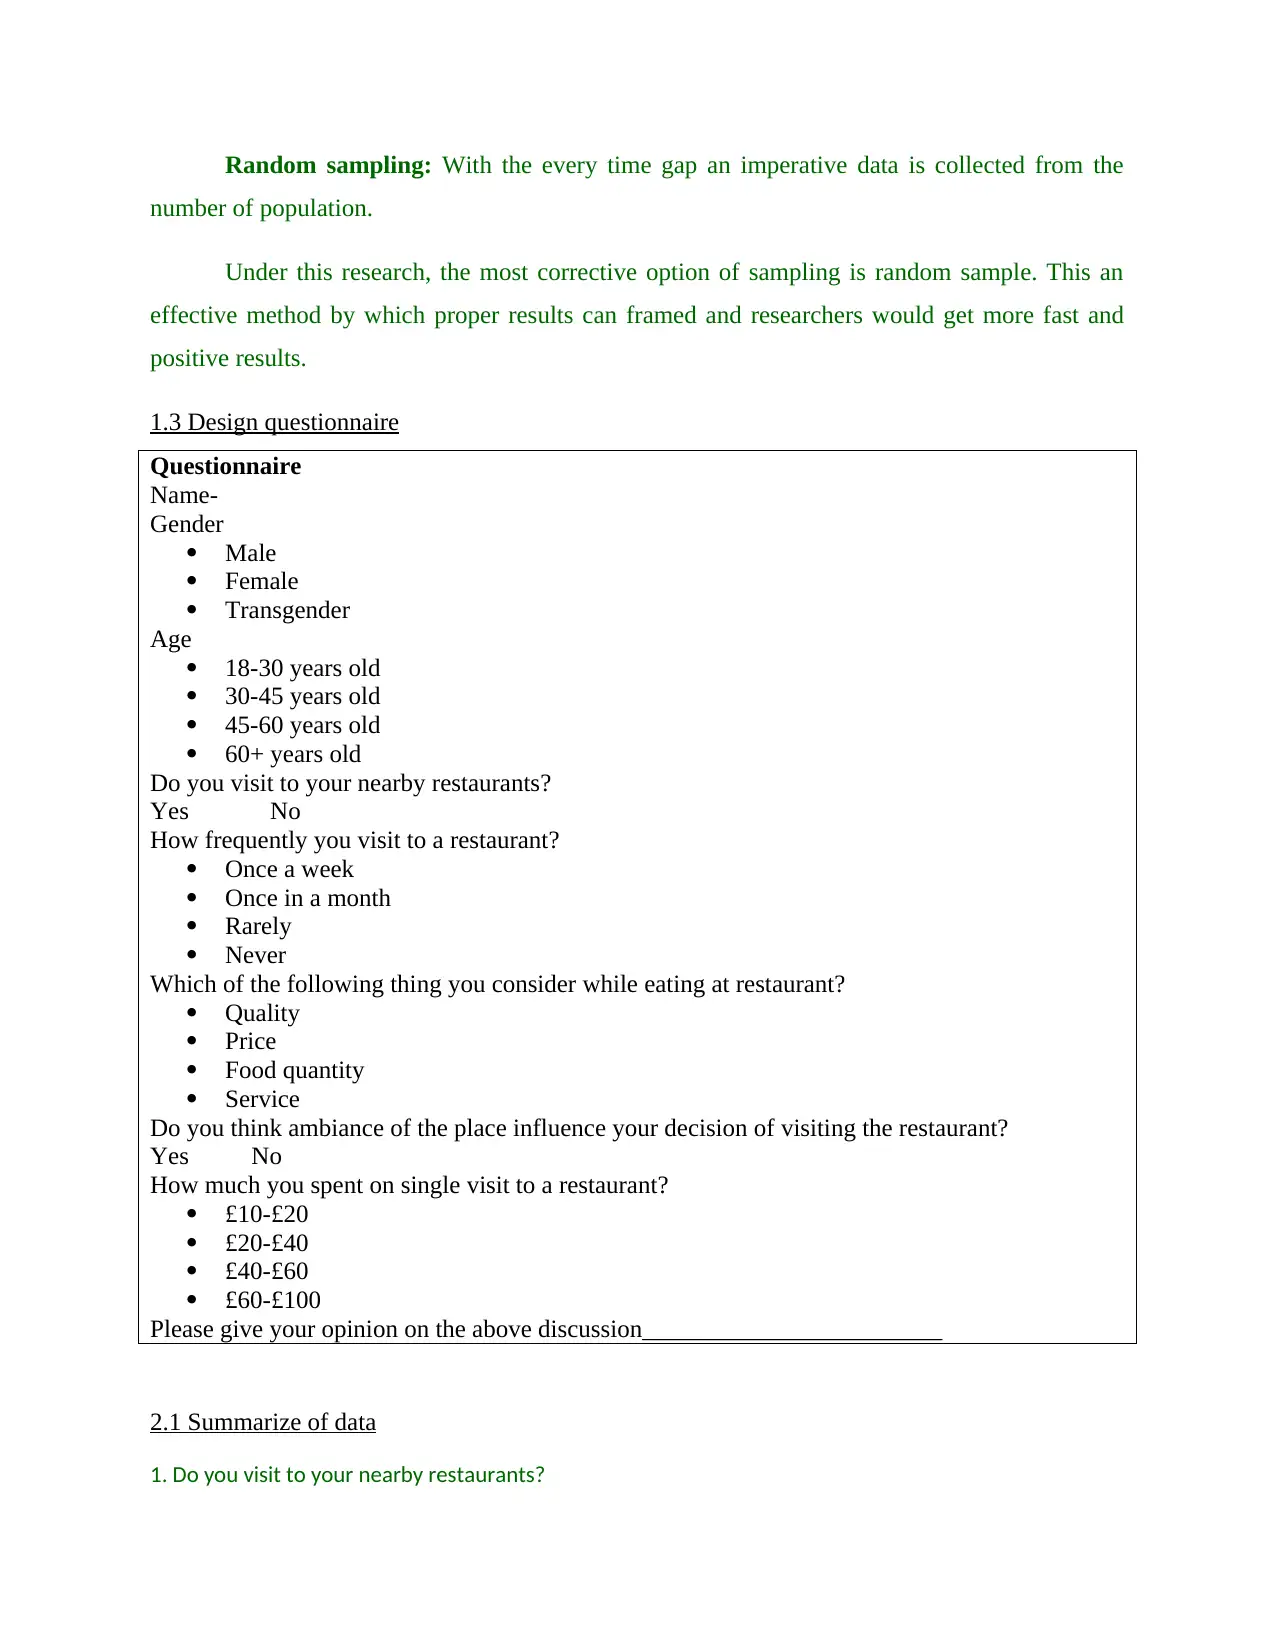
1.3 Design questionnaire
Questionnaire
Name-
Gender
Male
Female
Transgender
Age
18-30 years old
30-45 years old
45-60 years old
60+ years old
Do you visit to your nearby restaurants?
Yes No
How frequently you visit to a restaurant?
Once a week
Once in a month
Rarely
Never
Which of the following thing you consider while eating at restaurant?
Quality
Price
Food quantity
Service
Do you think ambiance of the place influence your decision of visiting the restaurant?
Yes No
How much you spent on single visit to a restaurant?
£10-£20
£20-£40
£40-£60
£60-£100
Please give your opinion on the above discussion________________________
2.1 Summarize of data
1. Do you visit to your nearby restaurants?
number of population.
Under this research, the most corrective option of sampling is random sample. This an
effective method by which proper results can framed and researchers would get more fast and
positive results.
1.3 Design questionnaire
Questionnaire
Name-
Gender
Male
Female
Transgender
Age
18-30 years old
30-45 years old
45-60 years old
60+ years old
Do you visit to your nearby restaurants?
Yes No
How frequently you visit to a restaurant?
Once a week
Once in a month
Rarely
Never
Which of the following thing you consider while eating at restaurant?
Quality
Price
Food quantity
Service
Do you think ambiance of the place influence your decision of visiting the restaurant?
Yes No
How much you spent on single visit to a restaurant?
£10-£20
£20-£40
£40-£60
£60-£100
Please give your opinion on the above discussion________________________
2.1 Summarize of data
1. Do you visit to your nearby restaurants?
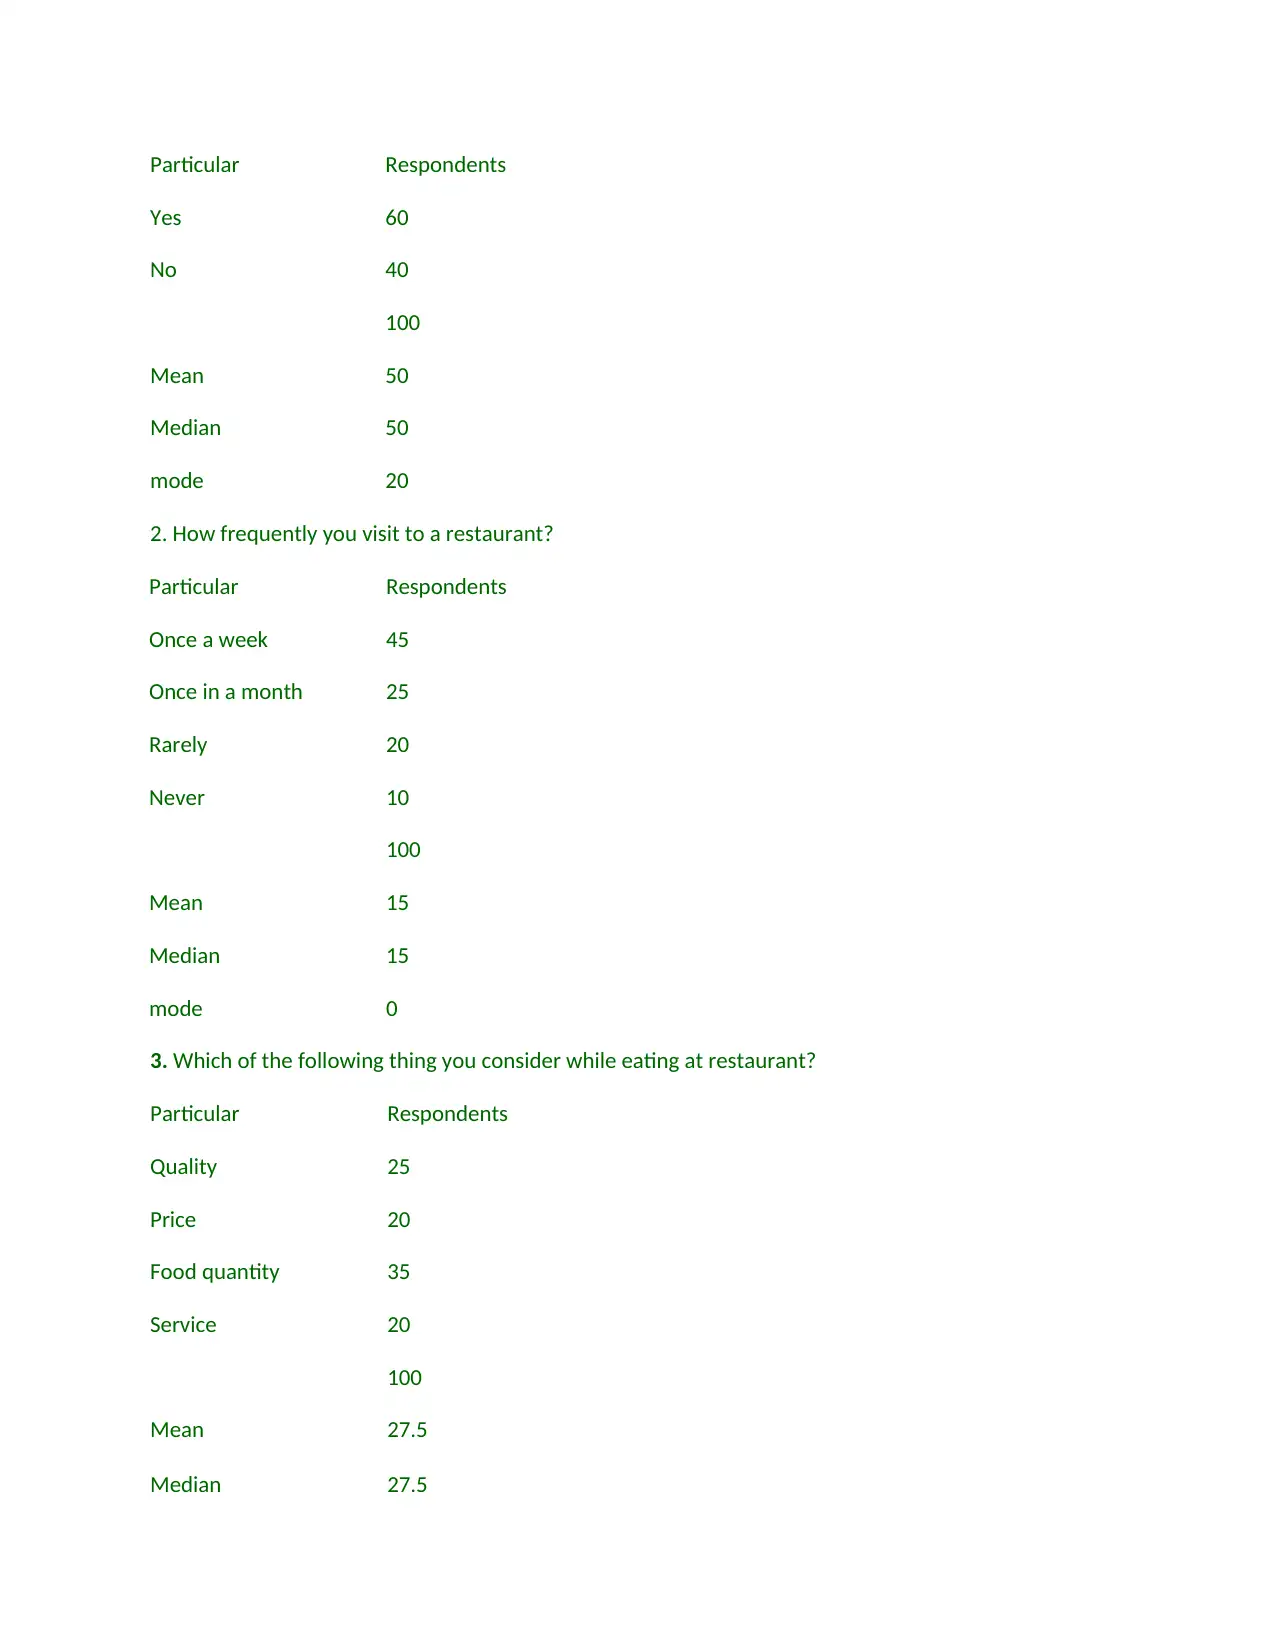
Particular Respondents
Yes 60
No 40
100
Mean 50
Median 50
mode 20
2. How frequently you visit to a restaurant?
Particular Respondents
Once a week 45
Once in a month 25
Rarely 20
Never 10
100
Mean 15
Median 15
mode 0
3. Which of the following thing you consider while eating at restaurant?
Particular Respondents
Quality 25
Price 20
Food quantity 35
Service 20
100
Mean 27.5
Median 27.5
⊘ This is a preview!⊘
Do you want full access?
Subscribe today to unlock all pages.
Trusted by 1+ million students worldwide
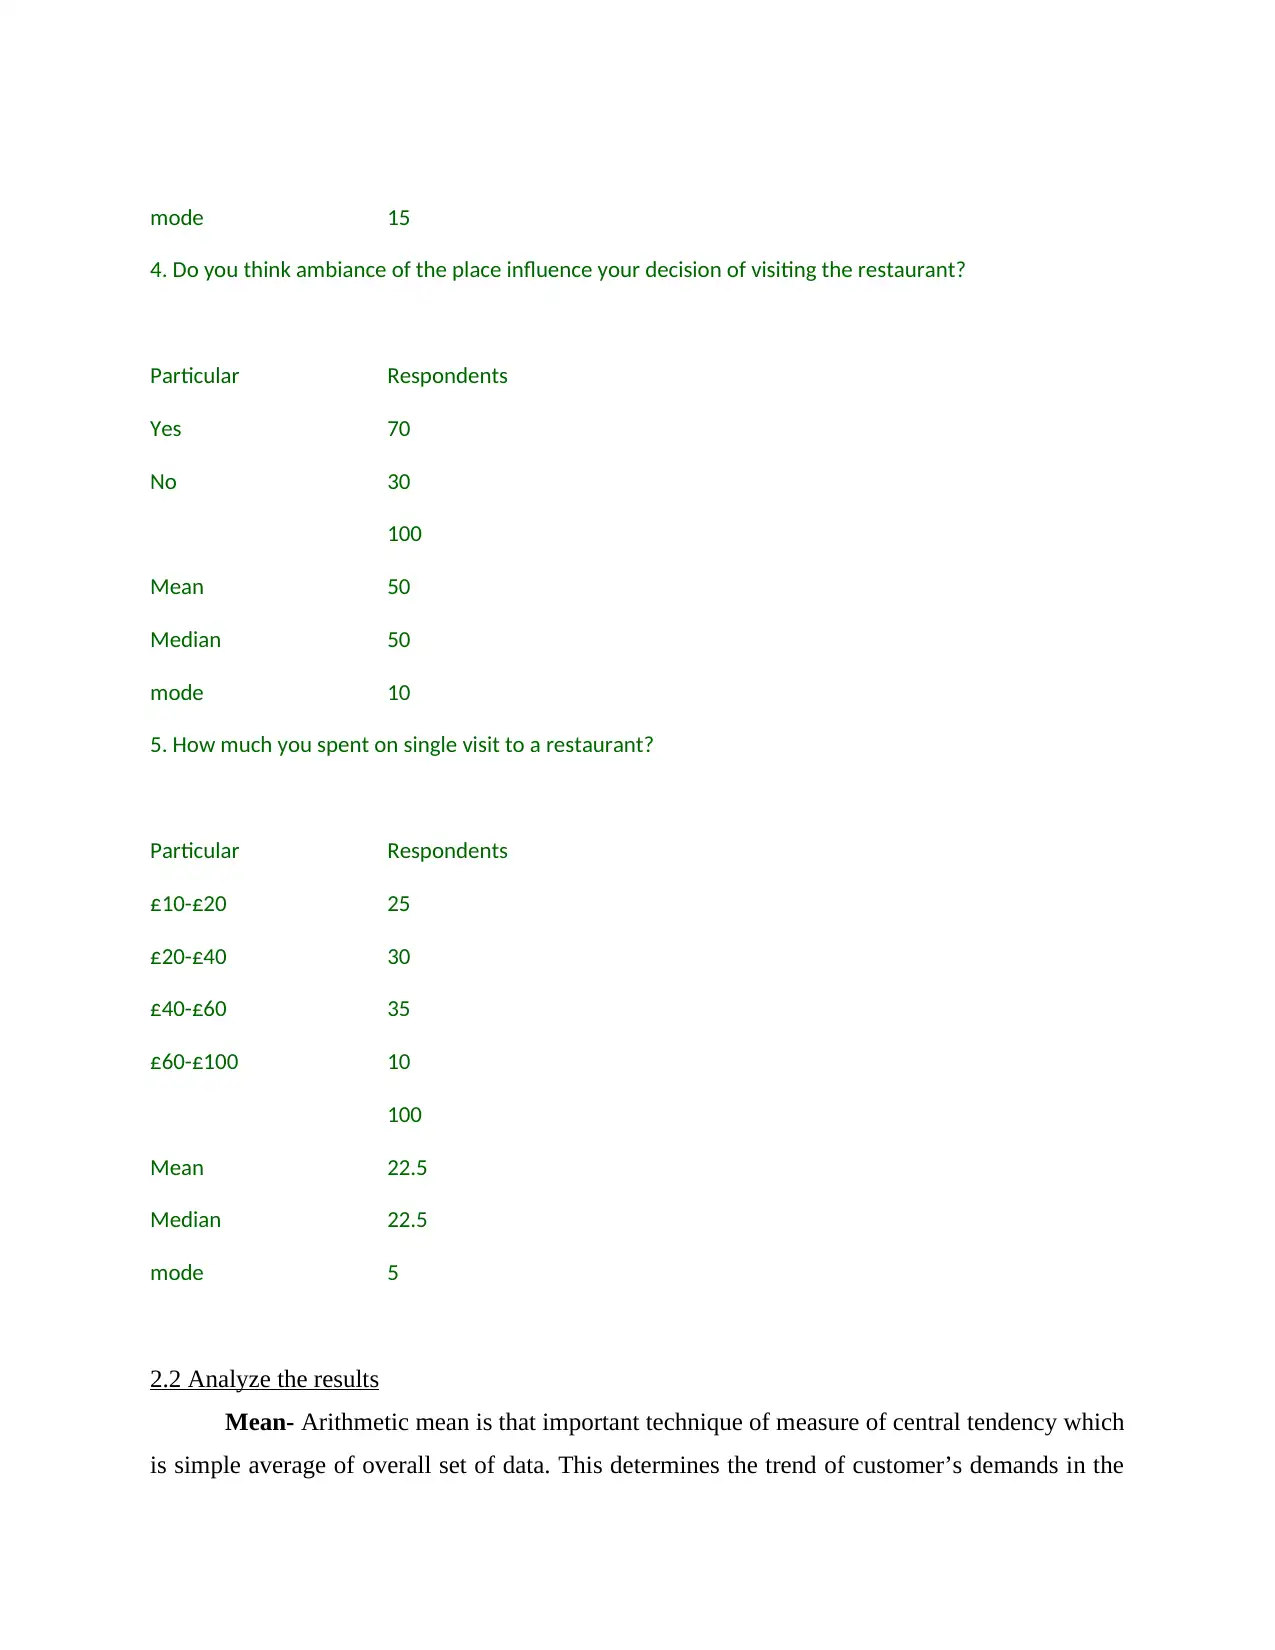
mode 15
4. Do you think ambiance of the place influence your decision of visiting the restaurant?
Particular Respondents
Yes 70
No 30
100
Mean 50
Median 50
mode 10
5. How much you spent on single visit to a restaurant?
Particular Respondents
£10-£20 25
£20-£40 30
£40-£60 35
£60-£100 10
100
Mean 22.5
Median 22.5
mode 5
2.2 Analyze the results
Mean- Arithmetic mean is that important technique of measure of central tendency which
is simple average of overall set of data. This determines the trend of customer’s demands in the
Paraphrase This Document
Need a fresh take? Get an instant paraphrase of this document with our AI Paraphraser
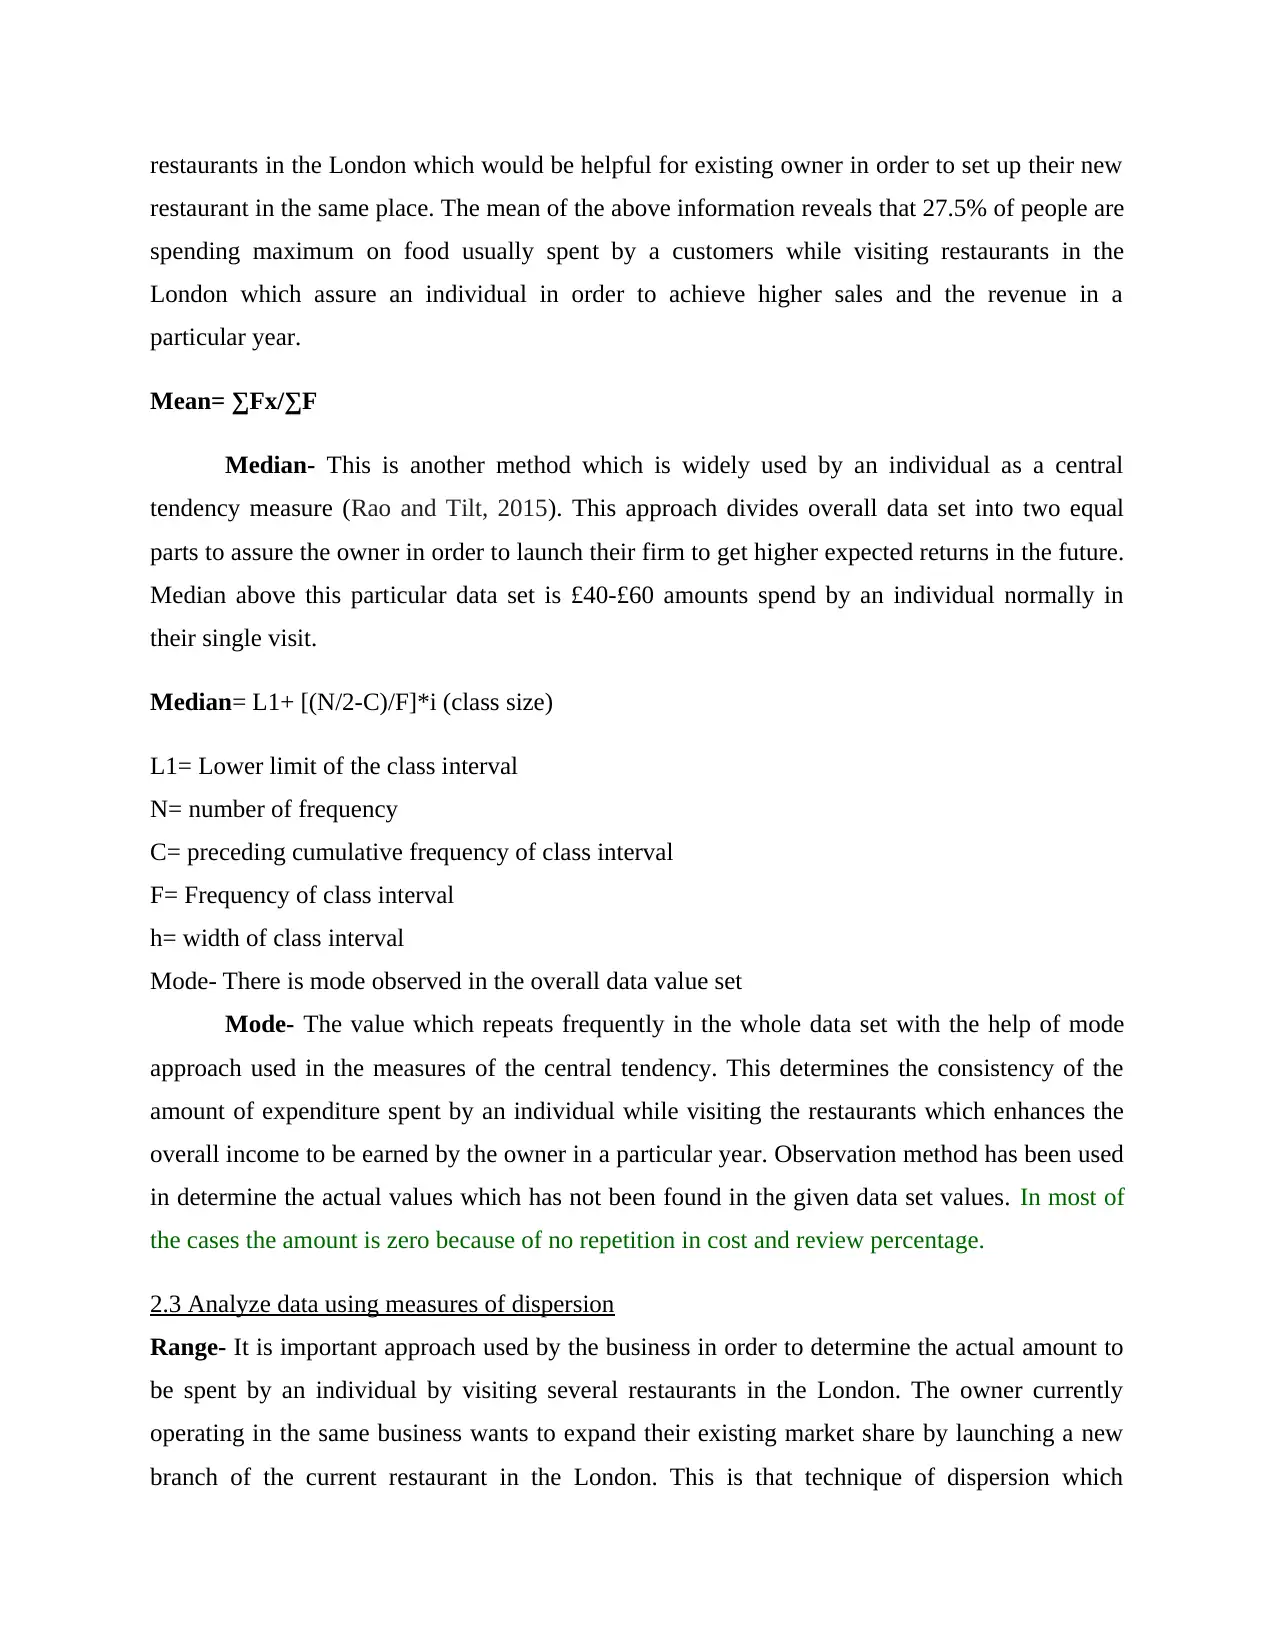
restaurants in the London which would be helpful for existing owner in order to set up their new
restaurant in the same place. The mean of the above information reveals that 27.5% of people are
spending maximum on food usually spent by a customers while visiting restaurants in the
London which assure an individual in order to achieve higher sales and the revenue in a
particular year.
Mean= ∑Fx/∑F
Median- This is another method which is widely used by an individual as a central
tendency measure (Rao and Tilt, 2015). This approach divides overall data set into two equal
parts to assure the owner in order to launch their firm to get higher expected returns in the future.
Median above this particular data set is £40-£60 amounts spend by an individual normally in
their single visit.
Median= L1+ [(N/2-C)/F]*i (class size)
L1= Lower limit of the class interval
N= number of frequency
C= preceding cumulative frequency of class interval
F= Frequency of class interval
h= width of class interval
Mode- There is mode observed in the overall data value set
Mode- The value which repeats frequently in the whole data set with the help of mode
approach used in the measures of the central tendency. This determines the consistency of the
amount of expenditure spent by an individual while visiting the restaurants which enhances the
overall income to be earned by the owner in a particular year. Observation method has been used
in determine the actual values which has not been found in the given data set values. In most of
the cases the amount is zero because of no repetition in cost and review percentage.
2.3 Analyze data using measures of dispersion
Range- It is important approach used by the business in order to determine the actual amount to
be spent by an individual by visiting several restaurants in the London. The owner currently
operating in the same business wants to expand their existing market share by launching a new
branch of the current restaurant in the London. This is that technique of dispersion which
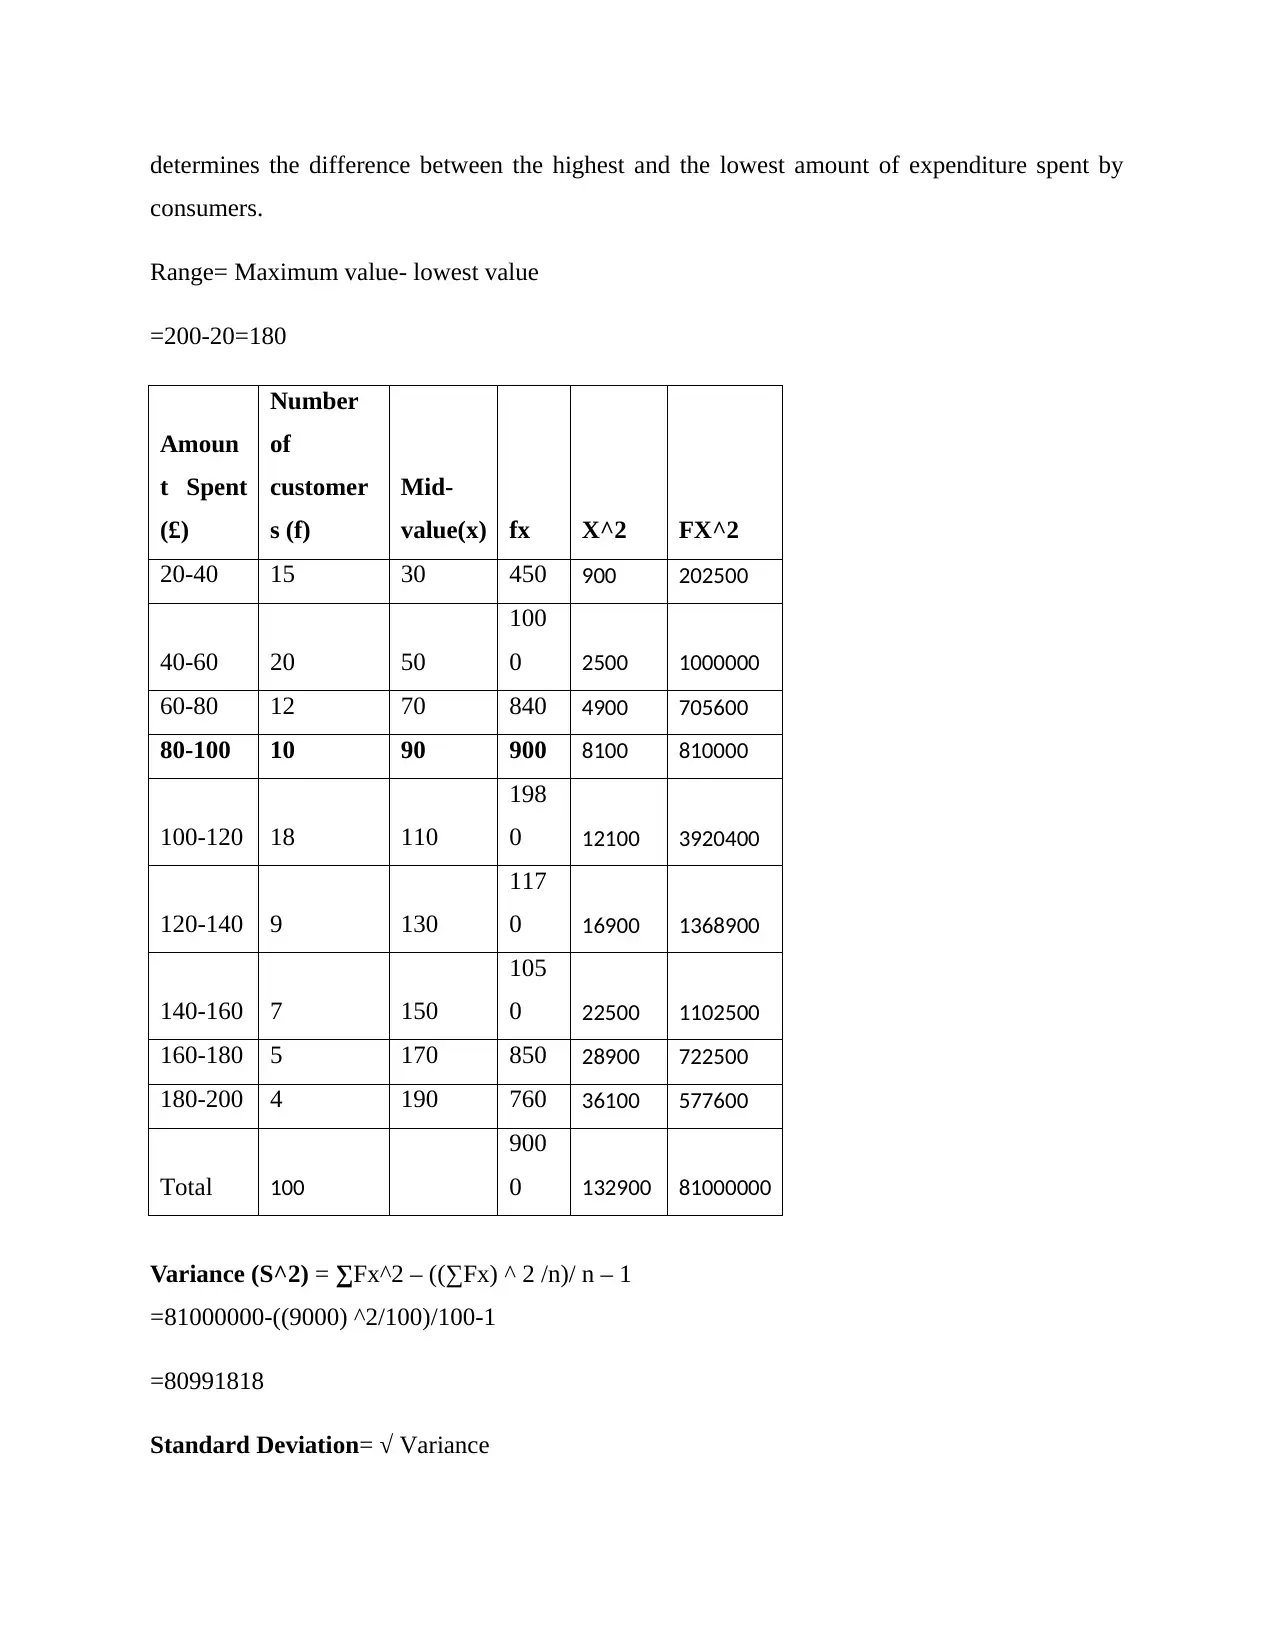
determines the difference between the highest and the lowest amount of expenditure spent by
consumers.
Range= Maximum value- lowest value
=200-20=180
Amoun
t Spent
(£)
Number
of
customer
s (f)
Mid-
value(x) fx X^2 FX^2
20-40 15 30 450 900 202500
40-60 20 50
100
0 2500 1000000
60-80 12 70 840 4900 705600
80-100 10 90 900 8100 810000
100-120 18 110
198
0 12100 3920400
120-140 9 130
117
0 16900 1368900
140-160 7 150
105
0 22500 1102500
160-180 5 170 850 28900 722500
180-200 4 190 760 36100 577600
Total 100
900
0 132900 81000000
Variance (S^2) = ∑Fx^2 – ((∑Fx) ^ 2 /n)/ n – 1
=81000000-((9000) ^2/100)/100-1
=80991818
Standard Deviation= √ Variance
⊘ This is a preview!⊘
Do you want full access?
Subscribe today to unlock all pages.
Trusted by 1+ million students worldwide
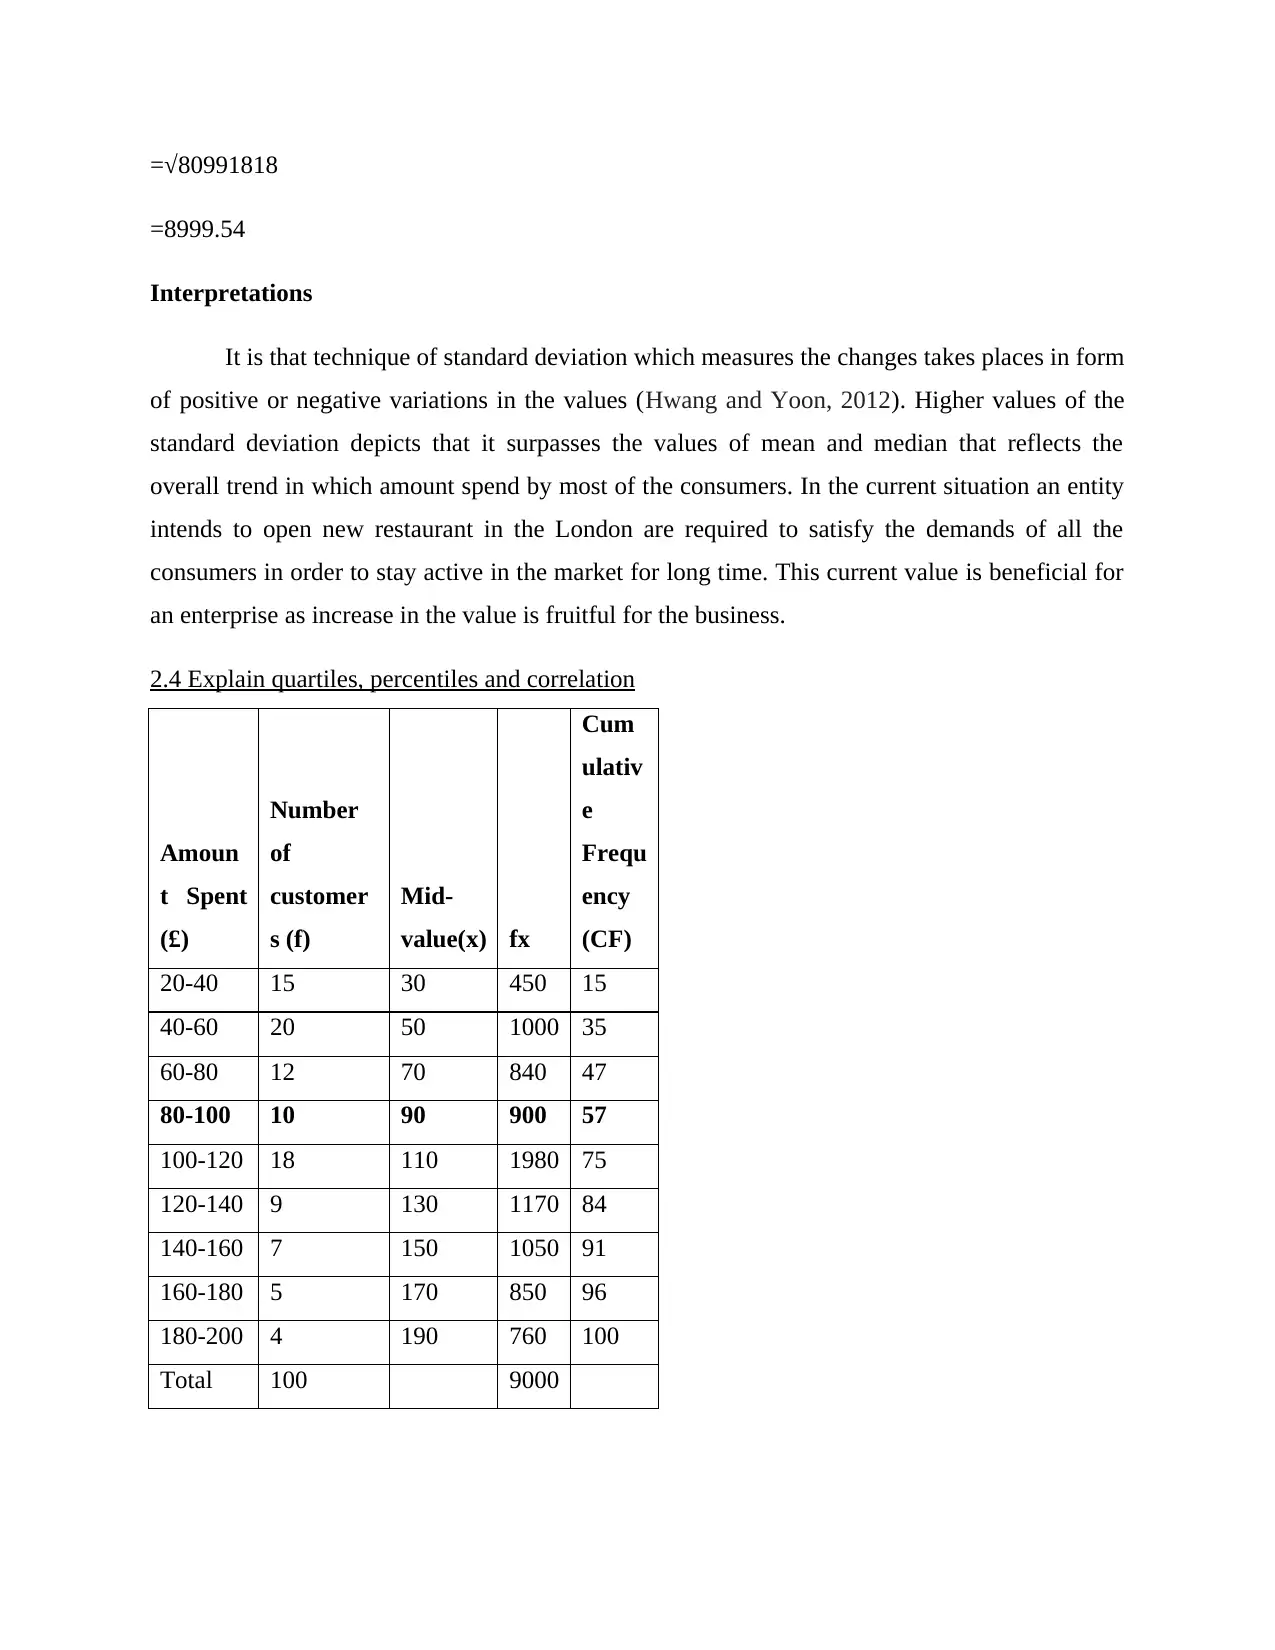
=√80991818
=8999.54
Interpretations
It is that technique of standard deviation which measures the changes takes places in form
of positive or negative variations in the values (Hwang and Yoon, 2012). Higher values of the
standard deviation depicts that it surpasses the values of mean and median that reflects the
overall trend in which amount spend by most of the consumers. In the current situation an entity
intends to open new restaurant in the London are required to satisfy the demands of all the
consumers in order to stay active in the market for long time. This current value is beneficial for
an enterprise as increase in the value is fruitful for the business.
2.4 Explain quartiles, percentiles and correlation
Amoun
t Spent
(£)
Number
of
customer
s (f)
Mid-
value(x) fx
Cum
ulativ
e
Frequ
ency
(CF)
20-40 15 30 450 15
40-60 20 50 1000 35
60-80 12 70 840 47
80-100 10 90 900 57
100-120 18 110 1980 75
120-140 9 130 1170 84
140-160 7 150 1050 91
160-180 5 170 850 96
180-200 4 190 760 100
Total 100 9000
Paraphrase This Document
Need a fresh take? Get an instant paraphrase of this document with our AI Paraphraser
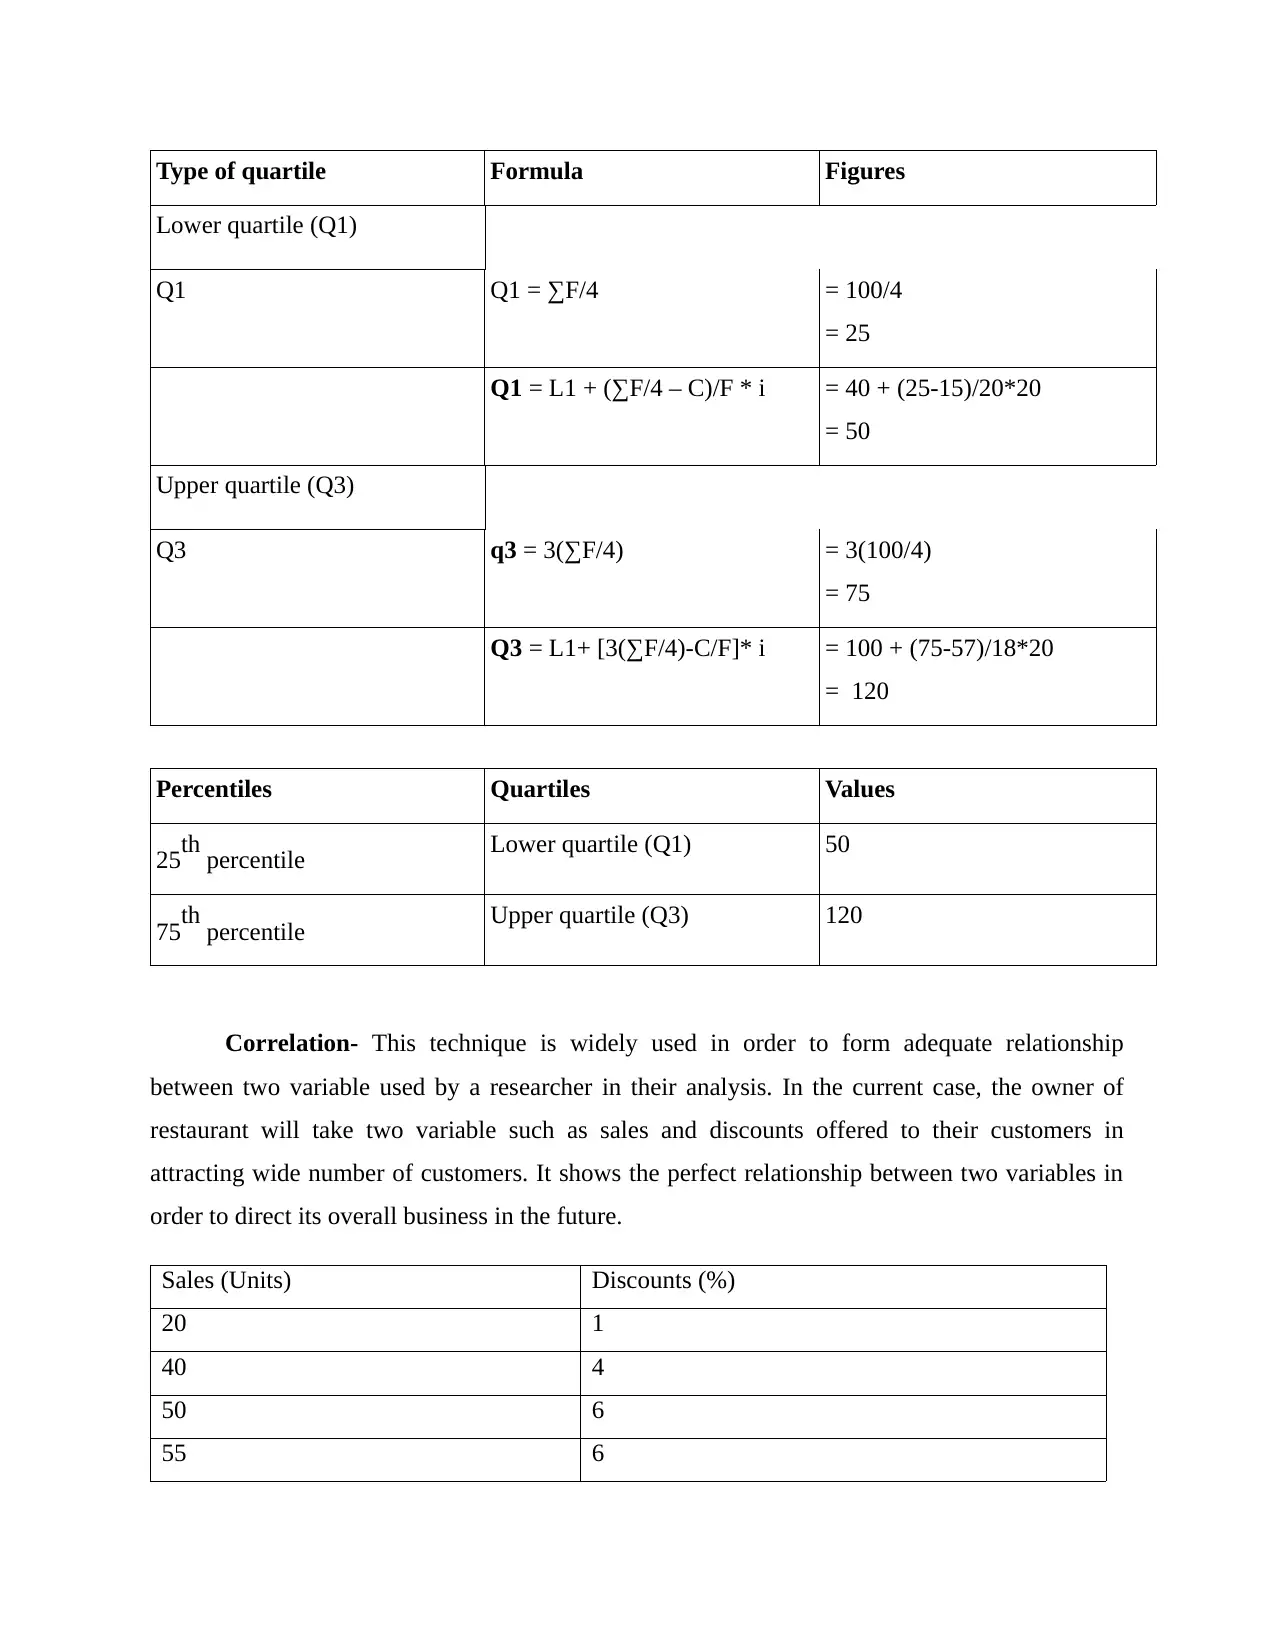
Type of quartile Formula Figures
Lower quartile (Q1)
Q1 Q1 = ∑F/4 = 100/4
= 25
Q1 = L1 + (∑F/4 – C)/F * i = 40 + (25-15)/20*20
= 50
Upper quartile (Q3)
Q3 q3 = 3(∑F/4) = 3(100/4)
= 75
Q3 = L1+ [3(∑F/4)-C/F]* i = 100 + (75-57)/18*20
= 120
Percentiles Quartiles Values
25th percentile Lower quartile (Q1) 50
75th percentile Upper quartile (Q3) 120
Correlation- This technique is widely used in order to form adequate relationship
between two variable used by a researcher in their analysis. In the current case, the owner of
restaurant will take two variable such as sales and discounts offered to their customers in
attracting wide number of customers. It shows the perfect relationship between two variables in
order to direct its overall business in the future.
Sales (Units) Discounts (%)
20 1
40 4
50 6
55 6
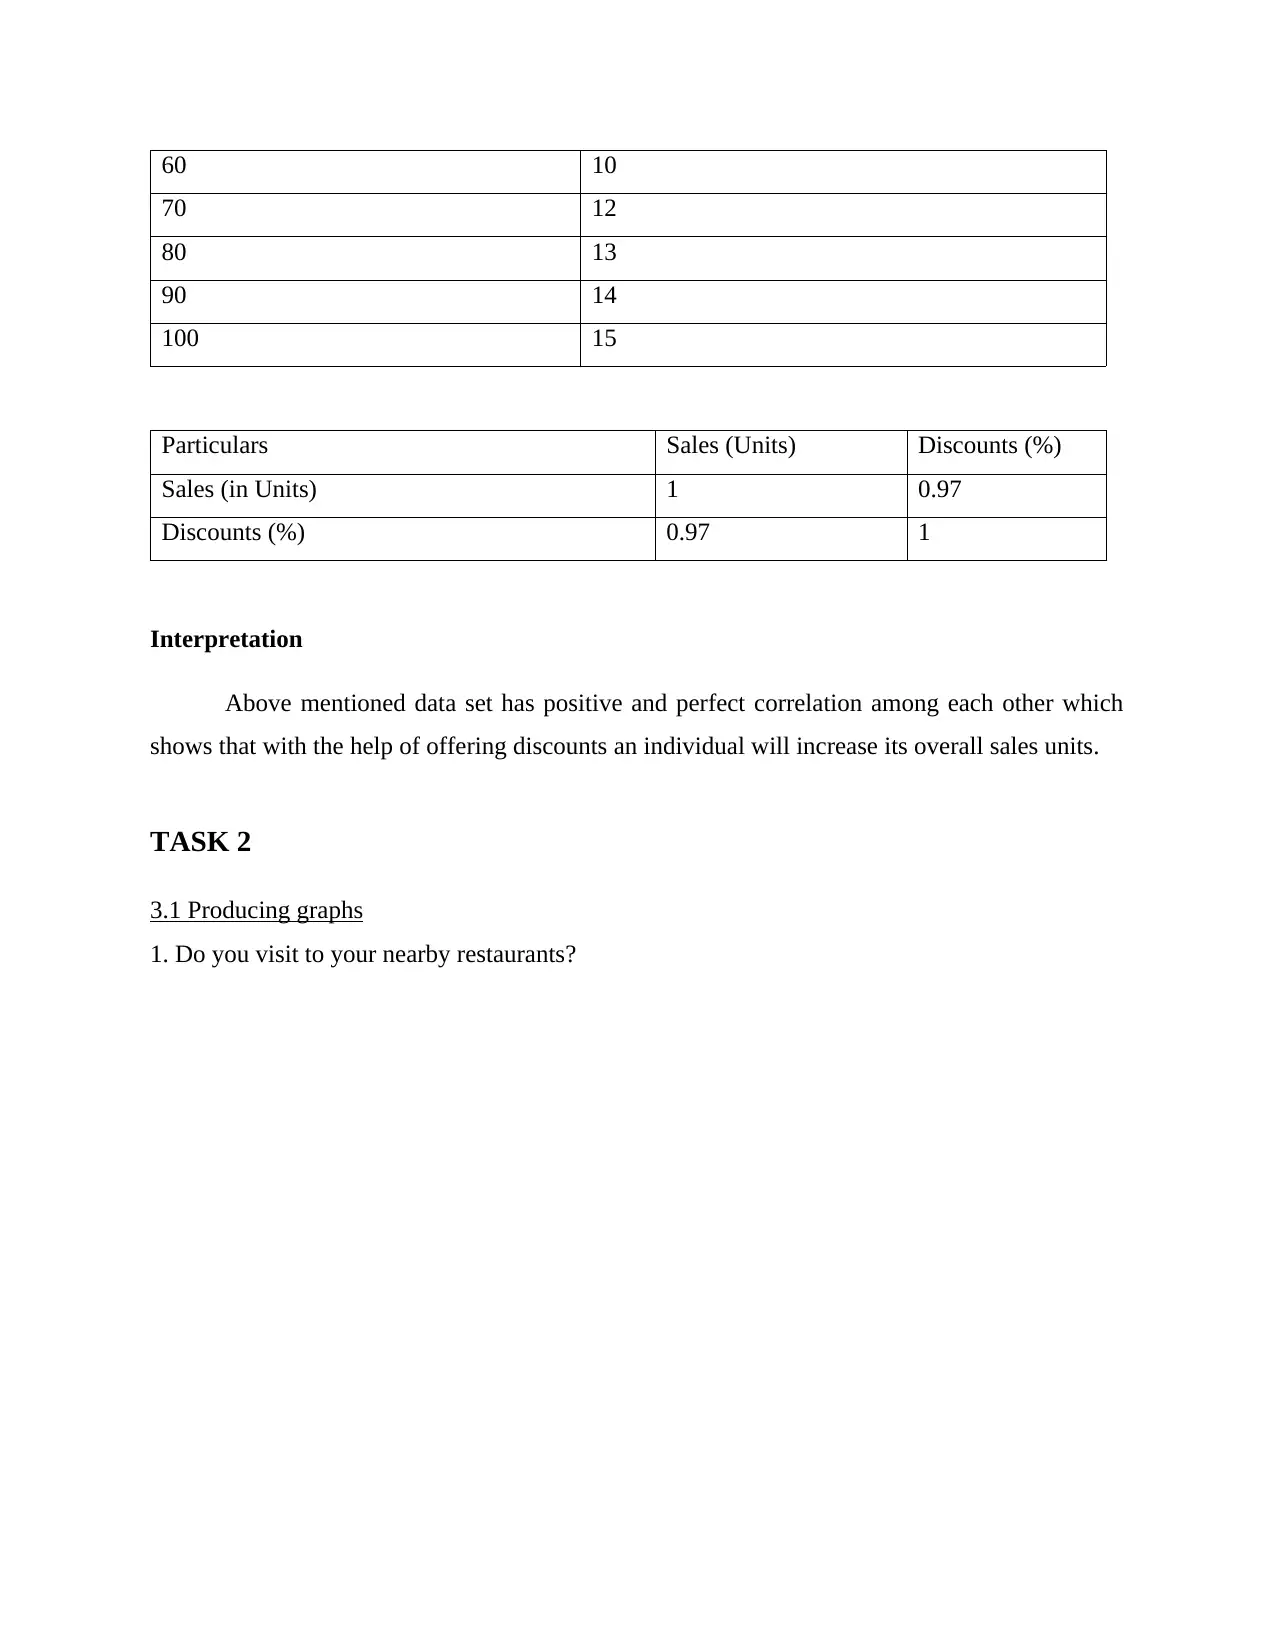
60 10
70 12
80 13
90 14
100 15
Particulars Sales (Units) Discounts (%)
Sales (in Units) 1 0.97
Discounts (%) 0.97 1
Interpretation
Above mentioned data set has positive and perfect correlation among each other which
shows that with the help of offering discounts an individual will increase its overall sales units.
TASK 2
3.1 Producing graphs
1. Do you visit to your nearby restaurants?
⊘ This is a preview!⊘
Do you want full access?
Subscribe today to unlock all pages.
Trusted by 1+ million students worldwide
1 out of 23
Related Documents


Your All-in-One AI-Powered Toolkit for Academic Success.
+13062052269
info@desklib.com
Available 24*7 on WhatsApp / Email
![[object Object]](/_next/static/media/star-bottom.7253800d.svg)
Unlock your academic potential
Copyright © 2020–2026 A2Z Services. All Rights Reserved. Developed and managed by ZUCOL.