Business Decision Making Report: FSB Canteen Project Analysis
VerifiedAdded on 2019/12/03
|18
|4014
|97
Report
AI Summary
This report provides a comprehensive analysis of business decision-making processes, focusing on a case study of a small food production company aiming to expand its business by starting a canteen at Fairfield School of Business (FSB). The research encompasses market research, including survey methodologies and questionnaire design, to gather primary data from students and staff. Statistical methods, such as mean, median, mode, range, standard deviation, interquartile range, and correlation coefficients, are employed to analyze the collected data and provide insights for decision-making. The report further explores project evaluation and review techniques, including critical path analysis and network diagrams, to determine project duration and assess investment opportunities. Various investment appraisal methods, such as ARR, NPV, and IRR, are utilized to identify the most profitable project. Additionally, the report includes visual representations of financial performance through column and bar graphs, as well as trend line graphs for sales and profit forecasting. The application of information processing tools at operational, strategic, and tactical levels, along with a discussion of project selection for investment purposes, completes the analysis, offering a holistic view of business decision-making in the context of the FSB canteen project.
Business Decision Making
Paraphrase This Document
Need a fresh take? Get an instant paraphrase of this document with our AI Paraphraser
TABLE OF CONTENTS
introduction......................................................................................................................................1
task 1................................................................................................................................................1
Q. 1 Research plan including appropriate data collection sources for business decision making
.....................................................................................................................................................1
Q. 2 Survey methodology and Sampling methods......................................................................1
Q. 3 Market survey questionnaire................................................................................................2
Task 2...............................................................................................................................................3
Q.1 Mean, median, mode and advise for line manager...............................................................3
Q. 2 Calculation of Range and Standard deviation......................................................................4
Q. 3 Calculation of interquartile range and use of quartiles and percentiles and correlation
coefficient....................................................................................................................................5
Task 3...............................................................................................................................................6
Q. 1. Column/ Bar graph showing sales, cost and profitability...................................................6
Q. 2 Trend line graph for sales and profit of the organization....................................................7
Q. 3 Power Point Presentation.....................................................................................................8
Task 4...............................................................................................................................................8
Q. 1 Different information processing tools which can be used to aid decisions making at
operational, strategic and tactical level........................................................................................8
Q. 2 Critical Path Analysis, Network Diagram and calculation of project duration...................9
Q. 3 Selection of a project for investment purpose...................................................................11
Conclusion.....................................................................................................................................14
References......................................................................................................................................15
TABLE OF FIGURES
Figure 1: Column graph showing sales, cost and profitability........................................................6
Figure 2: Bar graph showing sales, cost and profitability...............................................................7
Figure 3: Trend line graph for sales and profit................................................................................8
Figure 4: Gantt chart......................................................................................................................10
Figure 5: Network Diagram...........................................................................................................11
LIST OF TABLES
Table 1: Calculation of mean, mode and median............................................................................3
Table 2: Calculation of quartile, percentile and interquartile range................................................5
Table 4: Calculation of critical path analysis..................................................................................9
Table 5: Calculation of ARR.........................................................................................................11
Table 6: Calculation of Net Present Value....................................................................................12
Table 7: Calculation of Internal Rate of Return............................................................................13
⊘ This is a preview!⊘
Do you want full access?
Subscribe today to unlock all pages.
Trusted by 1+ million students worldwide
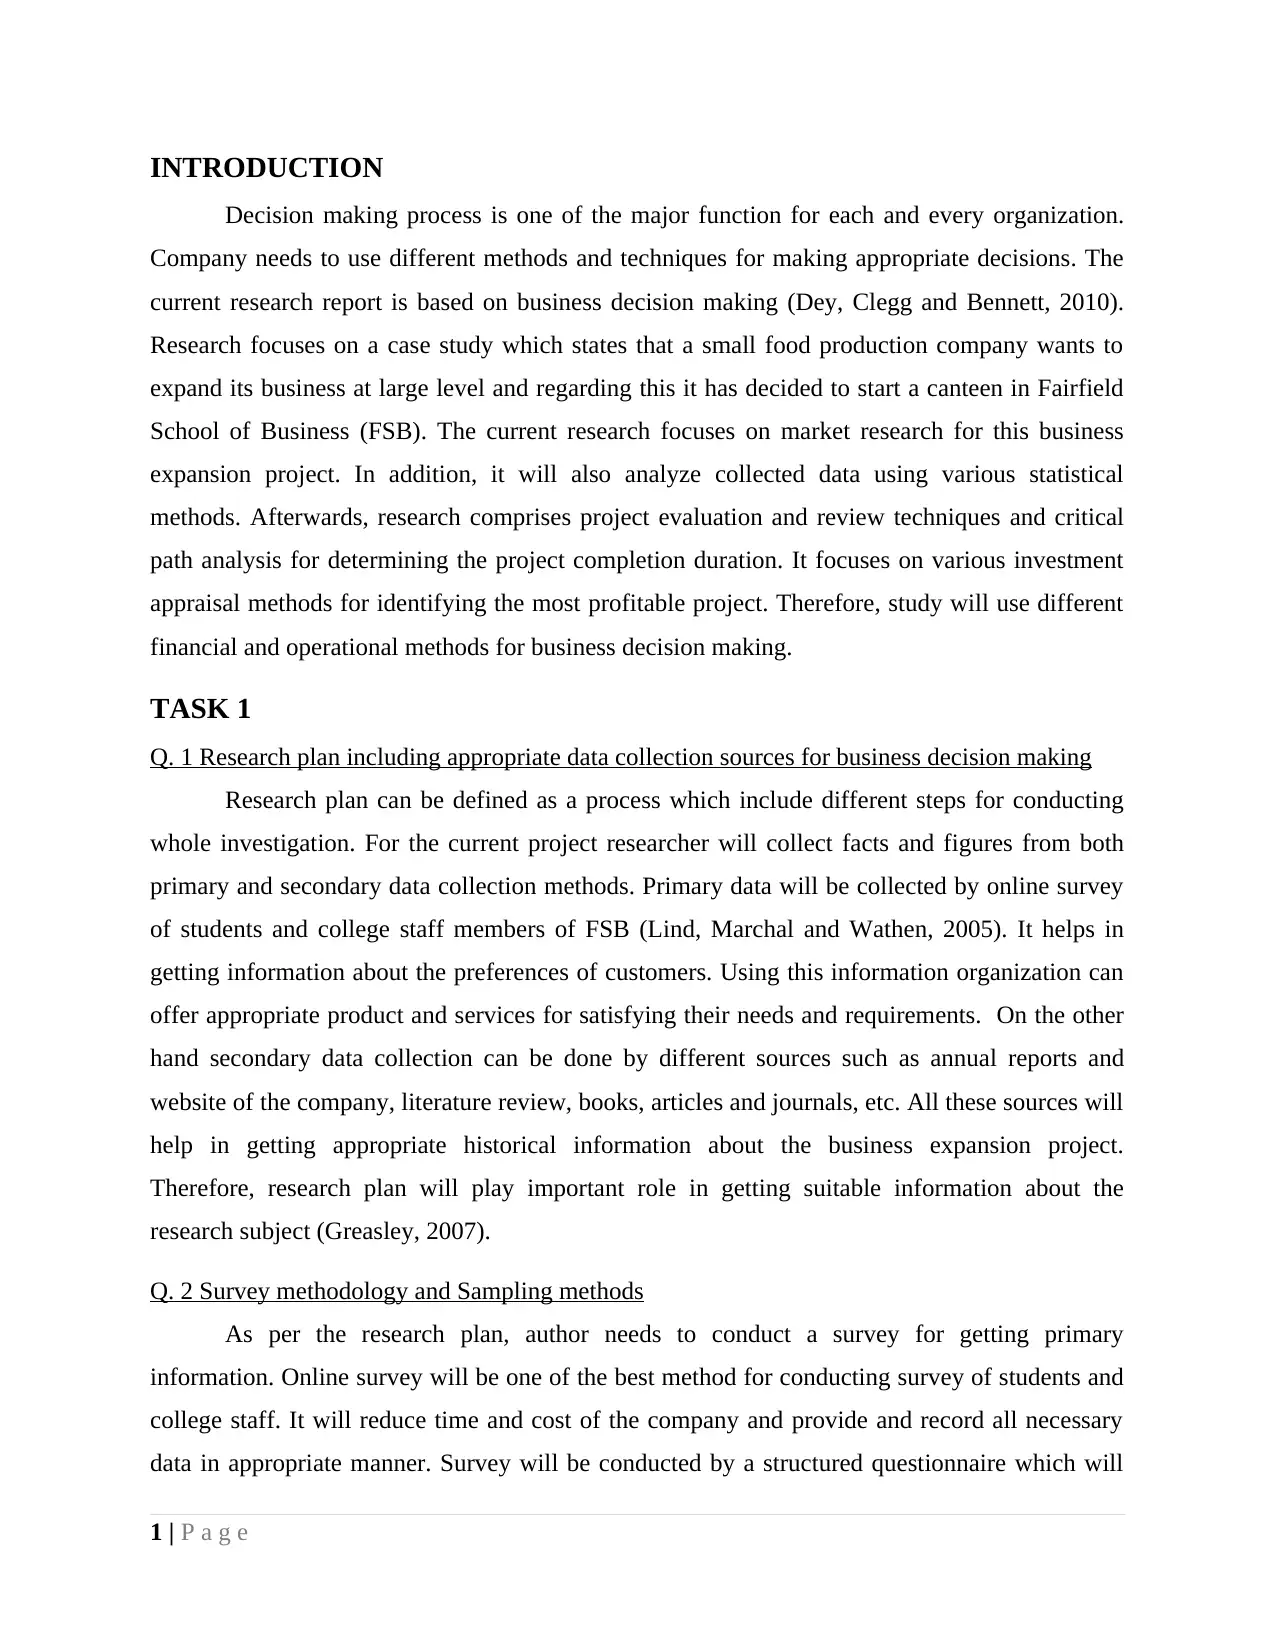
INTRODUCTION
Decision making process is one of the major function for each and every organization.
Company needs to use different methods and techniques for making appropriate decisions. The
current research report is based on business decision making (Dey, Clegg and Bennett, 2010).
Research focuses on a case study which states that a small food production company wants to
expand its business at large level and regarding this it has decided to start a canteen in Fairfield
School of Business (FSB). The current research focuses on market research for this business
expansion project. In addition, it will also analyze collected data using various statistical
methods. Afterwards, research comprises project evaluation and review techniques and critical
path analysis for determining the project completion duration. It focuses on various investment
appraisal methods for identifying the most profitable project. Therefore, study will use different
financial and operational methods for business decision making.
TASK 1
Q. 1 Research plan including appropriate data collection sources for business decision making
Research plan can be defined as a process which include different steps for conducting
whole investigation. For the current project researcher will collect facts and figures from both
primary and secondary data collection methods. Primary data will be collected by online survey
of students and college staff members of FSB (Lind, Marchal and Wathen, 2005). It helps in
getting information about the preferences of customers. Using this information organization can
offer appropriate product and services for satisfying their needs and requirements. On the other
hand secondary data collection can be done by different sources such as annual reports and
website of the company, literature review, books, articles and journals, etc. All these sources will
help in getting appropriate historical information about the business expansion project.
Therefore, research plan will play important role in getting suitable information about the
research subject (Greasley, 2007).
Q. 2 Survey methodology and Sampling methods
As per the research plan, author needs to conduct a survey for getting primary
information. Online survey will be one of the best method for conducting survey of students and
college staff. It will reduce time and cost of the company and provide and record all necessary
data in appropriate manner. Survey will be conducted by a structured questionnaire which will
1 | P a g e
Paraphrase This Document
Need a fresh take? Get an instant paraphrase of this document with our AI Paraphraser
comprise different open and close ended questions about the preferences of each participants to
college canteen. Therefore, it will be one of the best source for getting primary information
(Greasley, 2007).
Researcher will collect data from students and college staff of FSB so, these are
considered as research population. Author will select appropriate sample from research universe
using the random number sampling method. It will help in providing equal chance to each
member of research universe to select in sample which will reduce the sampling error. Sample
size for the current investigation will be 20 which will include equal number of students and
college staff members of FSB (Hobbs, 2009).
Q. 3 Market survey questionnaire
Demographic information of students and college staff of FSB
Name (Optional):
Student or college staff:
Age:
Class:
1. Do you require a college canteen or student common room in your institute?
Yes
No
2. What is the most required foo product for you during college classes?
Instant food products
Proper Lunch
Snacks
Sweets
3. How much pounds you have spent in the college canteen?
0-10
10-20
20-30
30-40
40-50
50-60
2 | P a g e
60-70
4. What is the major attribute which you will require in the products of college canteen?
Price
Quality
Service
Cleanliness
Availability of products
5. To which extent you believe that FSB should focus on marketing and advertising of college
canteen?
Strongly Agreed
Agreed
Neutral
Disagreed
Strongly disagreed
6. Do you attract by any promotional offers in college canteen?
Yes
No
7. What will be the most effective source for marketing and advertising of college canteen?
Social media
Posters
Flax
Online and digital marketing
8. Please, provide appropriate suggestions for establishing a new canteen in FSB College.
TASK 2
Q.1 Mean, median, mode and advise for line manager
Table 1: Calculation of mean, mode and median
3 | P a g e
⊘ This is a preview!⊘
Do you want full access?
Subscribe today to unlock all pages.
Trusted by 1+ million students worldwide
Monthly
Expenditure /£
No. of
Customers (f)
Midpoin
t of each
interval
(m)
Midpoint
*
frequenc
y (mf)
Cumulativ
e frequency m2 m2f
0-10 13 5 65 13 25 325
1020 25 15 375 38 225 5625
20-30 37 25 925 75 625 23125
30-40 22 35 770 97 1225 26950
40-50 21 45 945 118 2025 42525
50-60 20 55 1100 138 3025 60500
60-70 12 65 780 150 4225 50700
Total 150 4960 20975
0
Mean=∑ mf
∑ f
Median=L+(n/2)−cfb
fm ∗W
Mode=L+ f m−f m−1
( f m−f m−1 ) +( f m−f m +1)∗W
Mean 33.066
Median 30
Mode 14.44
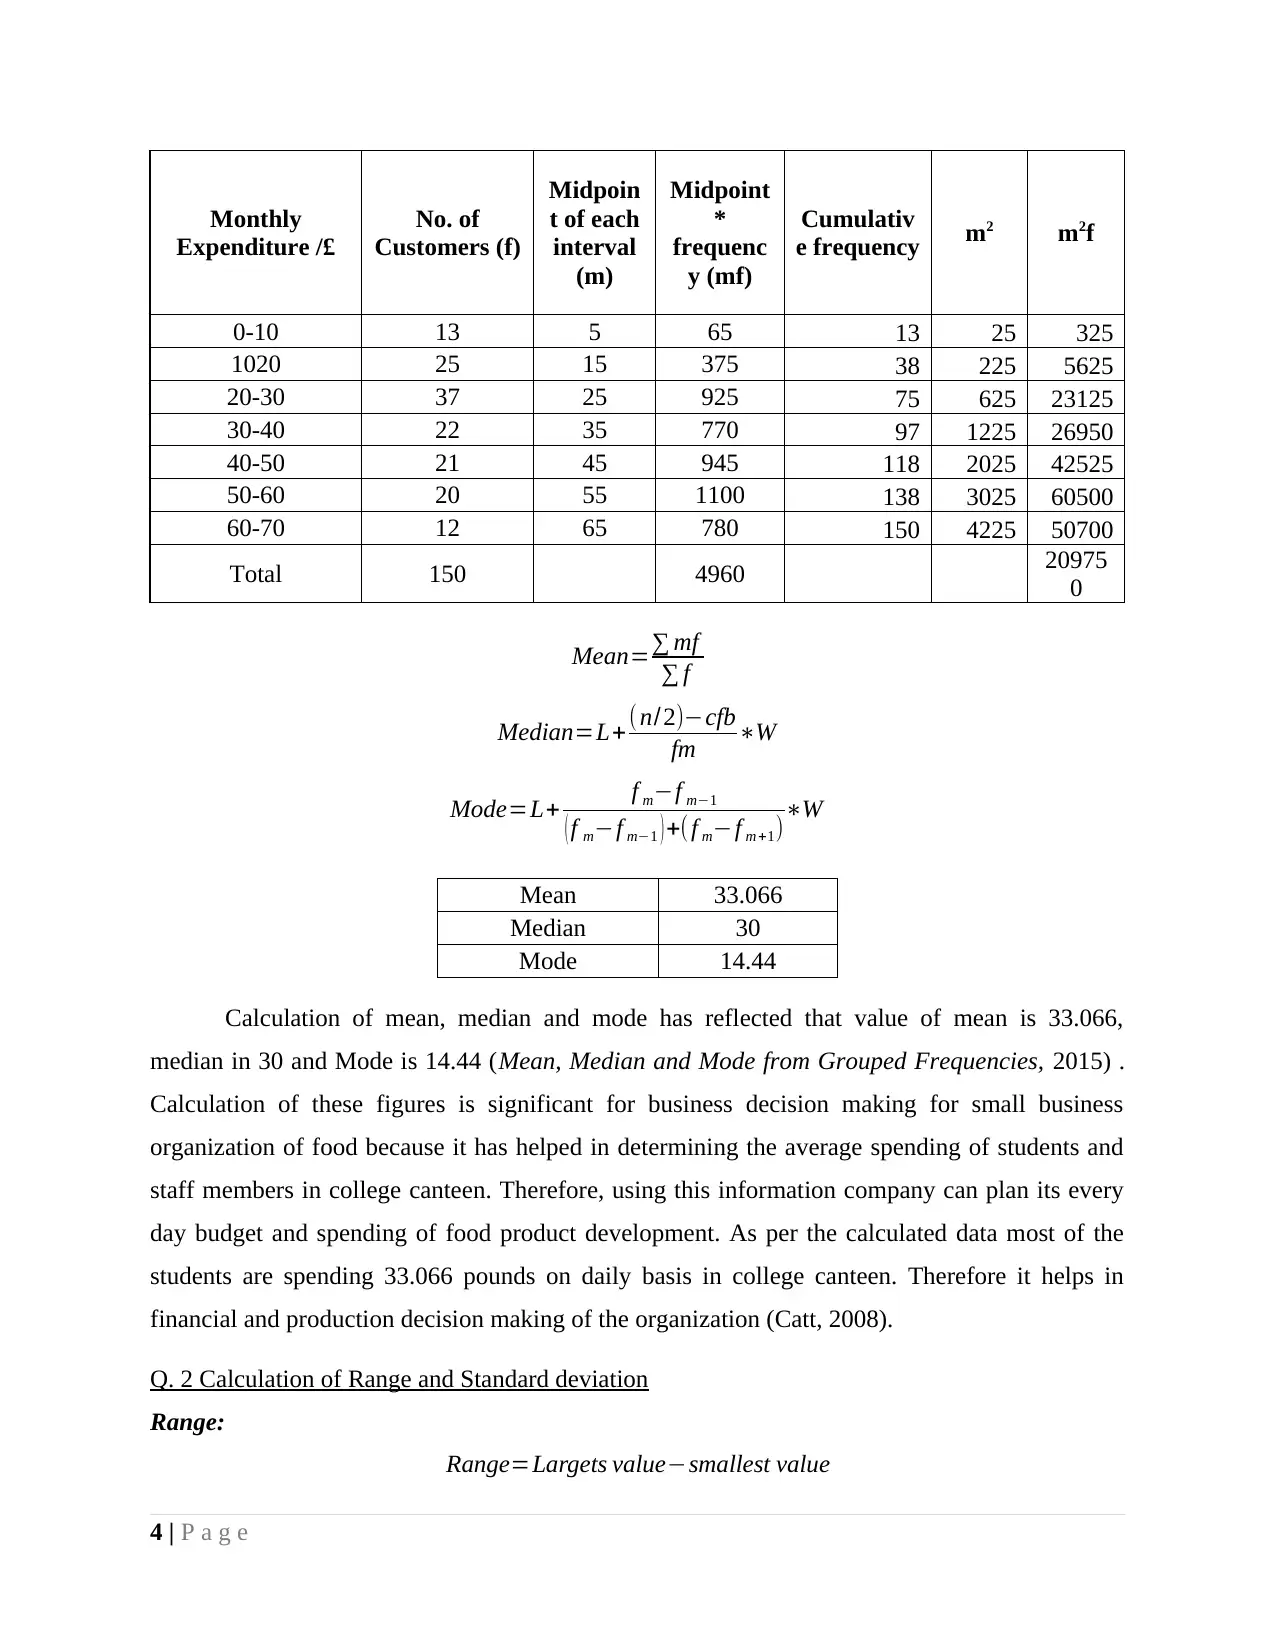
Calculation of mean, median and mode has reflected that value of mean is 33.066,
median in 30 and Mode is 14.44 (Mean, Median and Mode from Grouped Frequencies, 2015) .
Calculation of these figures is significant for business decision making for small business
organization of food because it has helped in determining the average spending of students and
staff members in college canteen. Therefore, using this information company can plan its every
day budget and spending of food product development. As per the calculated data most of the
students are spending 33.066 pounds on daily basis in college canteen. Therefore it helps in
financial and production decision making of the organization (Catt, 2008).
Q. 2 Calculation of Range and Standard deviation
Range:
Range=Largets value−smallest value
4 | P a g e
Expenditure /£
No. of
Customers (f)
Midpoin
t of each
interval
(m)
Midpoint
*
frequenc
y (mf)
Cumulativ
e frequency m2 m2f
0-10 13 5 65 13 25 325
1020 25 15 375 38 225 5625
20-30 37 25 925 75 625 23125
30-40 22 35 770 97 1225 26950
40-50 21 45 945 118 2025 42525
50-60 20 55 1100 138 3025 60500
60-70 12 65 780 150 4225 50700
Total 150 4960 20975
0
Mean=∑ mf
∑ f
Median=L+(n/2)−cfb
fm ∗W
Mode=L+ f m−f m−1
( f m−f m−1 ) +( f m−f m +1)∗W
Mean 33.066
Median 30
Mode 14.44
Calculation of mean, median and mode has reflected that value of mean is 33.066,
median in 30 and Mode is 14.44 (Mean, Median and Mode from Grouped Frequencies, 2015) .
Calculation of these figures is significant for business decision making for small business
organization of food because it has helped in determining the average spending of students and
staff members in college canteen. Therefore, using this information company can plan its every
day budget and spending of food product development. As per the calculated data most of the
students are spending 33.066 pounds on daily basis in college canteen. Therefore it helps in
financial and production decision making of the organization (Catt, 2008).
Q. 2 Calculation of Range and Standard deviation
Range:
Range=Largets value−smallest value
4 | P a g e
Paraphrase This Document
Need a fresh take? Get an instant paraphrase of this document with our AI Paraphraser
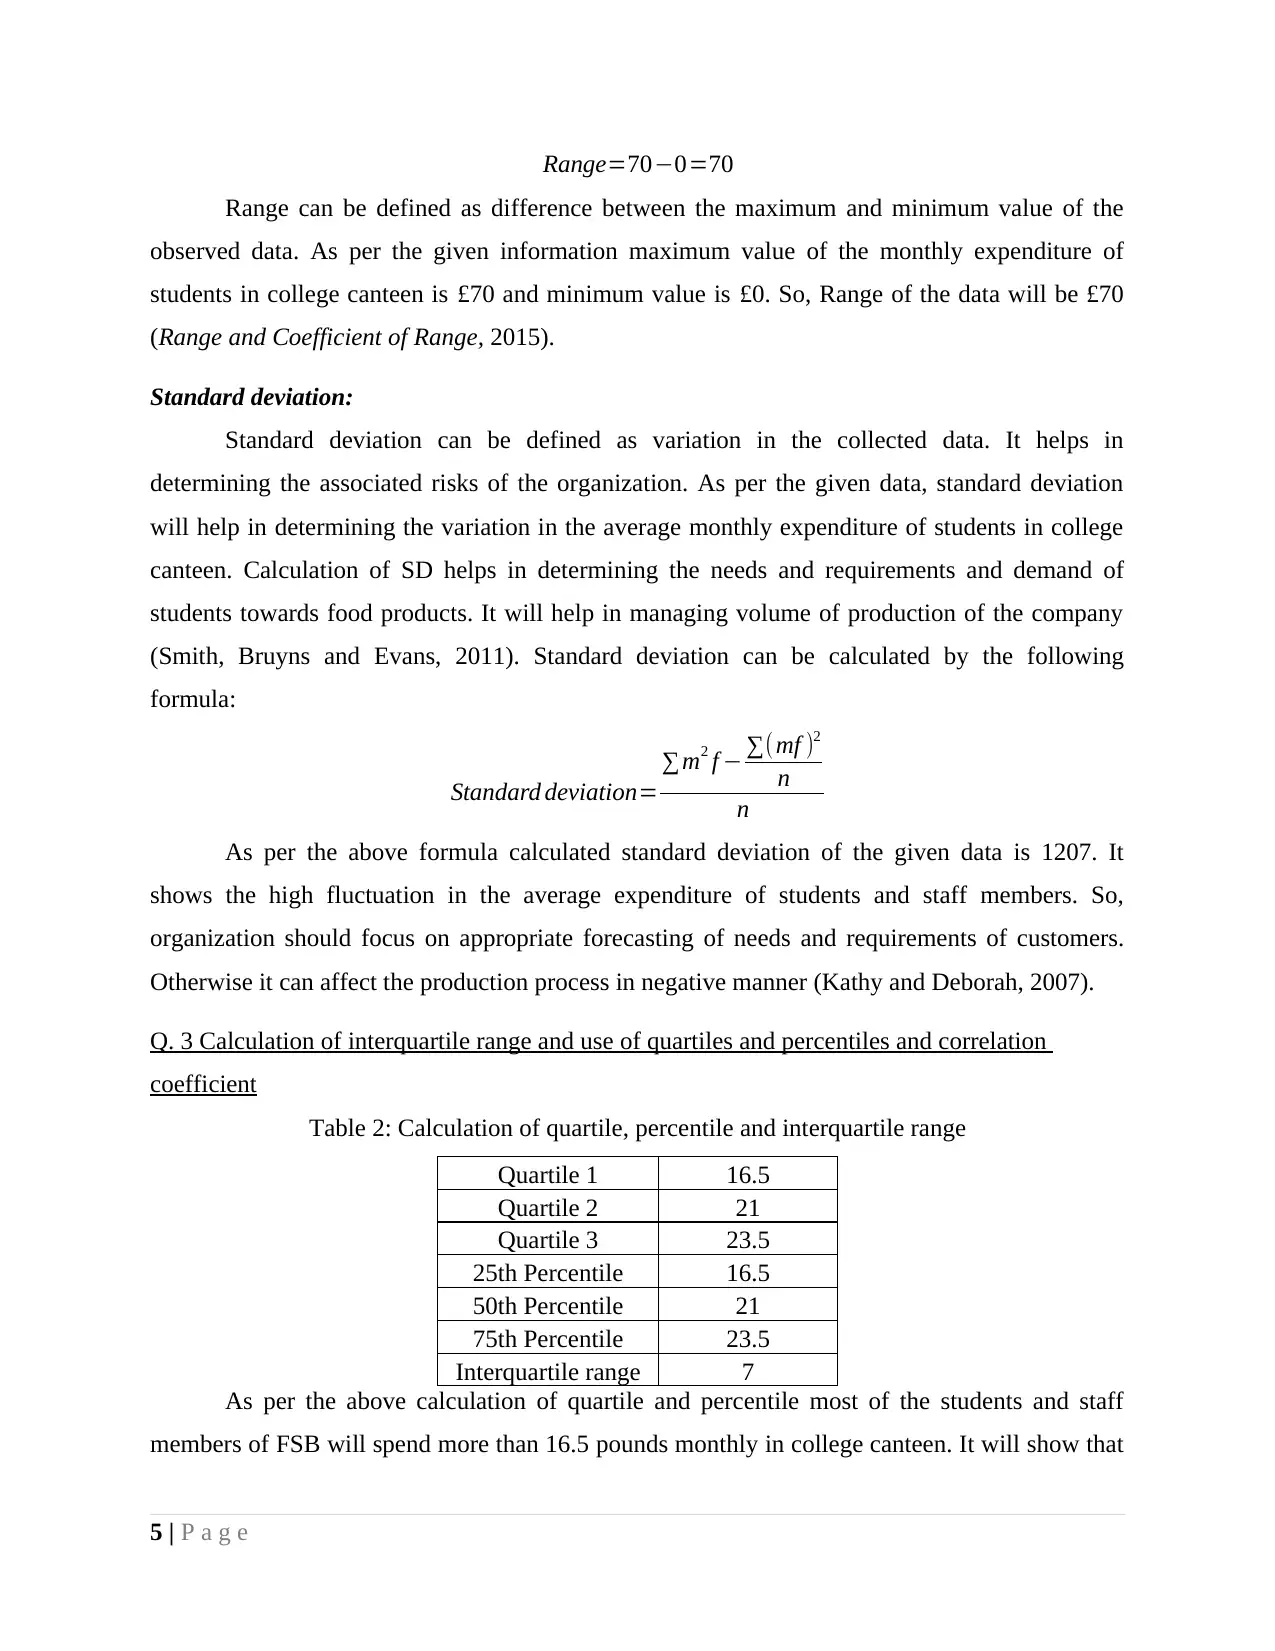
Range=70−0=70
Range can be defined as difference between the maximum and minimum value of the
observed data. As per the given information maximum value of the monthly expenditure of
students in college canteen is £70 and minimum value is £0. So, Range of the data will be £70
(Range and Coefficient of Range, 2015).
Standard deviation:
Standard deviation can be defined as variation in the collected data. It helps in
determining the associated risks of the organization. As per the given data, standard deviation
will help in determining the variation in the average monthly expenditure of students in college
canteen. Calculation of SD helps in determining the needs and requirements and demand of
students towards food products. It will help in managing volume of production of the company
(Smith, Bruyns and Evans, 2011). Standard deviation can be calculated by the following
formula:
Standard deviation=
∑m2 f − ∑(mf )2
n
n
As per the above formula calculated standard deviation of the given data is 1207. It
shows the high fluctuation in the average expenditure of students and staff members. So,
organization should focus on appropriate forecasting of needs and requirements of customers.
Otherwise it can affect the production process in negative manner (Kathy and Deborah, 2007).
Q. 3 Calculation of interquartile range and use of quartiles and percentiles and correlation
coefficient
Table 2: Calculation of quartile, percentile and interquartile range
Quartile 1 16.5
Quartile 2 21
Quartile 3 23.5
25th Percentile 16.5
50th Percentile 21
75th Percentile 23.5
Interquartile range 7
As per the above calculation of quartile and percentile most of the students and staff
members of FSB will spend more than 16.5 pounds monthly in college canteen. It will show that
5 | P a g e
highest demand of the food products in college. Along with this, interquartile rage is 7 which
shows the minimum difference between spending of students. So, company can invest in this
project because it is demanded by the customers (Jankowicz, 2005).
TASK 3
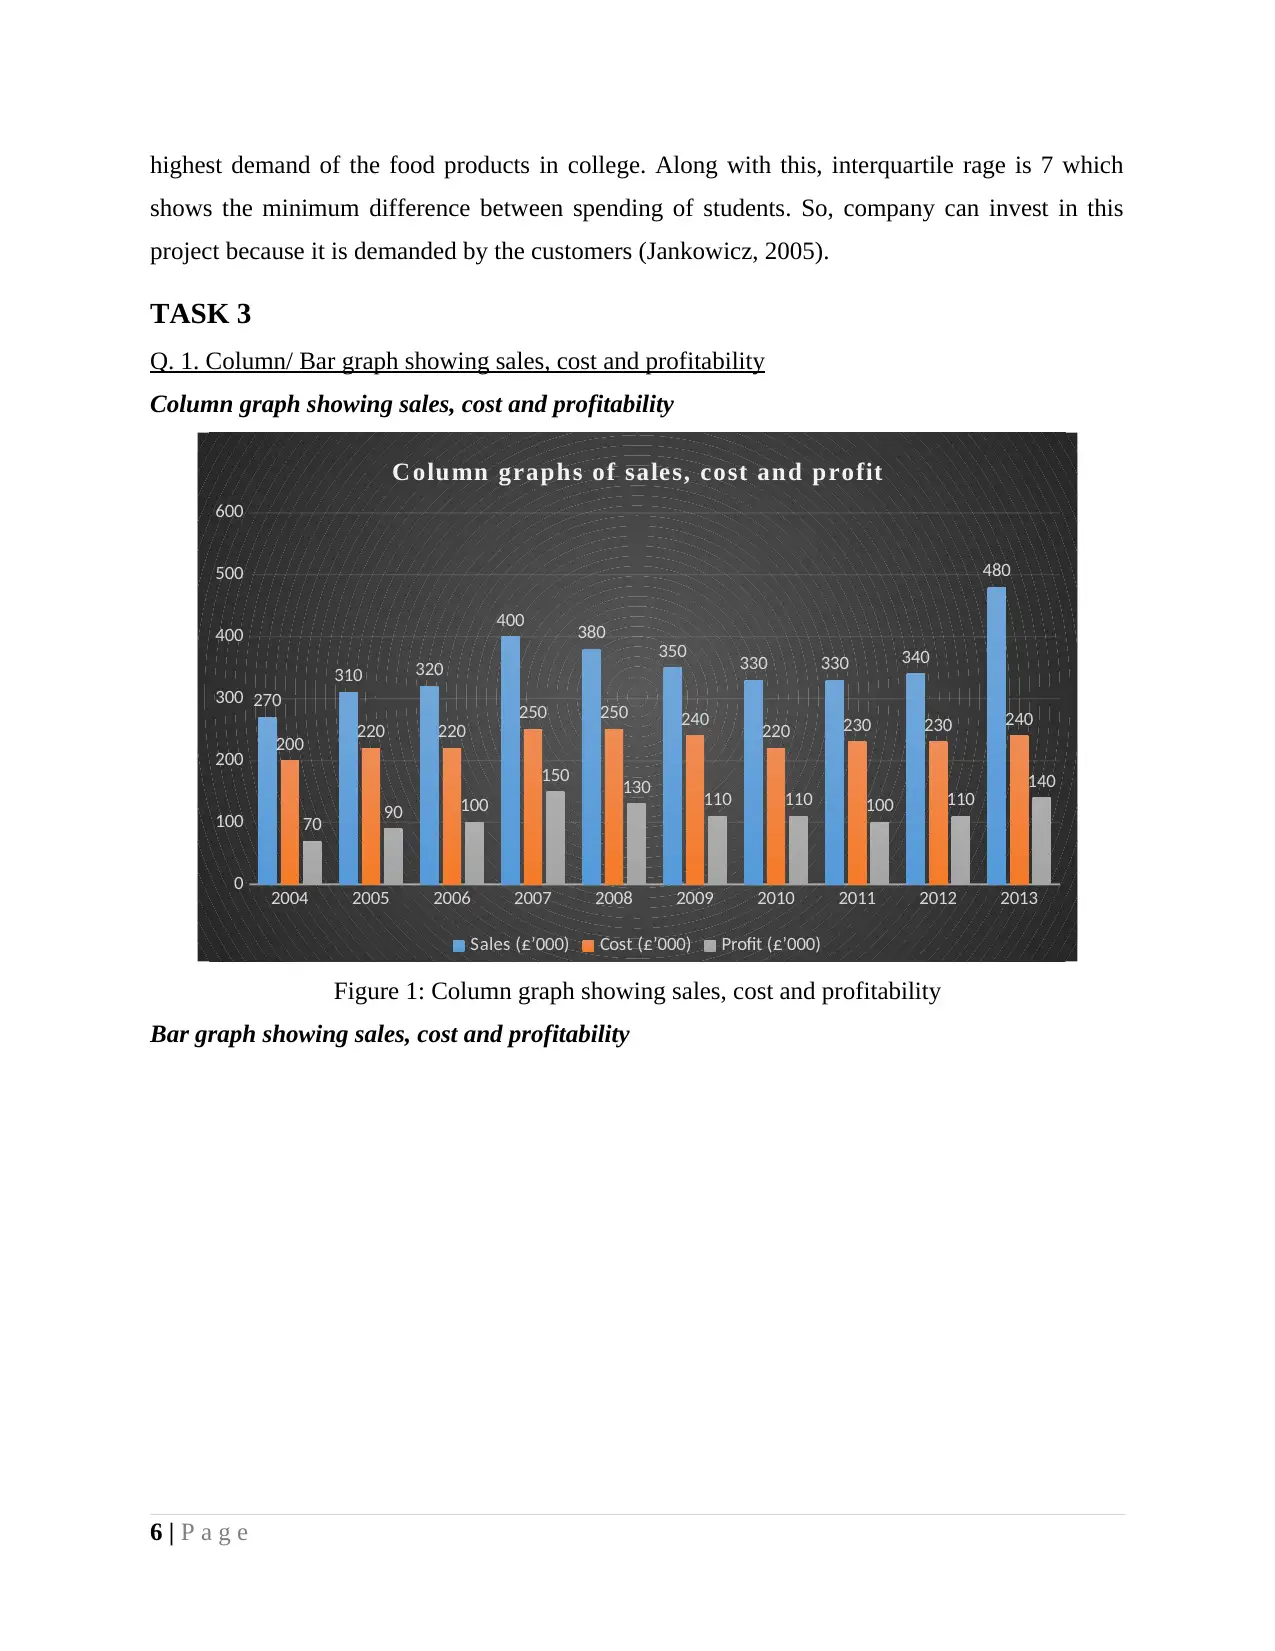
Q. 1. Column/ Bar graph showing sales, cost and profitability
Column graph showing sales, cost and profitability
2004 2005 2006 2007 2008 2009 2010 2011 2012 2013
0
100
200
300
400
500
600
270
310 320
400 380 350 330 330 340
480
200 220 220 250 250 240 220 230 230 240
70 90 100
150 130 110 110 100 110 140
C olumn graphs of sales, cost and profit
Sales (£’000) Cost (£’000) Profit (£’000)
Figure 1: Column graph showing sales, cost and profitability
Bar graph showing sales, cost and profitability
6 | P a g e
shows the minimum difference between spending of students. So, company can invest in this
project because it is demanded by the customers (Jankowicz, 2005).
TASK 3
Q. 1. Column/ Bar graph showing sales, cost and profitability
Column graph showing sales, cost and profitability
2004 2005 2006 2007 2008 2009 2010 2011 2012 2013
0
100
200
300
400
500
600
270
310 320
400 380 350 330 330 340
480
200 220 220 250 250 240 220 230 230 240
70 90 100
150 130 110 110 100 110 140
C olumn graphs of sales, cost and profit
Sales (£’000) Cost (£’000) Profit (£’000)
Figure 1: Column graph showing sales, cost and profitability
Bar graph showing sales, cost and profitability
6 | P a g e
⊘ This is a preview!⊘
Do you want full access?
Subscribe today to unlock all pages.
Trusted by 1+ million students worldwide
2004
2005
2006
2007
2008
2009
2010
2011
2012
2013
0 100 200 300 400 500 600
270
310
320
400
380
350
330
330
340
480
200
220
220
250
250
240
220
230
230
240
70
90
100
150
130
110
110
100
110
140
Bar
graphs of sales, cost and profit
Profit (£’000) Cost (£’000) Sales (£’000)
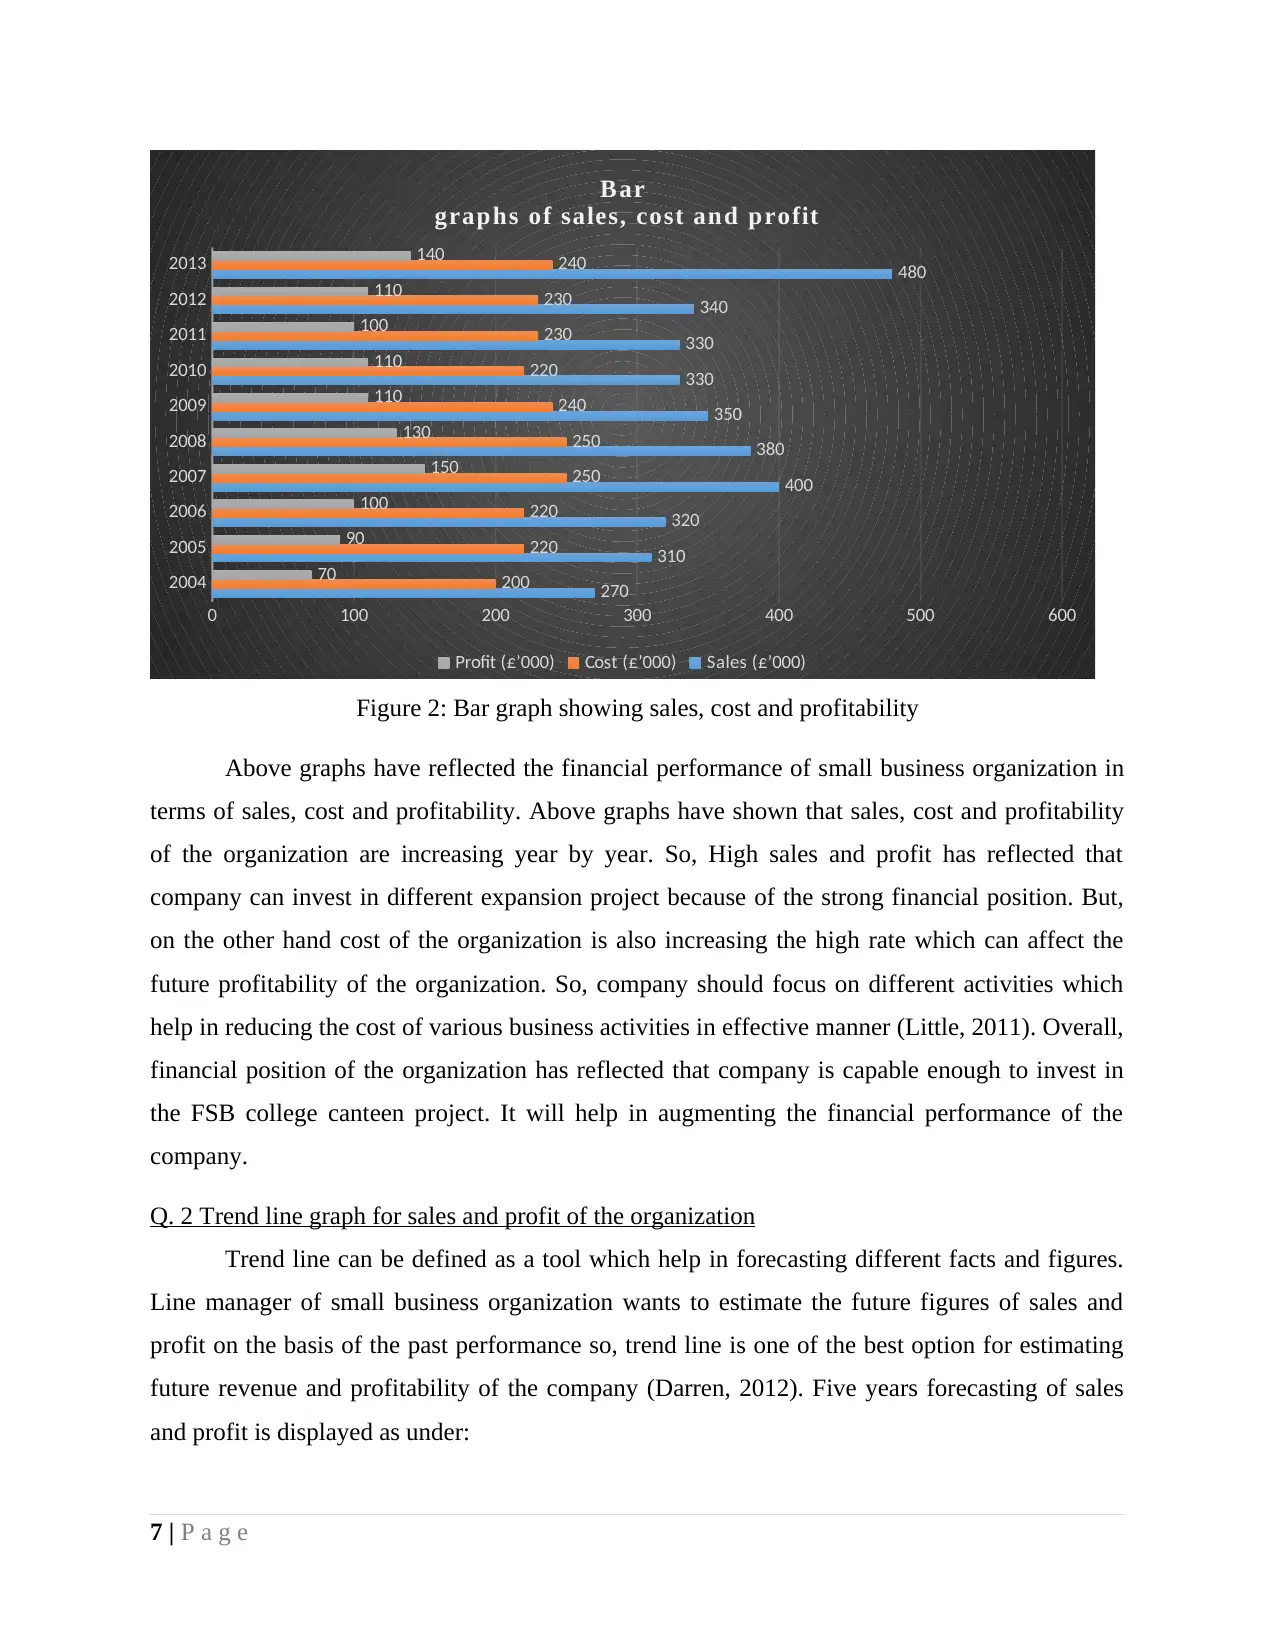
Figure 2: Bar graph showing sales, cost and profitability
Above graphs have reflected the financial performance of small business organization in
terms of sales, cost and profitability. Above graphs have shown that sales, cost and profitability
of the organization are increasing year by year. So, High sales and profit has reflected that
company can invest in different expansion project because of the strong financial position. But,
on the other hand cost of the organization is also increasing the high rate which can affect the
future profitability of the organization. So, company should focus on different activities which
help in reducing the cost of various business activities in effective manner (Little, 2011). Overall,
financial position of the organization has reflected that company is capable enough to invest in
the FSB college canteen project. It will help in augmenting the financial performance of the
company.
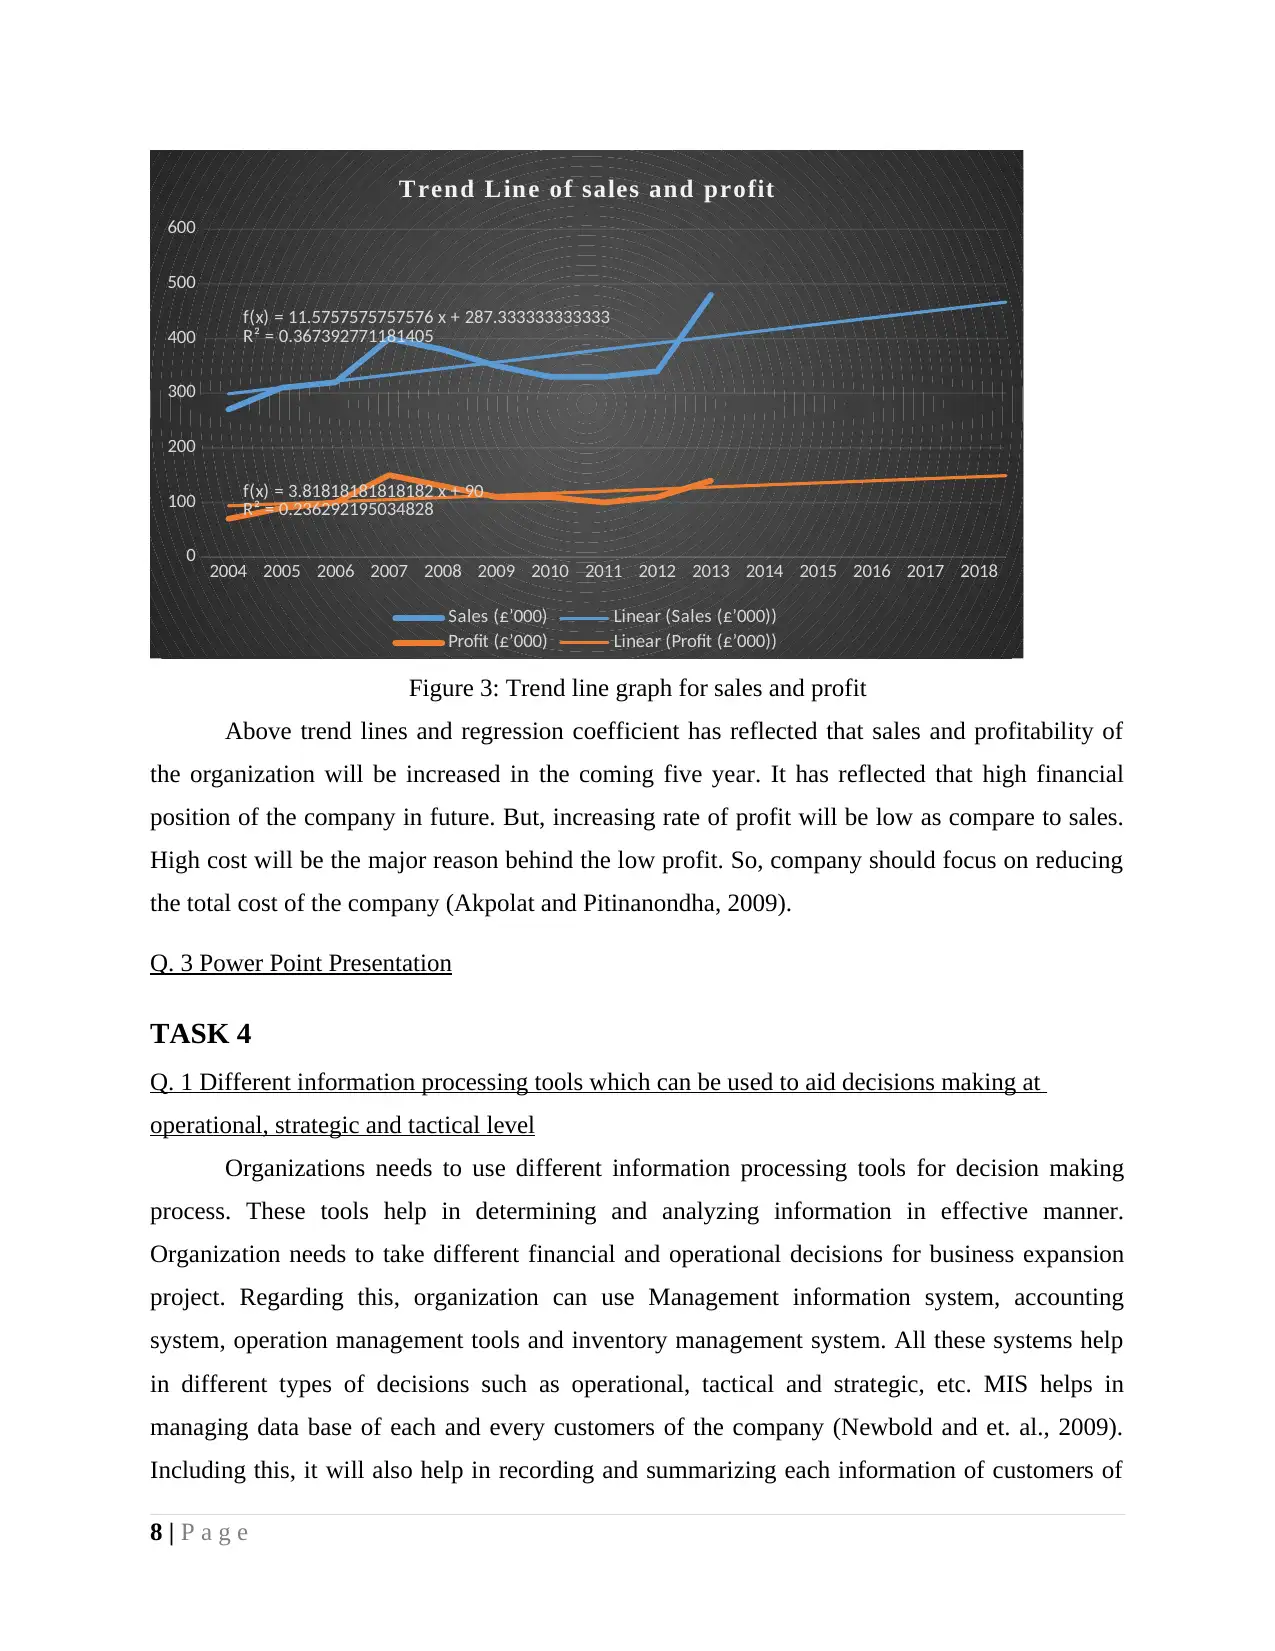
Q. 2 Trend line graph for sales and profit of the organization
Trend line can be defined as a tool which help in forecasting different facts and figures.
Line manager of small business organization wants to estimate the future figures of sales and
profit on the basis of the past performance so, trend line is one of the best option for estimating
future revenue and profitability of the company (Darren, 2012). Five years forecasting of sales
and profit is displayed as under:
7 | P a g e
2005
2006
2007
2008
2009
2010
2011
2012
2013
0 100 200 300 400 500 600
270
310
320
400
380
350
330
330
340
480
200
220
220
250
250
240
220
230
230
240
70
90
100
150
130
110
110
100
110
140
Bar
graphs of sales, cost and profit
Profit (£’000) Cost (£’000) Sales (£’000)
Figure 2: Bar graph showing sales, cost and profitability
Above graphs have reflected the financial performance of small business organization in
terms of sales, cost and profitability. Above graphs have shown that sales, cost and profitability
of the organization are increasing year by year. So, High sales and profit has reflected that
company can invest in different expansion project because of the strong financial position. But,
on the other hand cost of the organization is also increasing the high rate which can affect the
future profitability of the organization. So, company should focus on different activities which
help in reducing the cost of various business activities in effective manner (Little, 2011). Overall,
financial position of the organization has reflected that company is capable enough to invest in
the FSB college canteen project. It will help in augmenting the financial performance of the
company.
Q. 2 Trend line graph for sales and profit of the organization
Trend line can be defined as a tool which help in forecasting different facts and figures.
Line manager of small business organization wants to estimate the future figures of sales and
profit on the basis of the past performance so, trend line is one of the best option for estimating
future revenue and profitability of the company (Darren, 2012). Five years forecasting of sales
and profit is displayed as under:
7 | P a g e
Paraphrase This Document
Need a fresh take? Get an instant paraphrase of this document with our AI Paraphraser
2004 2005 2006 2007 2008 2009 2010 2011 2012 2013 2014 2015 2016 2017 2018
0
100
200
300
400
500
600
f(x) = 11.5757575757576 x + 287.333333333333
R² = 0.367392771181405
f(x) = 3.81818181818182 x + 90
R² = 0.236292195034828
Trend Line of sales and profit
Sales (£’000) Linear (Sales (£’000))
Profit (£’000) Linear (Profit (£’000))
Figure 3: Trend line graph for sales and profit
Above trend lines and regression coefficient has reflected that sales and profitability of
the organization will be increased in the coming five year. It has reflected that high financial
position of the company in future. But, increasing rate of profit will be low as compare to sales.
High cost will be the major reason behind the low profit. So, company should focus on reducing
the total cost of the company (Akpolat and Pitinanondha, 2009).
Q. 3 Power Point Presentation
TASK 4
Q. 1 Different information processing tools which can be used to aid decisions making at
operational, strategic and tactical level
Organizations needs to use different information processing tools for decision making
process. These tools help in determining and analyzing information in effective manner.
Organization needs to take different financial and operational decisions for business expansion
project. Regarding this, organization can use Management information system, accounting
system, operation management tools and inventory management system. All these systems help
in different types of decisions such as operational, tactical and strategic, etc. MIS helps in
managing data base of each and every customers of the company (Newbold and et. al., 2009).
Including this, it will also help in recording and summarizing each information of customers of
8 | P a g e
the organization. These information can be used by organization for different types of decisions
regarding the production process. In addition, accounting system is also one of the important tool
for taking different decisions regarding the financial management. It helps in managing funds,
developing budget of the organization. Afterwards, inventory management system helps in
maintaining economic order quantity of the organization. Along with this, it will play important
role in managing ordering, holding and safety cost of inventory. In addition, using this system
company can reduce extra inventory cost of the organization. Therefore, all these tools and
techniques help in different decision making process of the organization (Wallnöfer and Hacklin,
2012).
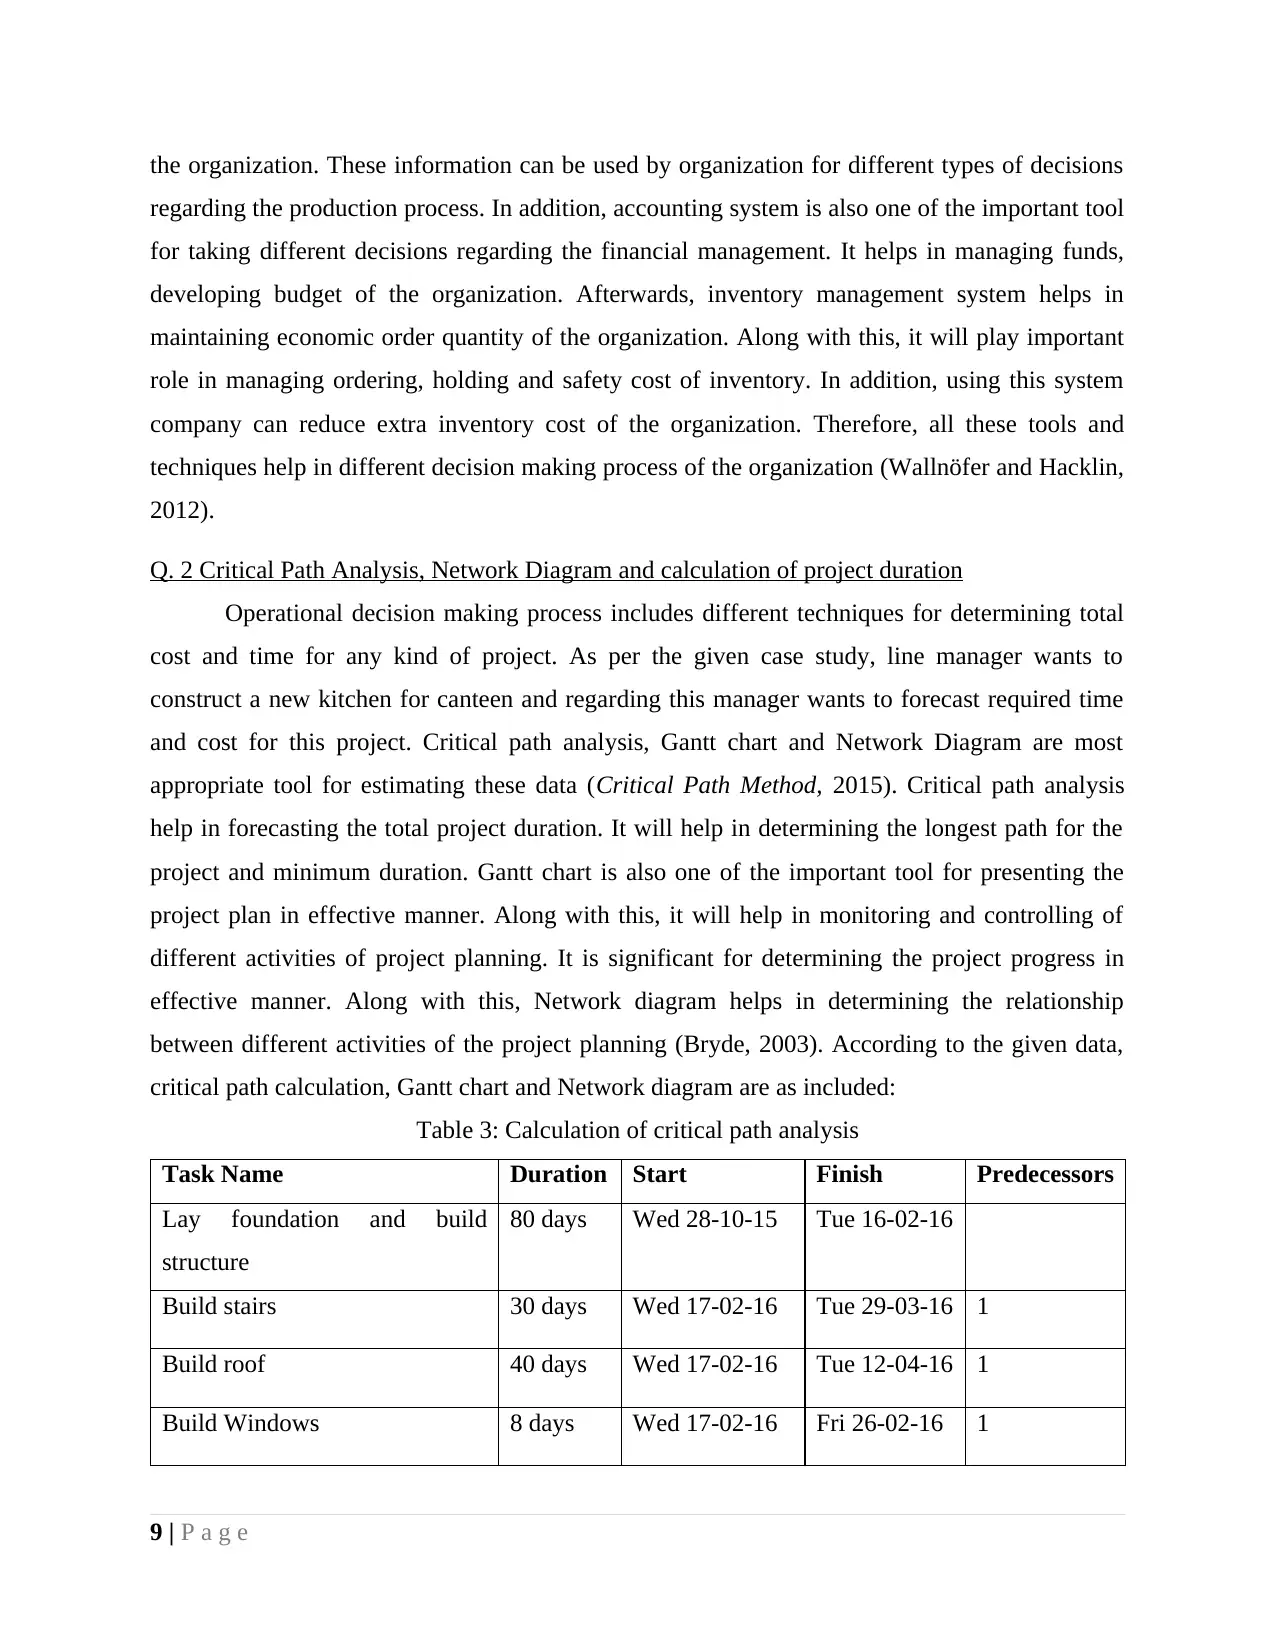
Q. 2 Critical Path Analysis, Network Diagram and calculation of project duration
Operational decision making process includes different techniques for determining total
cost and time for any kind of project. As per the given case study, line manager wants to
construct a new kitchen for canteen and regarding this manager wants to forecast required time
and cost for this project. Critical path analysis, Gantt chart and Network Diagram are most
appropriate tool for estimating these data (Critical Path Method, 2015). Critical path analysis
help in forecasting the total project duration. It will help in determining the longest path for the
project and minimum duration. Gantt chart is also one of the important tool for presenting the
project plan in effective manner. Along with this, it will help in monitoring and controlling of
different activities of project planning. It is significant for determining the project progress in
effective manner. Along with this, Network diagram helps in determining the relationship
between different activities of the project planning (Bryde, 2003). According to the given data,
critical path calculation, Gantt chart and Network diagram are as included:
Table 3: Calculation of critical path analysis
Task Name Duration Start Finish Predecessors
Lay foundation and build
structure
80 days Wed 28-10-15 Tue 16-02-16
Build stairs 30 days Wed 17-02-16 Tue 29-03-16 1
Build roof 40 days Wed 17-02-16 Tue 12-04-16 1
Build Windows 8 days Wed 17-02-16 Fri 26-02-16 1
9 | P a g e
regarding the production process. In addition, accounting system is also one of the important tool
for taking different decisions regarding the financial management. It helps in managing funds,
developing budget of the organization. Afterwards, inventory management system helps in
maintaining economic order quantity of the organization. Along with this, it will play important
role in managing ordering, holding and safety cost of inventory. In addition, using this system
company can reduce extra inventory cost of the organization. Therefore, all these tools and
techniques help in different decision making process of the organization (Wallnöfer and Hacklin,
2012).
Q. 2 Critical Path Analysis, Network Diagram and calculation of project duration
Operational decision making process includes different techniques for determining total
cost and time for any kind of project. As per the given case study, line manager wants to
construct a new kitchen for canteen and regarding this manager wants to forecast required time
and cost for this project. Critical path analysis, Gantt chart and Network Diagram are most
appropriate tool for estimating these data (Critical Path Method, 2015). Critical path analysis
help in forecasting the total project duration. It will help in determining the longest path for the
project and minimum duration. Gantt chart is also one of the important tool for presenting the
project plan in effective manner. Along with this, it will help in monitoring and controlling of
different activities of project planning. It is significant for determining the project progress in
effective manner. Along with this, Network diagram helps in determining the relationship
between different activities of the project planning (Bryde, 2003). According to the given data,
critical path calculation, Gantt chart and Network diagram are as included:
Table 3: Calculation of critical path analysis
Task Name Duration Start Finish Predecessors
Lay foundation and build
structure
80 days Wed 28-10-15 Tue 16-02-16
Build stairs 30 days Wed 17-02-16 Tue 29-03-16 1
Build roof 40 days Wed 17-02-16 Tue 12-04-16 1
Build Windows 8 days Wed 17-02-16 Fri 26-02-16 1
9 | P a g e
⊘ This is a preview!⊘
Do you want full access?
Subscribe today to unlock all pages.
Trusted by 1+ million students worldwide
1 out of 18
Related Documents


Your All-in-One AI-Powered Toolkit for Academic Success.
+13062052269
info@desklib.com
Available 24*7 on WhatsApp / Email
![[object Object]](/_next/static/media/star-bottom.7253800d.svg)
Unlock your academic potential
Copyright © 2020–2026 A2Z Services. All Rights Reserved. Developed and managed by ZUCOL.