Business Decision Making Report: Brit College Analysis
VerifiedAdded on 2020/02/12
|18
|3549
|54
Report
AI Summary
This report analyzes business decision-making processes for Brit College, focusing on data collection, analysis, and recommendations. The report utilizes both primary and secondary data sources, including surveys and existing literature, to assess the college's performance. It presents a detailed plan for data collection, survey methodology, and questionnaire design. Data is analyzed using graphical representations, including scatter plots, line charts, and bar charts, along with statistical measures such as mean, median, standard deviation, and correlation coefficients. The analysis includes interpretations of the graphical data and conclusions drawn from the statistical findings. The report also incorporates trend line analysis to project future performance and provides formal business reports with specific recommendations for improvement, covering areas such as course offerings, student support, and facility enhancements. The conclusion summarizes the key findings and reiterates the importance of the recommendations for the college's future growth and success. The report concludes with references to the sources used.

BDM
Paraphrase This Document
Need a fresh take? Get an instant paraphrase of this document with our AI Paraphraser
Table of Contents
INTRODUCTION ..........................................................................................................................3
TASK 1............................................................................................................................................3
1.1 Plan for collecting the primary and secondary data..............................................................3
1.2 Survey methodology with sample framing...........................................................................4
1.3 Questionnaire for Brit college...............................................................................................4
TASK 2............................................................................................................................................5
2.1 Graphical representation.......................................................................................................5
2.2 Interpretation of 2.1...............................................................................................................7
2.3 Analysis ................................................................................................................................7
3.1 Line and bar charts with valid conclusion.............................................................................8
3.2 Trend line............................................................................................................................10
3.3 Covered in presentation.......................................................................................................12
3.4 Formal business reports with recommendations.................................................................12
TASK 4..........................................................................................................................................13
4.1 Tools and techniques in support decision making..............................................................13
4.2 Project plan..........................................................................................................................13
...................................................................................................................................................15
...................................................................................................................................................15
...................................................................................................................................................16
4.3 Company cash flow.............................................................................................................16
CONCLUSION..............................................................................................................................18
REFERENCES..............................................................................................................................18
INTRODUCTION
Business decision making is an important factor which helps in the day to day functions
of the management through which all decision are taking and it promotes the accuracy of most of
the determination of the management. With the help of this the information is gather in the form
of statistical format. Along with this there are two major sources which are helpful in collecting
the different arrangement through various origin. The purpose of this report is to provide
necessary information to Brit college in which primary and secondary source of information is
used. Along with this sampling is also taken into account for making the result effective and
beneficial for an cited case. Moreover some additional information are become more interesting
with the help of using bar graphs, charts and trends lines through which calculation and task
results become effective.(Babuand et. al., 2012).
TASK 1
1.1 Plan for collecting the primary and secondary data
There are different sources which are helpful in creating a plan which helps the Brit
college in making the decisions effective. The two major sources are primary and secondary
source of information. The elaboration of these two points are as follow:
Primary source Secondary source
This source of information get collected by
direct interaction with people. It helps in
making the outcome effective.
The data which is collected with the help of
books, journals etc. is come under the category
of secondary source.
Preparation of questionnaire is an another
factor which helps in the collection of primary
data.
The articles are best source of data analysis
become easier because it is based on post
research.
In this present case study data is collected with
the help of preparing questionnaire.
Also various articles, journals and books are
taken into consideration which become
important facts in data collection.
⊘ This is a preview!⊘
Do you want full access?
Subscribe today to unlock all pages.
Trusted by 1+ million students worldwide
The basic purpose behind conducting this
research form is just to make the result
accurate and reliable.
The reason behind gathering data through
secondary source is just make data collection
effective.
The more the trustworthy information increase
the chances of achieving targets in minimum
time period.
Secondary data helps in achieving the targets
in appropriate time period. That's' why it is
important form in research consultation.
1.2 Survey methodology with sample framing
It is a type of data collection technique which helps in getting the information from a
population(Bunnikand et. al., 2010). It is helpful in making the result effective. Although it is get
collected from various sources which helps in getting the opinion of different group of people. It
can get with the help of preparing questionnaire which further become data that can be analysed
statically. The person who reply on the survey is the respondent.
In this assignment questionnaire method is used which helps in making outcome
beneficial. Many questions are going to asked from respondent and they answer such questions
in corrective manner. Such answer are further convert into data format which helps in better
understanding of research. There are basically two types of sampling:
1. Probability sampling: It can be said as the representative sampling through which the
whole information is attain from the population or the group of people. It is examine that
such data is valid and reliable because the whole content is based on some group which
are selected. Now, probability sampling also have two types:
a) Random: According to this sample methodology it signifies that information is get collected
through some group of people which are selected on random basis. It helps in reduce the bias
from survey methodology. Hence, it is one of the important fact which helps in making the
collection of information easy and acceptable(Cunliffeand et. al., 2010).
b) Stratified sampling: According to this technique it leads in selection of a group, social class
etc. This helps in making the outcome which is depend on some group of people.
2. Non probability sample: It is said that some samples are not based on representative
sampling are less desirable than probability sample. It is an expensive method along
with this it also take some more time than probability sampling.
Paraphrase This Document
Need a fresh take? Get an instant paraphrase of this document with our AI Paraphraser
In this case assignment random sampling is used which helps in gathering the data
through different people who ever do not know each other. It is an helpful act because it reduces
the bias from the report. Moreover it also provides reliability of information. Hence, it is based
on qualitative nature.
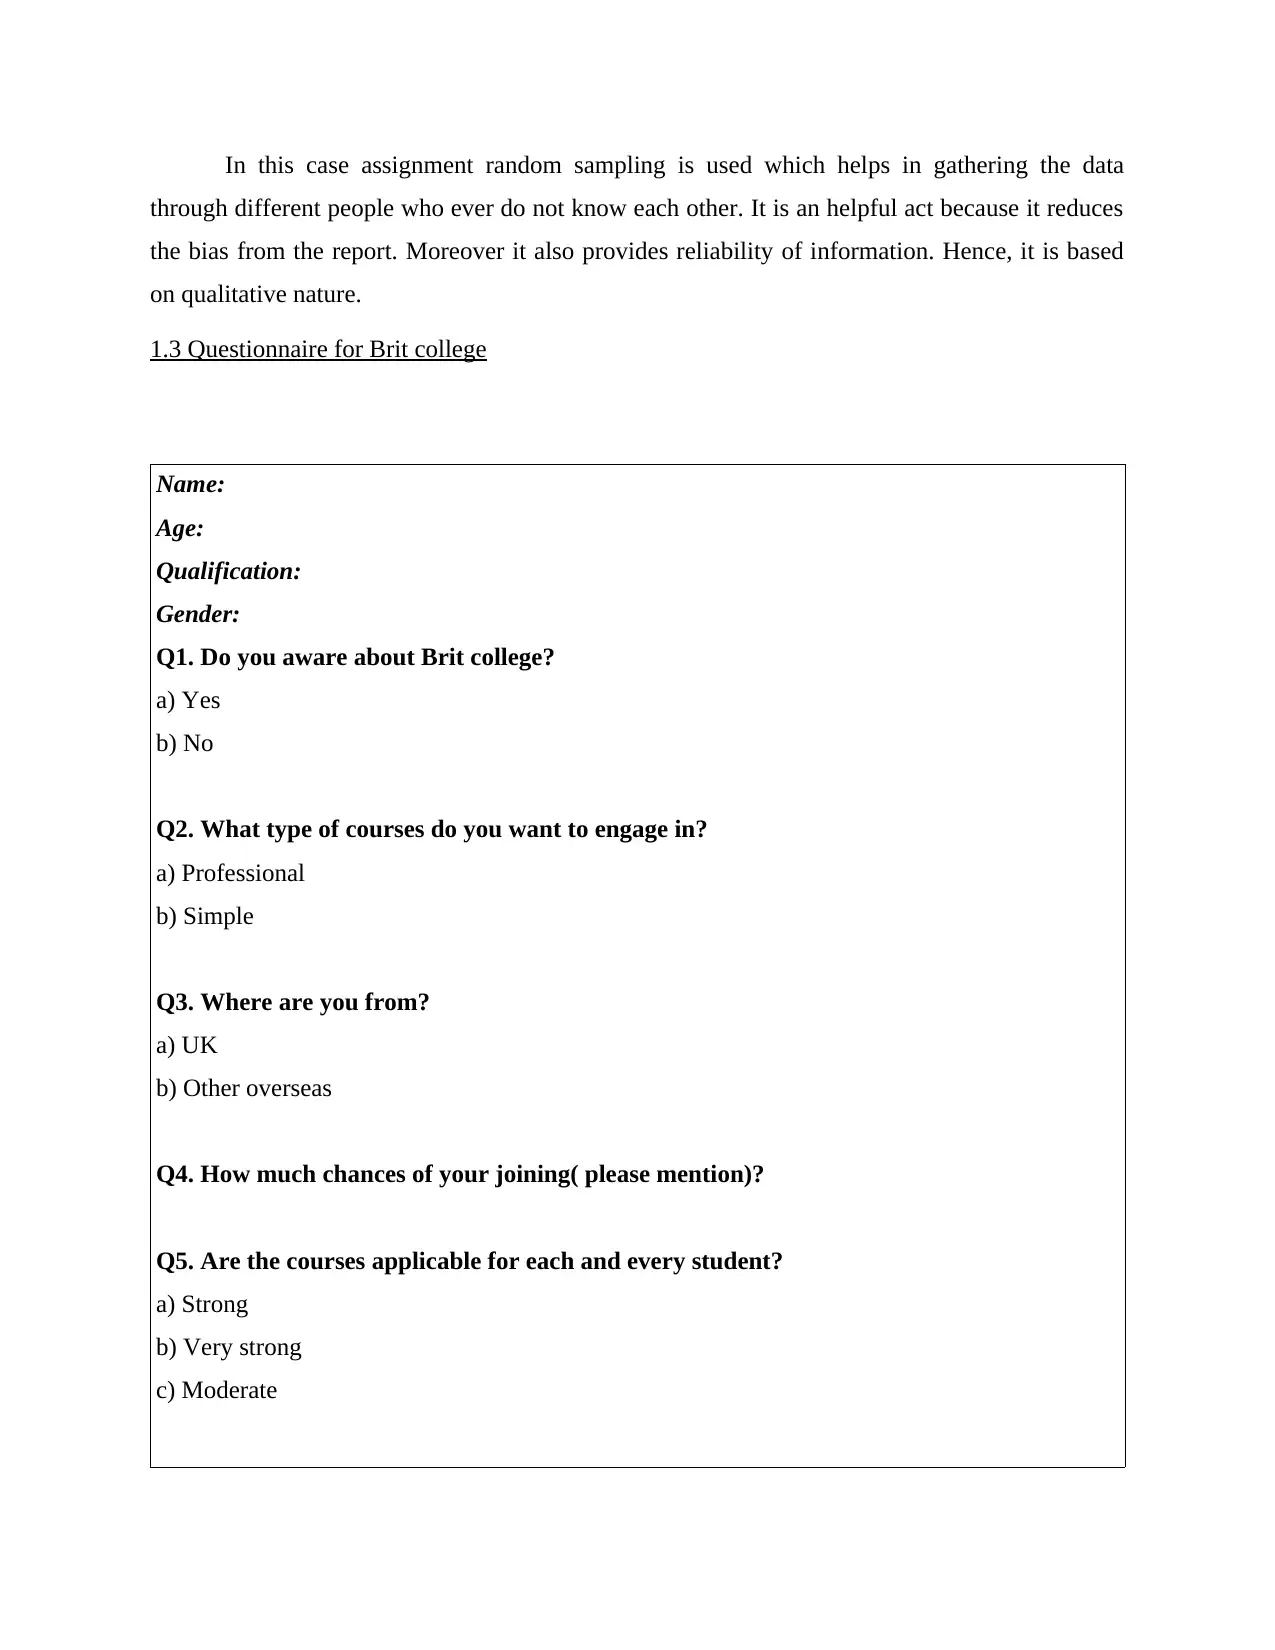
1.3 Questionnaire for Brit college
Name:
Age:
Qualification:
Gender:
Q1. Do you aware about Brit college?
a) Yes
b) No
Q2. What type of courses do you want to engage in?
a) Professional
b) Simple
Q3. Where are you from?
a) UK
b) Other overseas
Q4. How much chances of your joining( please mention)?
Q5. Are the courses applicable for each and every student?
a) Strong
b) Very strong
c) Moderate
through different people who ever do not know each other. It is an helpful act because it reduces
the bias from the report. Moreover it also provides reliability of information. Hence, it is based
on qualitative nature.
1.3 Questionnaire for Brit college
Name:
Age:
Qualification:
Gender:
Q1. Do you aware about Brit college?
a) Yes
b) No
Q2. What type of courses do you want to engage in?
a) Professional
b) Simple
Q3. Where are you from?
a) UK
b) Other overseas
Q4. How much chances of your joining( please mention)?
Q5. Are the courses applicable for each and every student?
a) Strong
b) Very strong
c) Moderate
Any recommendation? If any
TASK 2
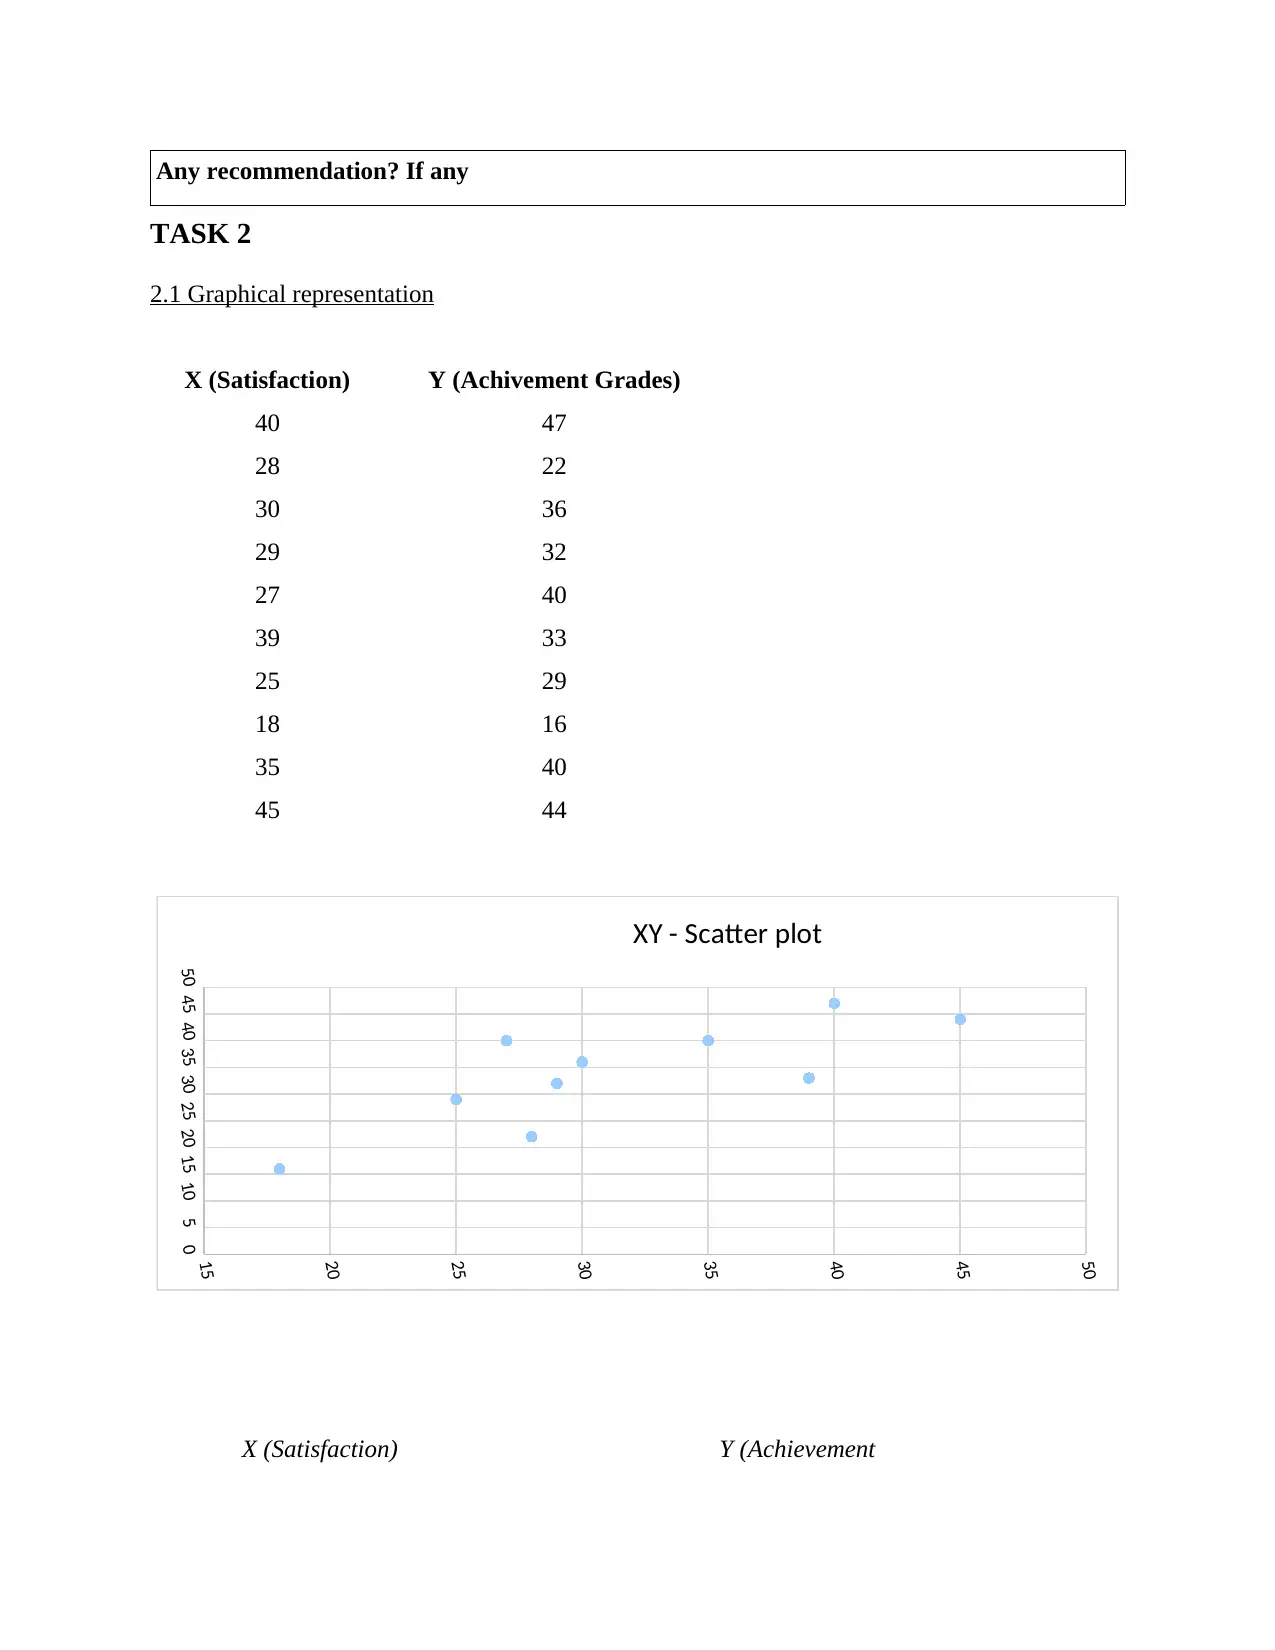
2.1 Graphical representation
X (Satisfaction) Y (Achivement Grades)
40 47
28 22
30 36
29 32
27 40
39 33
25 29
18 16
35 40
45 44
X (Satisfaction) Y (Achievement
15
20
25
30
35
40
45
50
05101520253035404550
XY - Scatter plot
TASK 2
2.1 Graphical representation
X (Satisfaction) Y (Achivement Grades)
40 47
28 22
30 36
29 32
27 40
39 33
25 29
18 16
35 40
45 44
X (Satisfaction) Y (Achievement
15
20
25
30
35
40
45
50
05101520253035404550
XY - Scatter plot
⊘ This is a preview!⊘
Do you want full access?
Subscribe today to unlock all pages.
Trusted by 1+ million students worldwide
Grades)
Mean 31.6 Mean 33.9
Standard Error 2.5569078548 Standard Error
3.060319518
5
Median 29.5 Median 34.5
Mode #N/A Mode 40
Standard Deviation 8.0856525882 Standard Deviation
9.677580046
5
Sample Variance 65.3777777778 Sample Variance
93.65555555
56
Kurtosis -0.4009172809 Kurtosis -0.210005549
Skewness 0.1247268059 Skewness
-
0.582936696
1
Range 27 Range 31
Minimum 18 Minimum 16
Maximum 45 Maximum 47
Sum 316 Sum 339
Count 10 Count 10
Confidence Level(95.0%) 5.7841274183
Confidence
Level(95.0%)
6.922923719
3
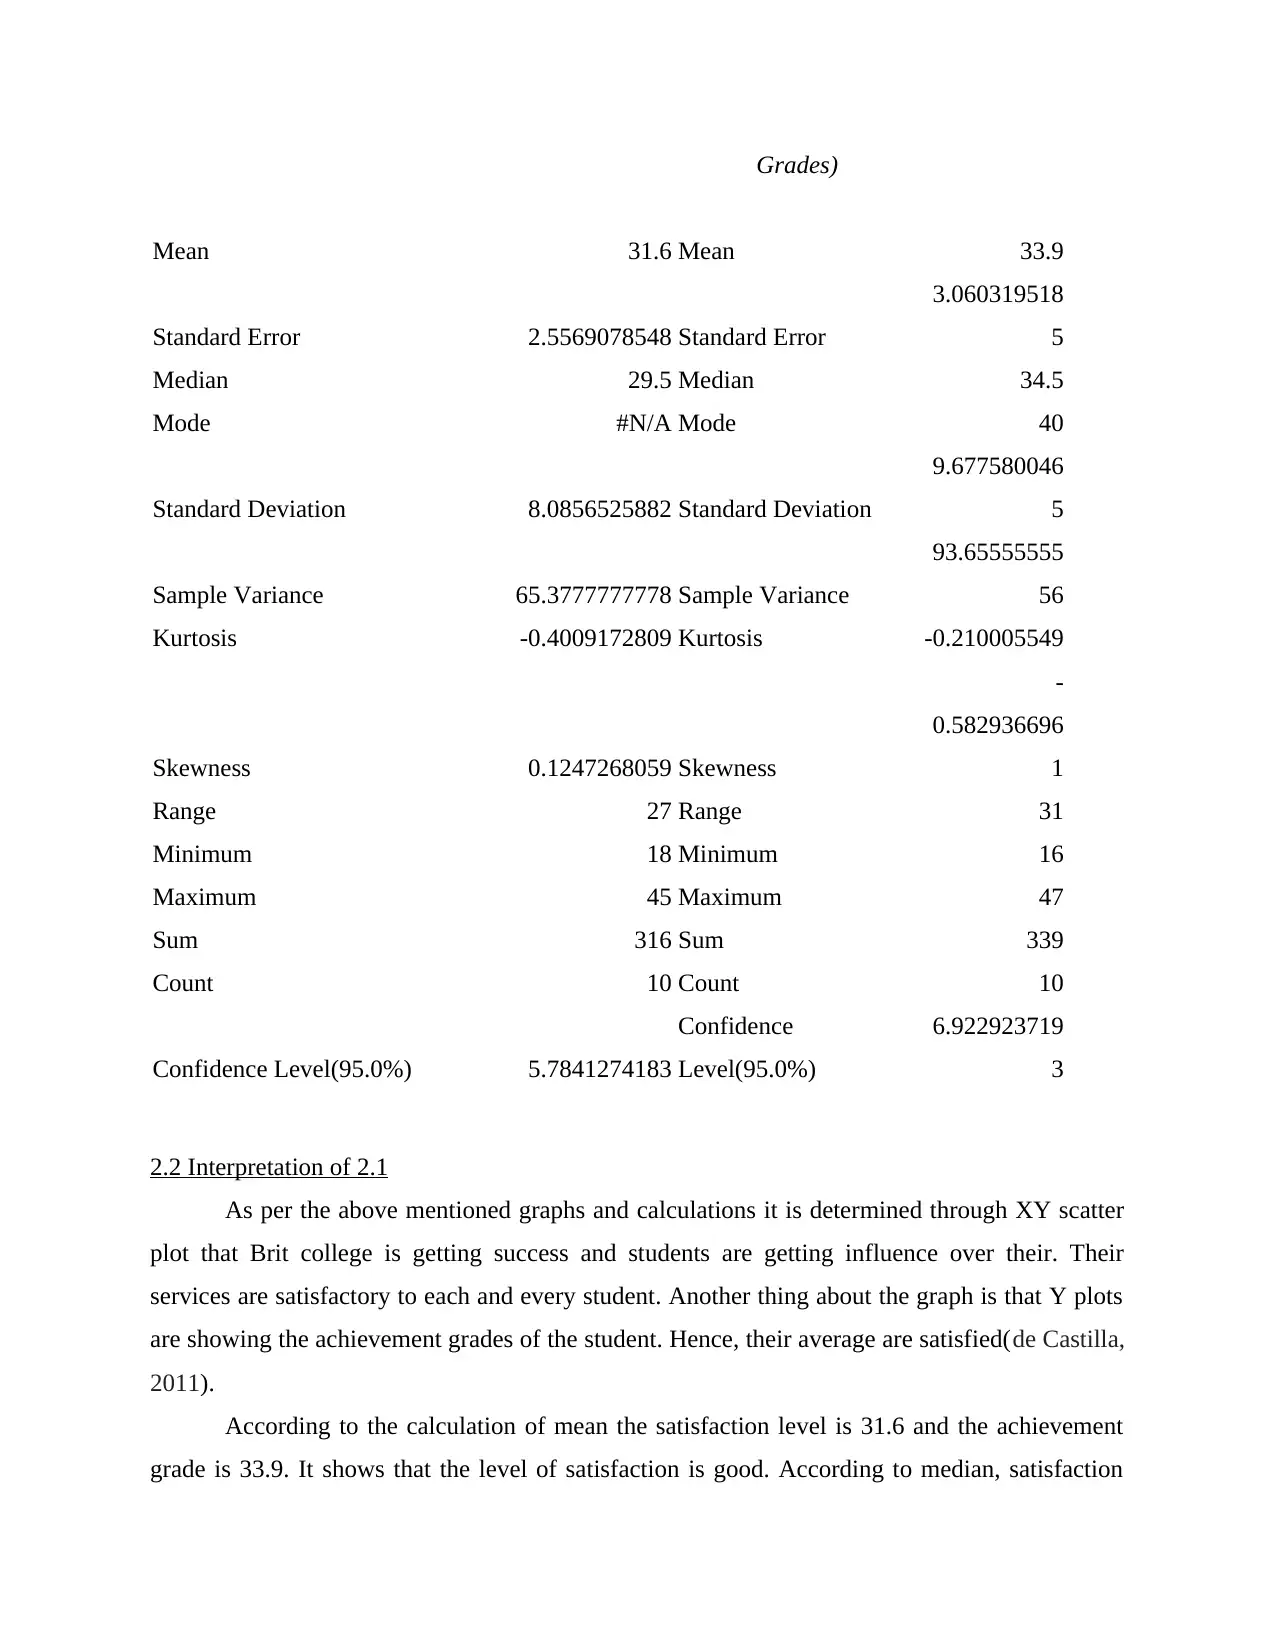
2.2 Interpretation of 2.1
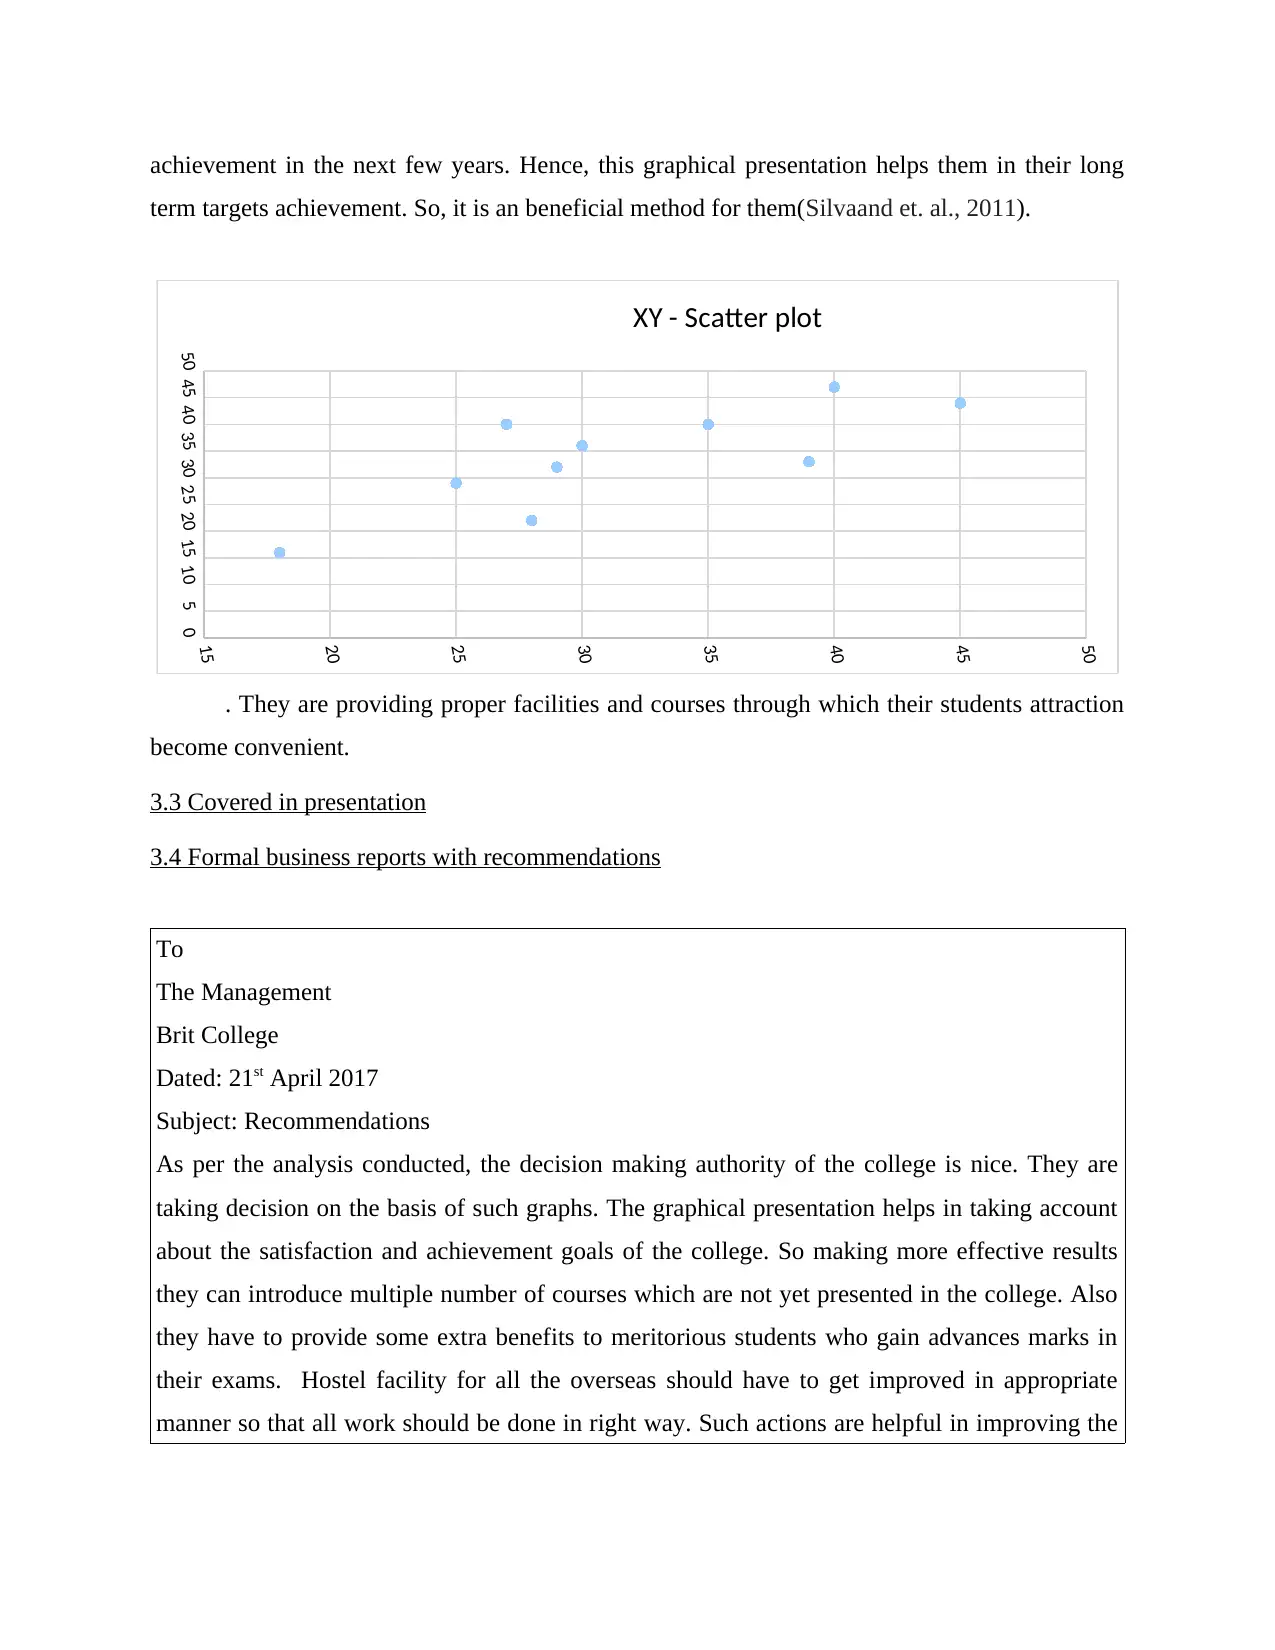
As per the above mentioned graphs and calculations it is determined through XY scatter
plot that Brit college is getting success and students are getting influence over their. Their
services are satisfactory to each and every student. Another thing about the graph is that Y plots
are showing the achievement grades of the student. Hence, their average are satisfied(de Castilla,
2011).
According to the calculation of mean the satisfaction level is 31.6 and the achievement
grade is 33.9. It shows that the level of satisfaction is good. According to median, satisfaction
Mean 31.6 Mean 33.9
Standard Error 2.5569078548 Standard Error
3.060319518
5
Median 29.5 Median 34.5
Mode #N/A Mode 40
Standard Deviation 8.0856525882 Standard Deviation
9.677580046
5
Sample Variance 65.3777777778 Sample Variance
93.65555555
56
Kurtosis -0.4009172809 Kurtosis -0.210005549
Skewness 0.1247268059 Skewness
-
0.582936696
1
Range 27 Range 31
Minimum 18 Minimum 16
Maximum 45 Maximum 47
Sum 316 Sum 339
Count 10 Count 10
Confidence Level(95.0%) 5.7841274183
Confidence
Level(95.0%)
6.922923719
3
2.2 Interpretation of 2.1
As per the above mentioned graphs and calculations it is determined through XY scatter
plot that Brit college is getting success and students are getting influence over their. Their
services are satisfactory to each and every student. Another thing about the graph is that Y plots
are showing the achievement grades of the student. Hence, their average are satisfied(de Castilla,
2011).
According to the calculation of mean the satisfaction level is 31.6 and the achievement
grade is 33.9. It shows that the level of satisfaction is good. According to median, satisfaction
Paraphrase This Document
Need a fresh take? Get an instant paraphrase of this document with our AI Paraphraser
and achievements are again moderate. According to mode the repetitive value is nil but the
achievement in grades many students get the equal marks with each other which is 40.
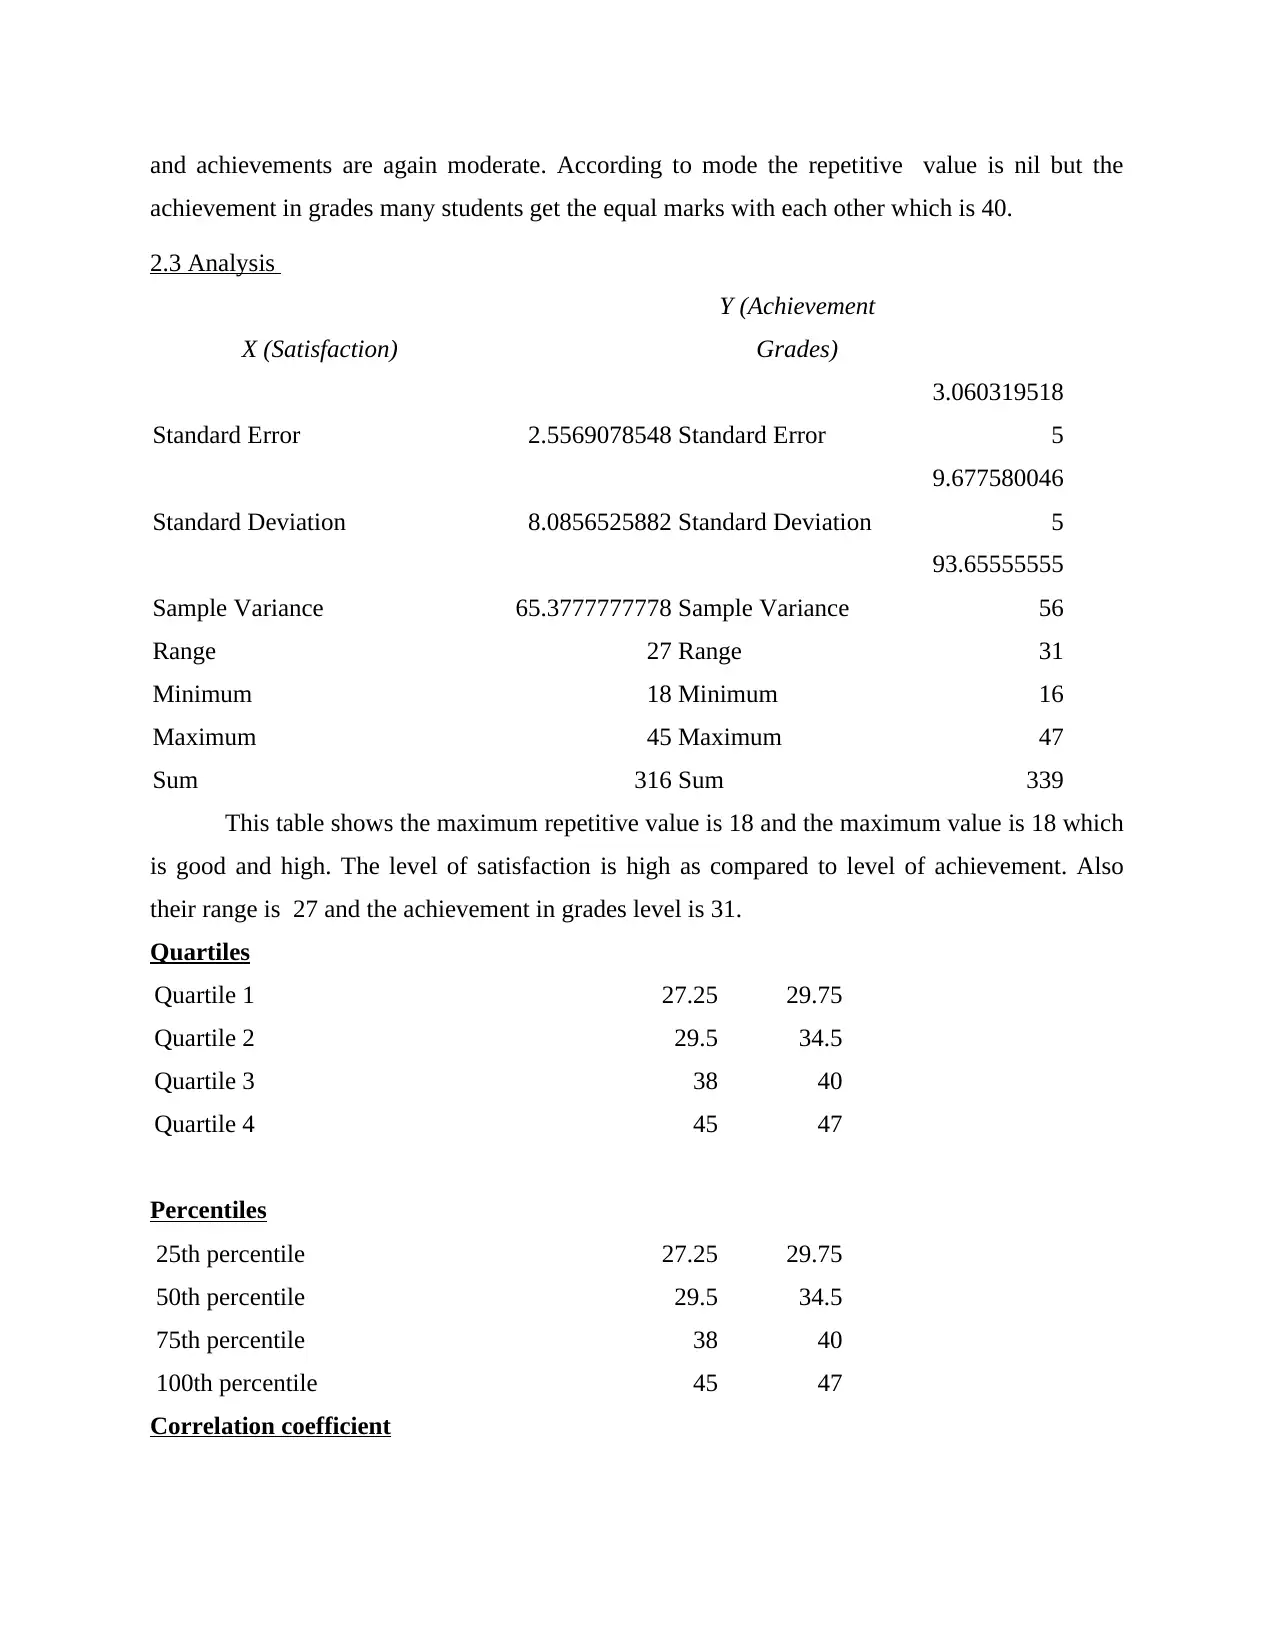
2.3 Analysis
X (Satisfaction)
Y (Achievement
Grades)
Standard Error 2.5569078548 Standard Error
3.060319518
5
Standard Deviation 8.0856525882 Standard Deviation
9.677580046
5
Sample Variance 65.3777777778 Sample Variance
93.65555555
56
Range 27 Range 31
Minimum 18 Minimum 16
Maximum 45 Maximum 47
Sum 316 Sum 339
This table shows the maximum repetitive value is 18 and the maximum value is 18 which
is good and high. The level of satisfaction is high as compared to level of achievement. Also
their range is 27 and the achievement in grades level is 31.
Quartiles
Quartile 1 27.25 29.75
Quartile 2 29.5 34.5
Quartile 3 38 40
Quartile 4 45 47
Percentiles
25th percentile 27.25 29.75
50th percentile 29.5 34.5
75th percentile 38 40
100th percentile 45 47
Correlation coefficient
achievement in grades many students get the equal marks with each other which is 40.
2.3 Analysis
X (Satisfaction)
Y (Achievement
Grades)
Standard Error 2.5569078548 Standard Error
3.060319518
5
Standard Deviation 8.0856525882 Standard Deviation
9.677580046
5
Sample Variance 65.3777777778 Sample Variance
93.65555555
56
Range 27 Range 31
Minimum 18 Minimum 16
Maximum 45 Maximum 47
Sum 316 Sum 339
This table shows the maximum repetitive value is 18 and the maximum value is 18 which
is good and high. The level of satisfaction is high as compared to level of achievement. Also
their range is 27 and the achievement in grades level is 31.
Quartiles
Quartile 1 27.25 29.75
Quartile 2 29.5 34.5
Quartile 3 38 40
Quartile 4 45 47
Percentiles
25th percentile 27.25 29.75
50th percentile 29.5 34.5
75th percentile 38 40
100th percentile 45 47
Correlation coefficient
X (Satisfaction) Y (Achievement Grades)
X (Satisfaction) 1
Y (Achievement Grades) 0.7832490892 1
The coefficient correlation between the two sides are moderate which shows that their
relation is perfect with each other. Along with this they have low rate of errors through which
their work become smooth and their result also(Hodges and Wu, 2010). Their goal achievement
is high and it is helpful for them in attain their targets in a effective manner.
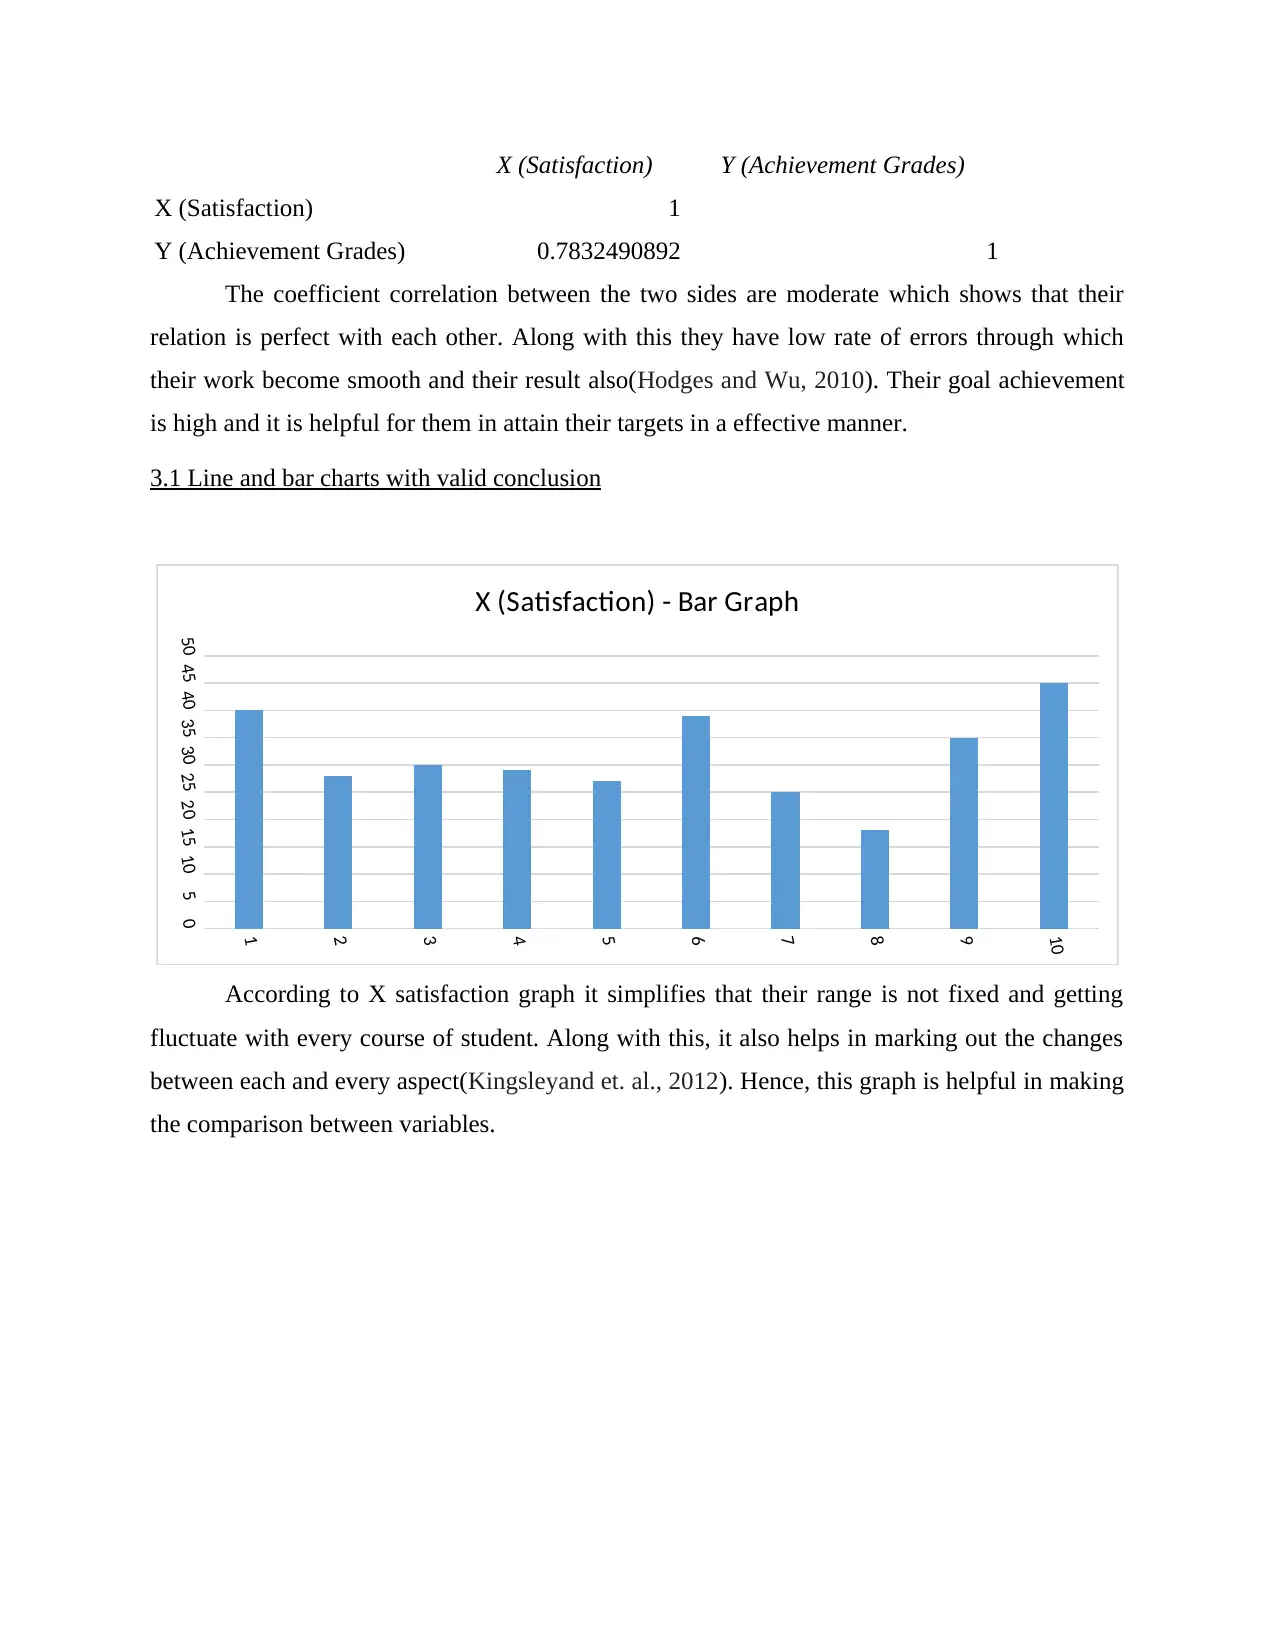
3.1 Line and bar charts with valid conclusion
According to X satisfaction graph it simplifies that their range is not fixed and getting
fluctuate with every course of student. Along with this, it also helps in marking out the changes
between each and every aspect(Kingsleyand et. al., 2012). Hence, this graph is helpful in making
the comparison between variables.
1
2
3
4
5
6
7
8
9
10
05101520253035404550
X (Satisfaction) - Bar Graph
X (Satisfaction) 1
Y (Achievement Grades) 0.7832490892 1
The coefficient correlation between the two sides are moderate which shows that their
relation is perfect with each other. Along with this they have low rate of errors through which
their work become smooth and their result also(Hodges and Wu, 2010). Their goal achievement
is high and it is helpful for them in attain their targets in a effective manner.
3.1 Line and bar charts with valid conclusion
According to X satisfaction graph it simplifies that their range is not fixed and getting
fluctuate with every course of student. Along with this, it also helps in marking out the changes
between each and every aspect(Kingsleyand et. al., 2012). Hence, this graph is helpful in making
the comparison between variables.
1
2
3
4
5
6
7
8
9
10
05101520253035404550
X (Satisfaction) - Bar Graph
⊘ This is a preview!⊘
Do you want full access?
Subscribe today to unlock all pages.
Trusted by 1+ million students worldwide
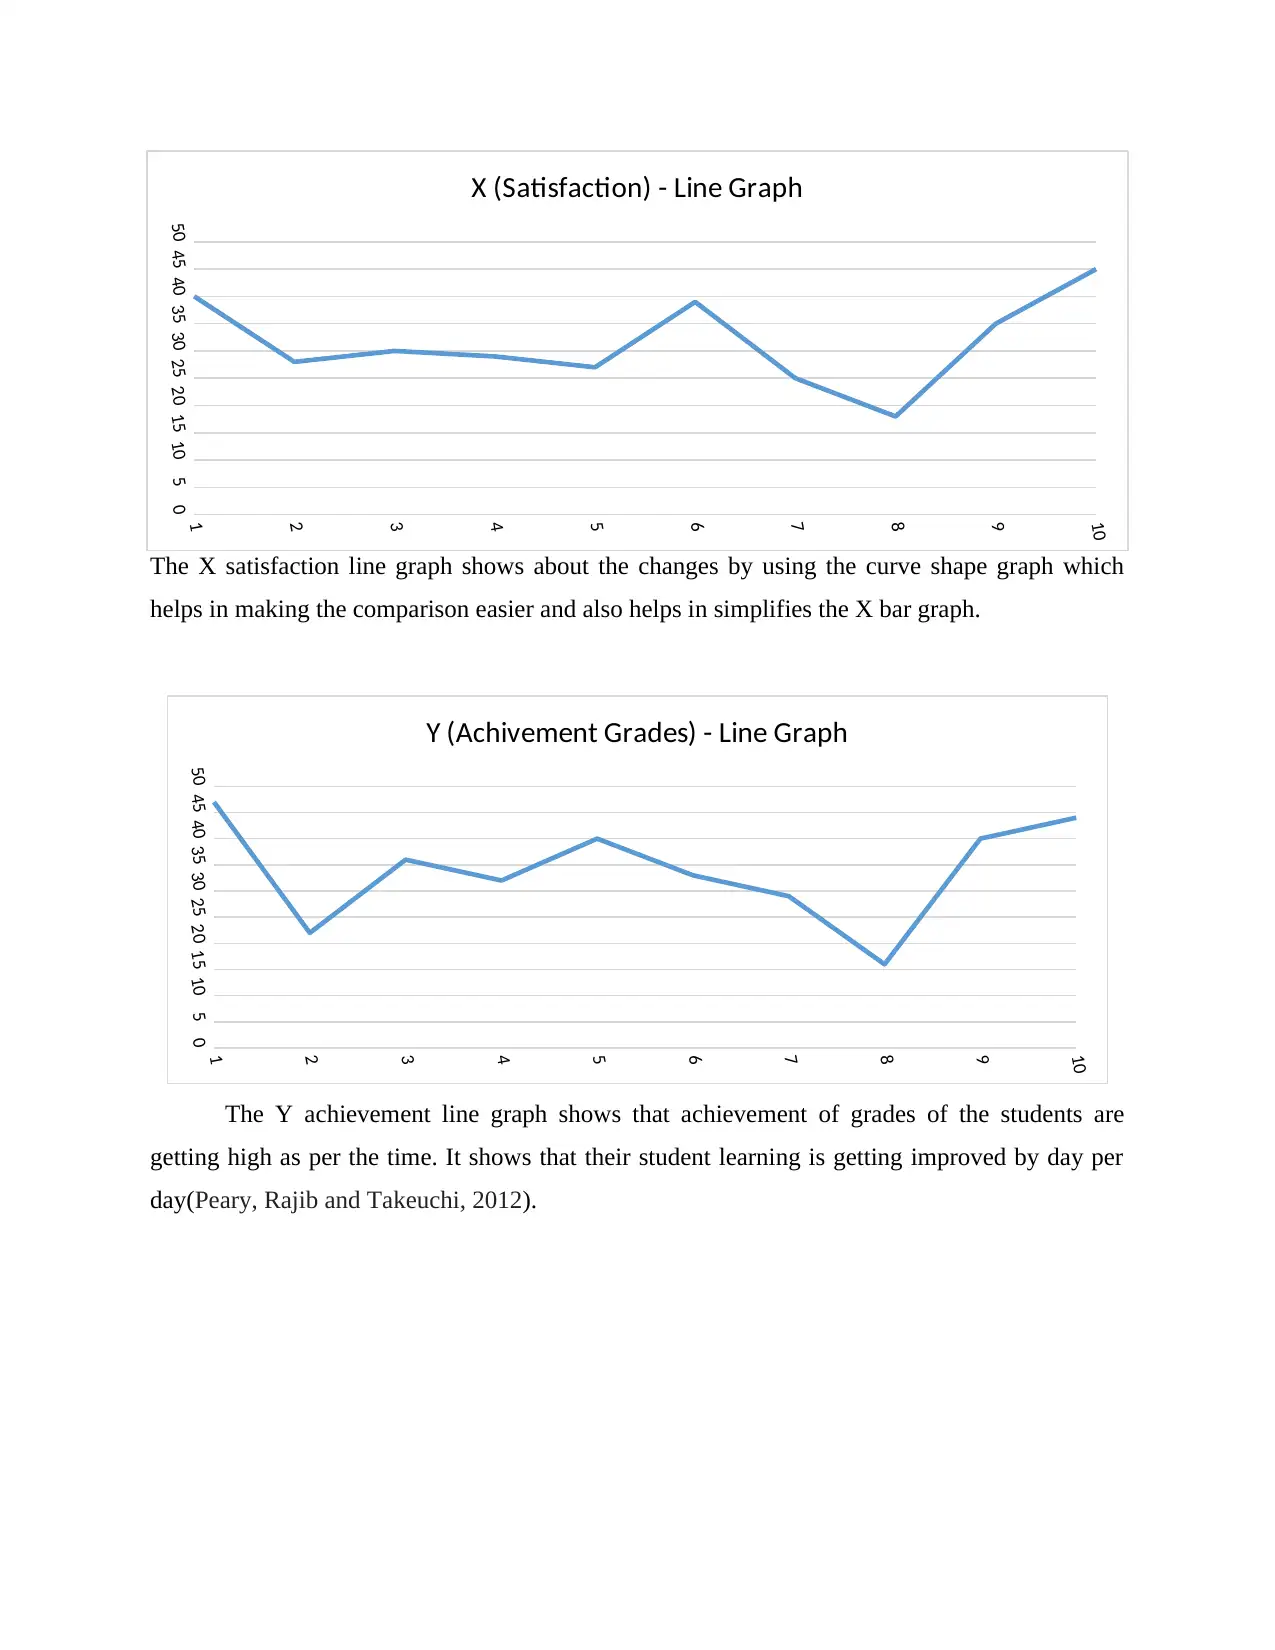
The X satisfaction line graph shows about the changes by using the curve shape graph which
helps in making the comparison easier and also helps in simplifies the X bar graph.
The Y achievement line graph shows that achievement of grades of the students are
getting high as per the time. It shows that their student learning is getting improved by day per
day(Peary, Rajib and Takeuchi, 2012).
1
2
3
4
5
6
7
8
9
10
05101520253035404550
Y (Achivement Grades)- Bar Graph
1
2
3
4
5
6
7
8
9
10
05101520253035404550
X (Satisfaction) - Line Graph
1
2
3
4
5
6
7
8
9
10
05101520253035404550
Y (Achivement Grades) - Line Graph
Paraphrase This Document
Need a fresh take? Get an instant paraphrase of this document with our AI Paraphraser
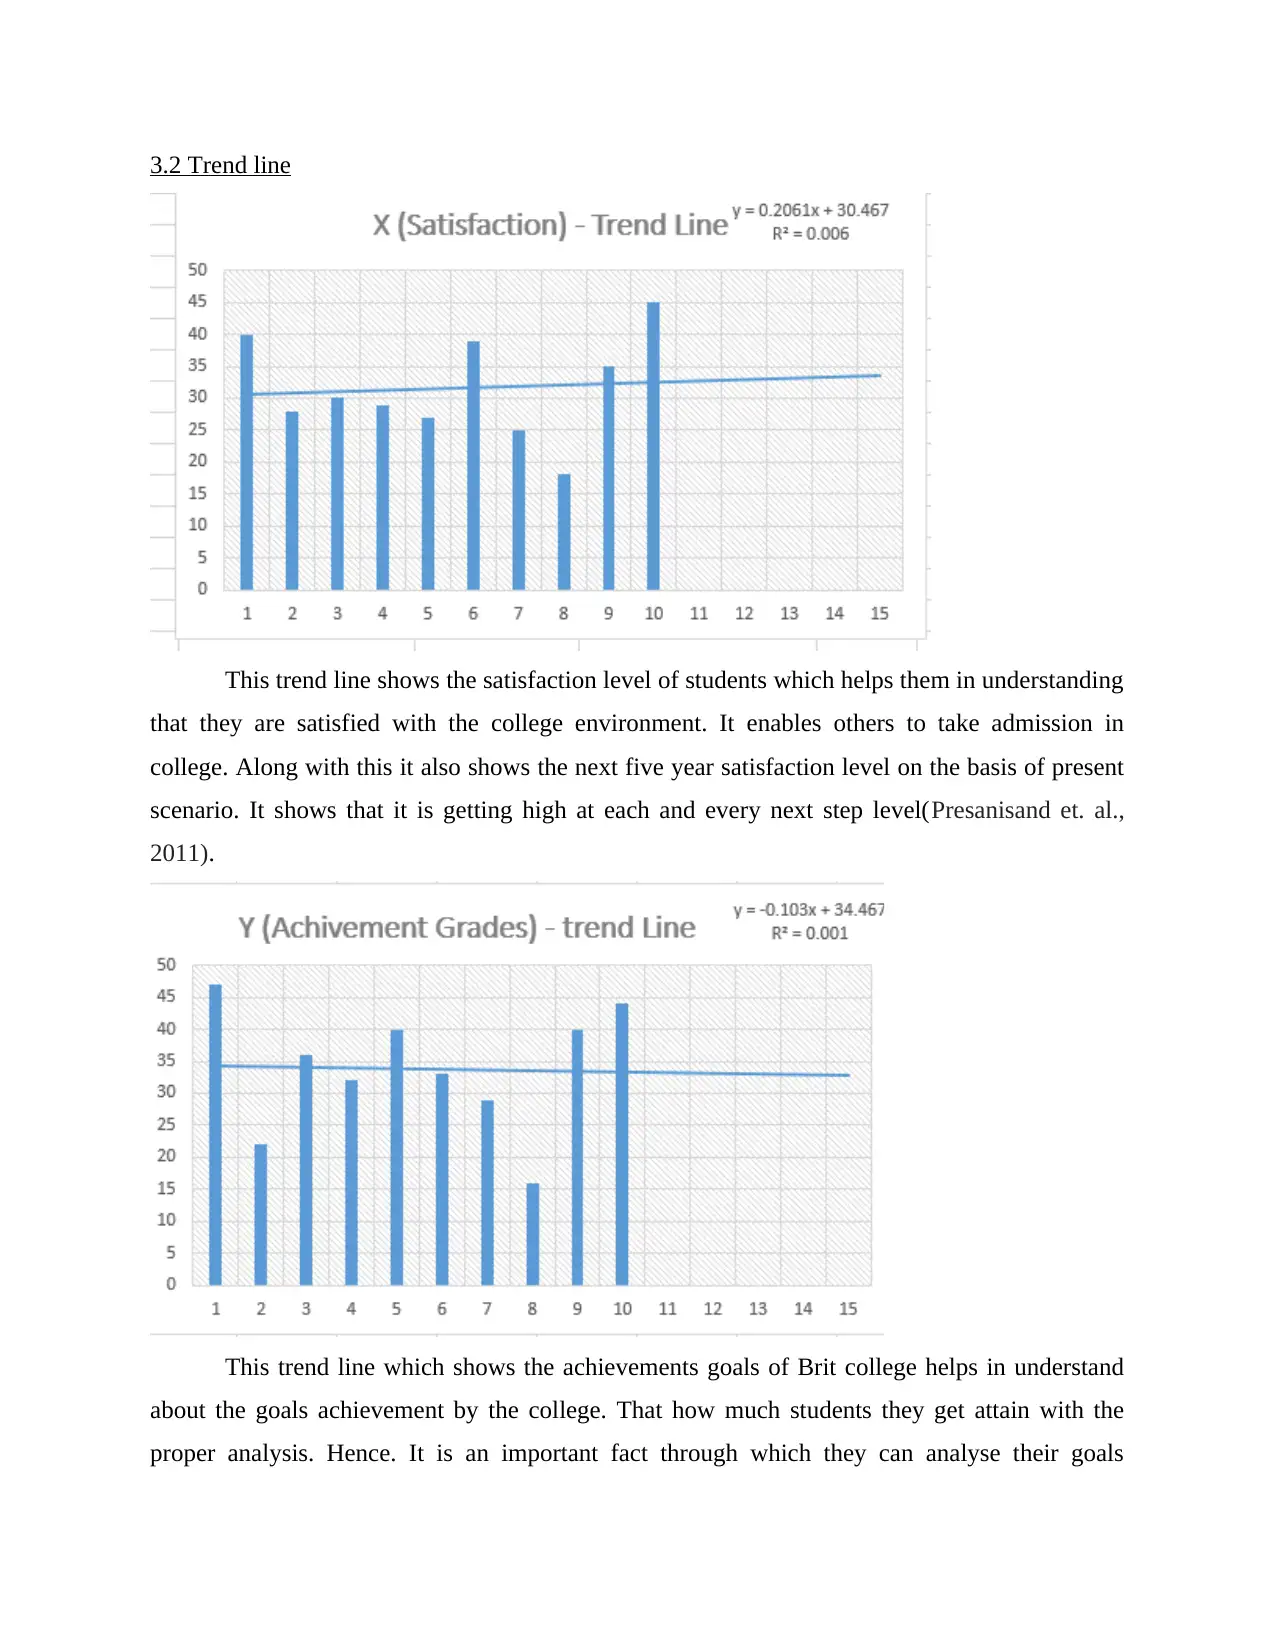
3.2 Trend line
This trend line shows the satisfaction level of students which helps them in understanding
that they are satisfied with the college environment. It enables others to take admission in
college. Along with this it also shows the next five year satisfaction level on the basis of present
scenario. It shows that it is getting high at each and every next step level(Presanisand et. al.,
2011).
This trend line which shows the achievements goals of Brit college helps in understand
about the goals achievement by the college. That how much students they get attain with the
proper analysis. Hence. It is an important fact through which they can analyse their goals
achievement in the next few years. Hence, this graphical presentation helps them in their long
term targets achievement. So, it is an beneficial method for them(Silvaand et. al., 2011).
. They are providing proper facilities and courses through which their students attraction
become convenient.
3.3 Covered in presentation
3.4 Formal business reports with recommendations
To
The Management
Brit College
Dated: 21st April 2017
Subject: Recommendations
As per the analysis conducted, the decision making authority of the college is nice. They are
taking decision on the basis of such graphs. The graphical presentation helps in taking account
about the satisfaction and achievement goals of the college. So making more effective results
they can introduce multiple number of courses which are not yet presented in the college. Also
they have to provide some extra benefits to meritorious students who gain advances marks in
their exams. Hostel facility for all the overseas should have to get improved in appropriate
manner so that all work should be done in right way. Such actions are helpful in improving the
15
20
25
30
35
40
45
50
05101520253035404550
XY - Scatter plot
⊘ This is a preview!⊘
Do you want full access?
Subscribe today to unlock all pages.
Trusted by 1+ million students worldwide
1 out of 18
Related Documents


Your All-in-One AI-Powered Toolkit for Academic Success.
+13062052269
info@desklib.com
Available 24*7 on WhatsApp / Email
![[object Object]](/_next/static/media/star-bottom.7253800d.svg)
Unlock your academic potential
Copyright © 2020–2026 A2Z Services. All Rights Reserved. Developed and managed by ZUCOL.