Business Decision Making Report: Unit 6 - Customer Survey and Analysis

Verified

Added on  2020/10/22

|29
|4940
|56
Report
AI Summary
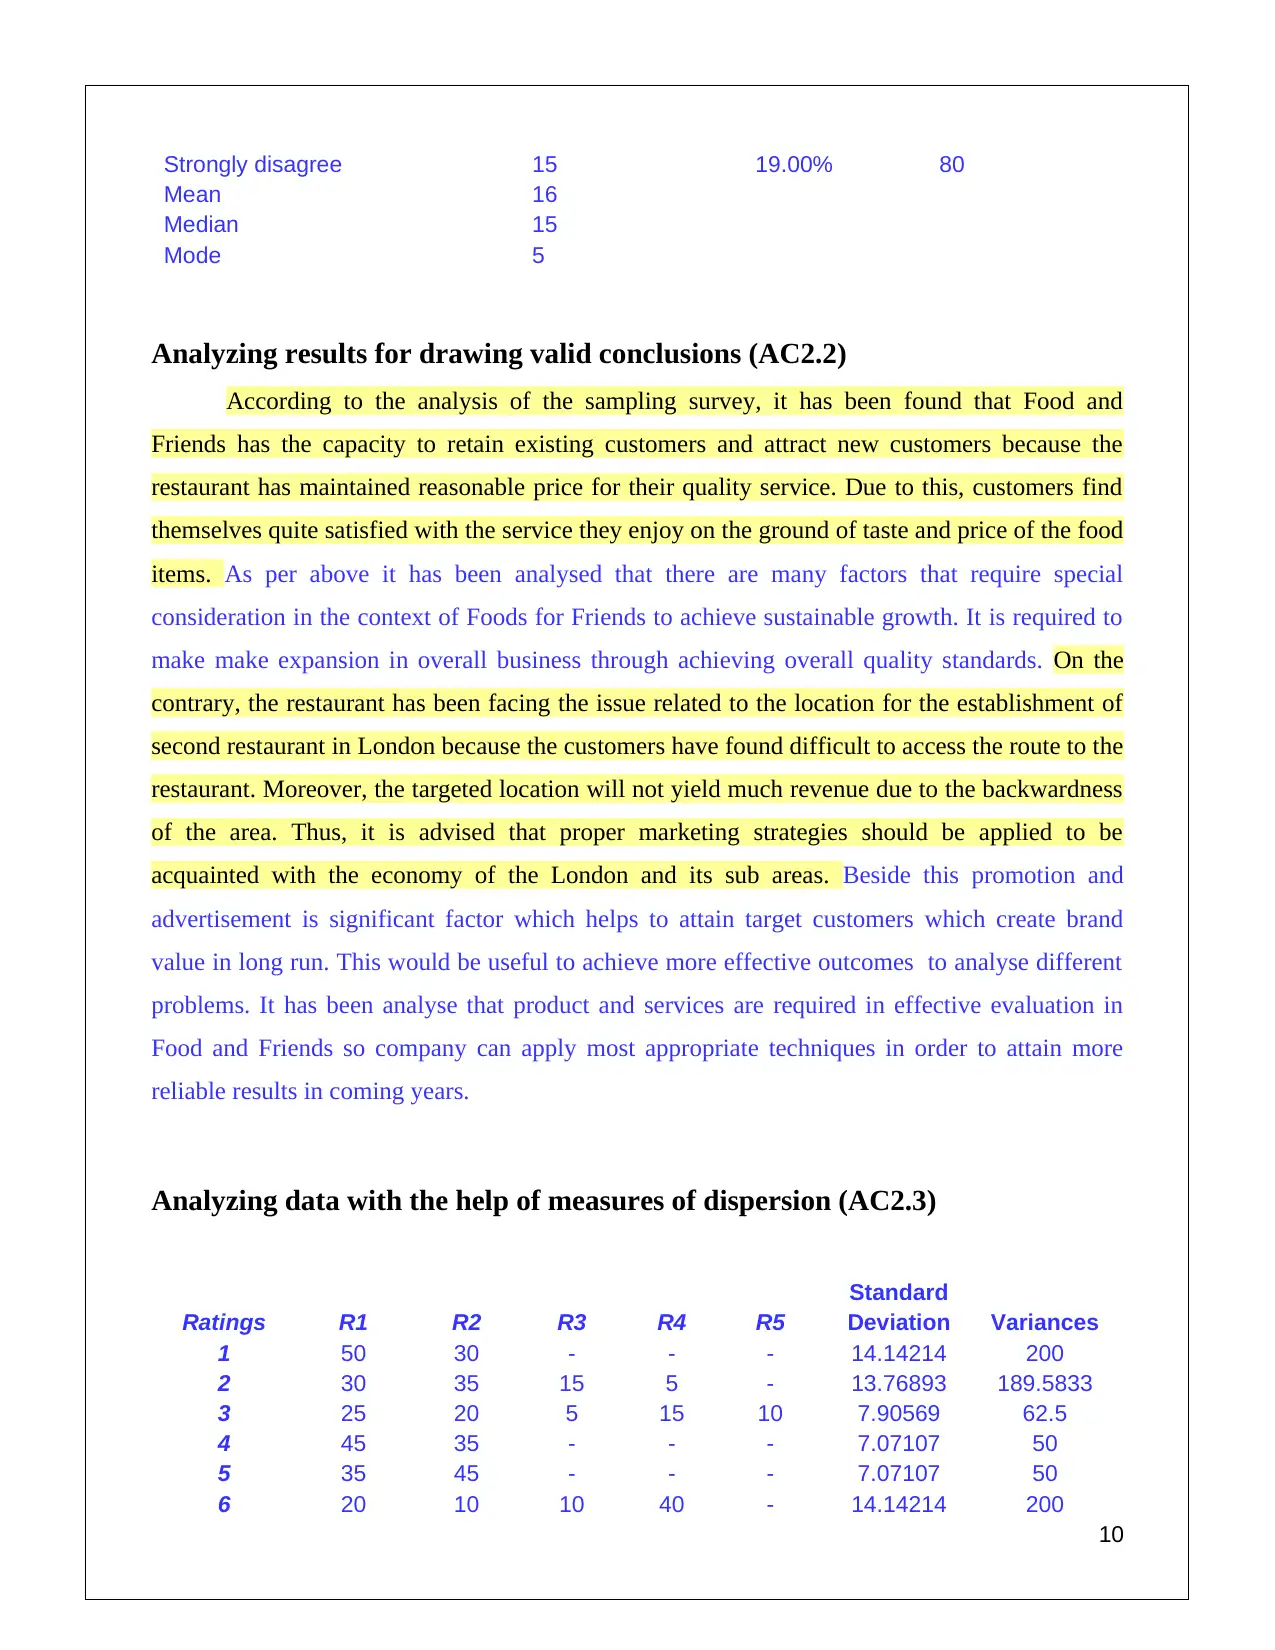
This report focuses on business decision-making, specifically using data analysis from a customer survey conducted for a hypothetical restaurant chain, "Food and Friends." The report begins by outlining the process of collecting primary and secondary data, emphasizing the use of surveys and questionnaires to gather customer preferences. It then presents the survey methodology, including the sampling frame and the design of the questionnaire, which aims to understand customer satisfaction, preferences for new menu items, and suggestions for improvements. The core of the report summarizes the survey data using representative values, analyzing customer feedback on price, food quality, location, and potential changes. The analysis includes the use of measures of dispersion. The findings reveal insights into customer perceptions, highlighting areas where the restaurant excels and areas needing improvement, such as infrastructure and menu options. The report concludes by drawing valid conclusions based on the analysis, offering recommendations for strategic improvements to enhance customer satisfaction and business growth. The report recommends that proper marketing strategies should be applied to be acquainted with the economy of the London and its sub areas. Beside this promotion and advertisement is significant factor which helps to attain target customers which create brand value in long run.
Document Page
UNIT 6 BUSINESS DECISION MAKING
1
tabler-icon-diamond-filled.svg

Paraphrase This Document

Need a fresh take? Get an instant paraphrase of this document with our AI Paraphraser
Document Page
2
Document Page
3
Document Page
Introduction
The main aim of this study is to understand business decision making properly. The
success of any organization depends on the proper planning and decision-making. Many factors
are involved in this process to render it more effective, accurate and efficient. In this study, these
factors are discussed to point out the possible results of business decision making. Information
was collected from the variety of resources, ranges of techniques are used to analyse data
effectively, and this information was reported in an appropriate format.
Task 1
Creating a plan for collecting primary and secondary data (AC1.1)
To draw a plan whether may be related to the business or personal, collecting data are the
first thing to be done. Further, this information could be collected from two sources, namely,
primary source and secondary source. Whereas primary source includes live feeds, which means
collecting data from those people who have experience and knowledge. In this kind of sources,
personal interviews are conducted to gain knowledge, experience, and feedback, questionnaire,
and surveys are conducted to gather a snapshot of the required information in a short run. On the
other hand, secondary data includes journals, books, news, online websites, etc. Which means
that information which is already collected could be used as a reference or secondary
information like research projects, scholarly articles, etc. However, for conducting data
collection to support this given article, the primary source of data collection has been used. Since
primary data and the raw information is required to make decision-making process for gaining
the customer preferences before establishing second restaurant in London. In addition, it is also
analyzed how Food and Friends use these methodologies or conduct such operations (Quinto et
al. 2013, p.767).
Presenting the survey methodology and used sampling frame (AC1.2)
Per Bruijne and Wijnant, (2014, p.955) primary source of collecting data requires
personal interviews with those who have an experience on a certain field. In order to gain public
response in a large-scale questionnaire have been developed to acquire feedback, because it
would not be possible to have one on one interview with every personnel due to the shortage of
time. Hence survey methodology has been developed to base upon the sampling frame to support
4
tabler-icon-diamond-filled.svg

Paraphrase This Document

Need a fresh take? Get an instant paraphrase of this document with our AI Paraphraser
Document Page
the decision making process. With the help of this method statistical diagnosis could be done,
because survey based on questionnaire consists of concise and goal oriented question, which
could be answered either in yes or no or in any other flexible form. However, the sampling
method is based on the probability and non-probability sampling. Where in the probability
sampling random selection is done and in no probability sampling selected sample is taken to
conduct further research. In this research, Food and Friends have conducted open-ended
sampling survey, where questionnaire has been distributed to the customers to attain their
response. Moreover, non-probability sampling method has been chosen as a sampling technique
due to the difficulty in dealing with many people. Thus, only 80 customers were selected with an
intention of getting their feedback in details.
Designing questionnaire (AC1.3)
Questionnaire sample has been designed to developed understanding the customer response.
a) Do you frequently visit Food for Friends?
1. Yes
2. No
b) What do you think about the price of the foods?
1. Very costly
2. Reasonable
3. Pocket-friendly
c) How much satisfied are you with quality of the food?
1. Strongly satisfied
2. Satisfied
3. Neutral
4. Dissatisfied
5. Strongly dissatisfied
e) Do you think the price of the food justifies the quality of the food?
1. Yes
2. No
f) Are you happy with the current location of Food for Friends?
1. Yes
2. No
5
Document Page
g) What are the new food items that you would like to introduce in the restaurant?
1. Mushroom and ale pie
2. Sausage rolls and salads
3. Fried mushroom moose
4. Tofu Steak
h) What are the changes that you would make in the restaurant?
1. Improve the lightning
2. Encourage the playing of music
3. Introduce the facility of drinks
4. Make innovations in the sitting arrangements
i) On a scale of 1 to 5, how much will you rate Food for Friends after comparing it with
other vegetarian restaurants?
1. Five
2. Four
3. Three
4. Two
5. One
j) Would you recommend the restaurant to any of your other friends?
1. Yes
2. No
k) How far do you agree that Food for Friends serves its customers with customised food?
1. Strongly agree
2. Agree
3. Neutral
4. Disagree
5. Strongly disagree
6
Document Page
TASK 2
Summarizing data for decision making with the help of representative values
(AC2.1)
With respect to the representative values and survey, questionnaire feedbacks of the
customers have been evaluated. The establishment of a restaurant and its running process is quite
complex, various research must be undertaken, including interviews, samplings, website
research, etc. However, in this study the researcher has taken the help of sampling technique to
understand customer preferences before opening second restaurant in London for Food and
Friends. Per the primary research 62% respondent has been visiting Food and Friends frequently,
around 44% of the customers found reasonable price of food items and very close percentage of
customers were standing against the price composition (Leys et al. 2013, p.764). This indicates
that people visiting Food and Friends do not have many issues related to the pricing system. On
the other hand, average number of people is satisfied with the quality of the food and with
respect to the quality of the food items, only 44% of the customers had voted justified price for
the standard of the food item, whereby only 56% of them have voted against of it.
From this scenario, it could be said that the restaurant has few issues related to the
quality and its price from the point of view of the users. If the discussion is done on the
preference of special food items, most the customers (50%) liked Tofu Steak, followed by the
percentage of people (24%) liked the only Mushroom and ale pie and rest liked Sausage rolls
and salads and Fried mushroom moose. Moreover, good number of customers is not satisfied
with the infrastructure and other indirect services of the restaurant, like lighting system, seating
capacity, etc. Based upon the review of sampling survey, a mixed opinion of the customers has
been attained. At one hand, customers are appreciating the services of Food and Friends on the
ground of quality and standards maintained for food items and the reasonable price system. On
the other hand, customers have faced issues related to the infrastructure of the restaurant. Thus, it
could be concluded that Food and Friends should focus on the required changes in the structure
of the restaurant and should include more food items in the menu list (Leys et al. 2013, p.765).
Q1. Do you frequently visit Food of Friends?
Options No. of responses Response (%)
Total
respondents
Yes 50 62.00% 80
7
tabler-icon-diamond-filled.svg

Paraphrase This Document

Need a fresh take? Get an instant paraphrase of this document with our AI Paraphraser
Document Page
No 30 38.00% 80
Mean 40
Median 40
Mode 0
Q2. What do you think about the price of the foods?
Options No. of responses Response (%)
Total
respondents
Very costly 30 38.00% 80
Reasonable 35 44.00% 80
Pocket-friendly 15 19.00% 80
Mean 26.6667
Median 30
Mode 0
Q3. How much satisfied are you with quality of the food?
Options No. of responses Response (%)
Total
respondents
Strongly satisfied 25 31.00% 80
Satisfied 20 25.00% 80
Neutral 5 6.00% 80
Dissatisfied 15 19.00% 80
Strongly dissatisfied 10 19.00% 80
Mean 15
Median 15
Mode 5
Q4. Do you think the price of the food justifies the quality of the food?
Options No. of responses Response (%)
Total
respondents
Yes 45 56.00% 80
No 35 44.00% 80
Mean 40
Median 40
Mode 10
Q5. Are you happy with the current location of Food for Friends?
Options No. of responses Response (%)
Total
respondents
Yes 35 44.00% 80
No 45 56.00% 80
Mean 40
Median 40
Mode 35
Q6. What are the new food items that you would like to introduce in the restaurant?
Options No. of responses Response (%)
Total
respondents
Mushroom and ale pie 20 24.00% 80
8
Document Page
Sausage rolls and salads 10 13.00% 80
Fried mushroom moose 10 13.00% 80
Tofu Steak 40 50.00% 80
Mean 20
Median 15
Mode 10
Q7. What are the changes that you would make in the restaurant?
Options No. of responses Response (%)
Total
respondents
Improve the lightning 15 19.00% 80
Encourage the playing of music 10 13.00% 80
Introduce the facility of drinks 25 30.00% 80
Make innovations in the sitting
arrangements 30 38.00% 80
Mean 20
Median 20
Mode 10
Q8. On a scale of 1 to 5, how much will you rate Food for Friends after comparing it
with other vegetarian restaurants?
Options No. of responses Response (%)
Total
respondents
Five 10 13.00% 80
Four 25 31.00% 80
Three 30 38.00% 80
Two 10 13.00% 80
One 5 6.00% 80
Mean 16
Median 10
Mode 10
Q9. Would you recommend the restaurant to any of your other friends?
Options No. of responses Response (%)
Total
respondents
Yes 50 62.00% 80
No 30 38.00% 80
Mean 40
Median 40
Mode 0
Q10. How far do you agree that Food for Friends serves its customers with customised
food?
Options No. of responses Response (%)
Total
respondents
Strongly agree 30 38.00% 80
Agree 20 25.00% 80
Neutral 10 13.00% 80
Disagree 5 6.00% 80
9
Document Page
Strongly disagree 15 19.00% 80
Mean 16
Median 15
Mode 5
Analyzing results for drawing valid conclusions (AC2.2)
According to the analysis of the sampling survey, it has been found that Food and
Friends has the capacity to retain existing customers and attract new customers because the
restaurant has maintained reasonable price for their quality service. Due to this, customers find
themselves quite satisfied with the service they enjoy on the ground of taste and price of the food
items. As per above it has been analysed that there are many factors that require special
consideration in the context of Foods for Friends to achieve sustainable growth. It is required to
make make expansion in overall business through achieving overall quality standards. On the
contrary, the restaurant has been facing the issue related to the location for the establishment of
second restaurant in London because the customers have found difficult to access the route to the
restaurant. Moreover, the targeted location will not yield much revenue due to the backwardness
of the area. Thus, it is advised that proper marketing strategies should be applied to be
acquainted with the economy of the London and its sub areas. Beside this promotion and
advertisement is significant factor which helps to attain target customers which create brand
value in long run. This would be useful to achieve more effective outcomes to analyse different
problems. It has been analyse that product and services are required in effective evaluation in
Food and Friends so company can apply most appropriate techniques in order to attain more
reliable results in coming years.
Analyzing data with the help of measures of dispersion (AC2.3)
Ratings R1 R2 R3 R4 R5
Standard
Deviation Variances
1 50 30 - - - 14.14214 200
2 30 35 15 5 - 13.76893 189.5833
3 25 20 5 15 10 7.90569 62.5
4 45 35 - - - 7.07107 50
5 35 45 - - - 7.07107 50
6 20 10 10 40 - 14.14214 200
10
tabler-icon-diamond-filled.svg

Paraphrase This Document

Need a fresh take? Get an instant paraphrase of this document with our AI Paraphraser
Document Page
7 15 10 25 30 - 9.12871 83.3333
8 10 25 30 10 5 10.83974 117.5
9 50 30 - - - 14.14214 200
10 30 20 10 5 15 9.61769 92.5
The above table exhibits standard deviation of data of 80 respondents which helps to
determine risk level associated with each rating as used in questionnaire and evaluation of the
standard deviation, it has been calculated to understand the differences in the response of the
customers. It has been found that irrespective of the mixed opinion of the customers, people of
London are food lovers and they would love to try new items. If any new restaurant would be
established, customers would automatically be attracted to the newly established restaurant to try
out something new. In addition if the price of the food items of new restaurant are marked
reasonable, chances of getting more and more customers would rise (Kołacz and
Grzegorzewski, 2016, p.932).
Analysing the data using correlation coefficient in business context (AC2.4)
Quartiles: it refers to a statistical measure which classifies or make divisions of data or
observation into equal four intervals. This measure assist in analyse values in order to describe
effective median measure in central tendency.
Percentile: It is a statistical term which is describes value less than certain percentage of
total or entire observations under a specific group of concern observations lies. Such as 10th
percentile indicates value or score less than 10% of observations probably found. It is major term
which assist to calculate a certain percentage of aggregate values.
Correlation coefficient: It is a statistical tool to analyse or determine level of
relationship between tow variables. The range defined under this statistical measure generally
close to 1.0 on varies between -1.0 to 1.0. Above 1.0 and less than -1.0 correlation measurement
is incorrect. -1.0 represents a perfect negative correlation whereas 1.0 indicates a perfect positive
correlation and correlation of 0.0 represent no relationship between variables.
Quartiles and percentiles are the representative measures like standard deviation and
variation. It indicates the percentage of a value below a certain value; which means 3rd quartile
represents 75% of the observations are below a certain amount and the rest 25% are above.
While observing the data, it is found that the mean is between the 2nd quartile and 65% of the
percentile. Therefore, the company should charge the mean amount for its services. The quartiles
and percentiles help in the decision-making progress that helps company to analyse and decide
11
Document Page
the price structure. Correlation coefficient measures the strength of the linear equation between
two variables. The value of correlation coefficient should be between -1 and +1. This is also
helpful in decision making. From the statistical data of Food of Friends, it is seen that the
managers must mitigate the risk by providing quality food and services to customers or they can
introduce new food items. They must control the increment in prices; otherwise, they will lose
the customers (Quinto et al. 2013, p.768).
Task 3
Producing graphs and drawing conclusions (AC3.1)
A survey is conducted to collect the information about restaurants and the customer’s
opinions that will help the managers to take appropriate decisions.
Figure 1: Do you frequently visit Food for Friends?
12
chevron_up_icon
1 out of 29
circle_padding
hide_on_mobile
zoom_out_icon
[object Object]