Business Decision Making Report: M&S Survey Analysis and Findings

Verified

Added on  2020/11/23

|17
|3079
|485
Report
AI Summary
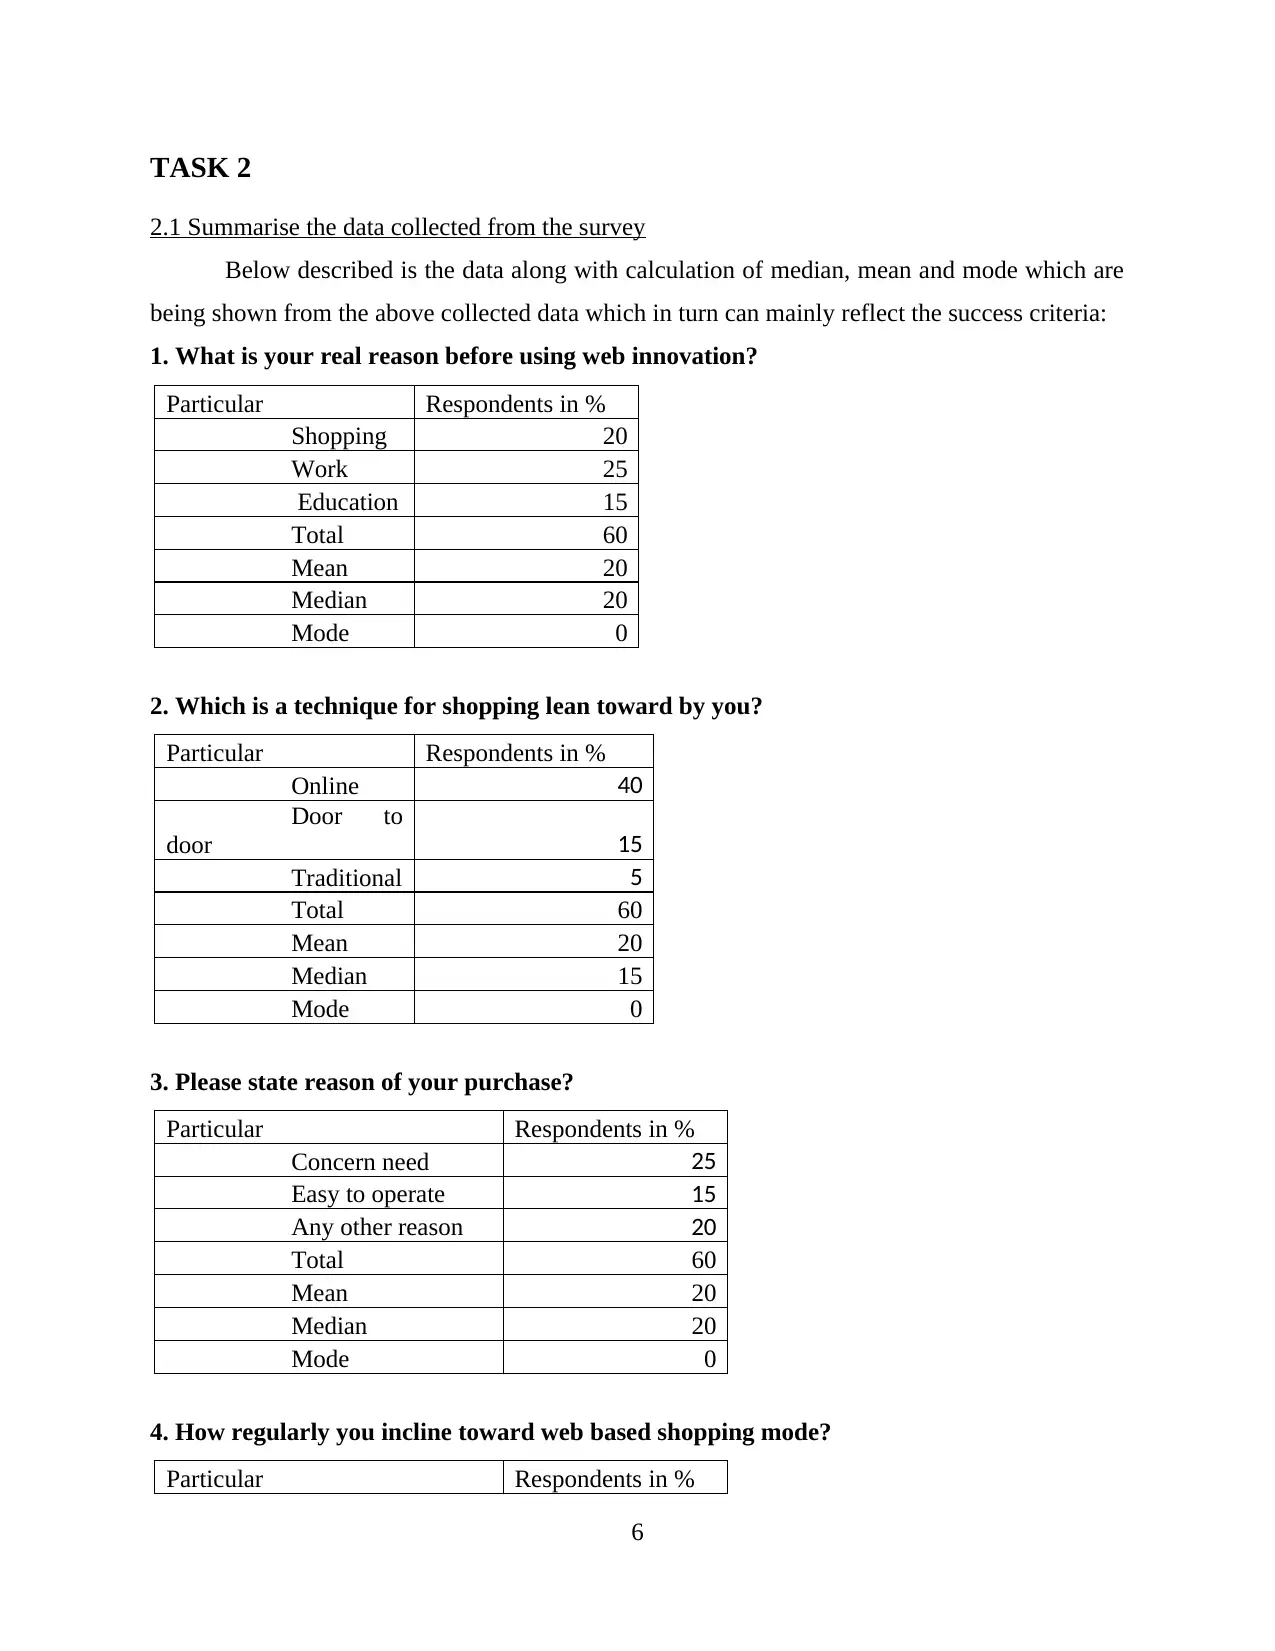
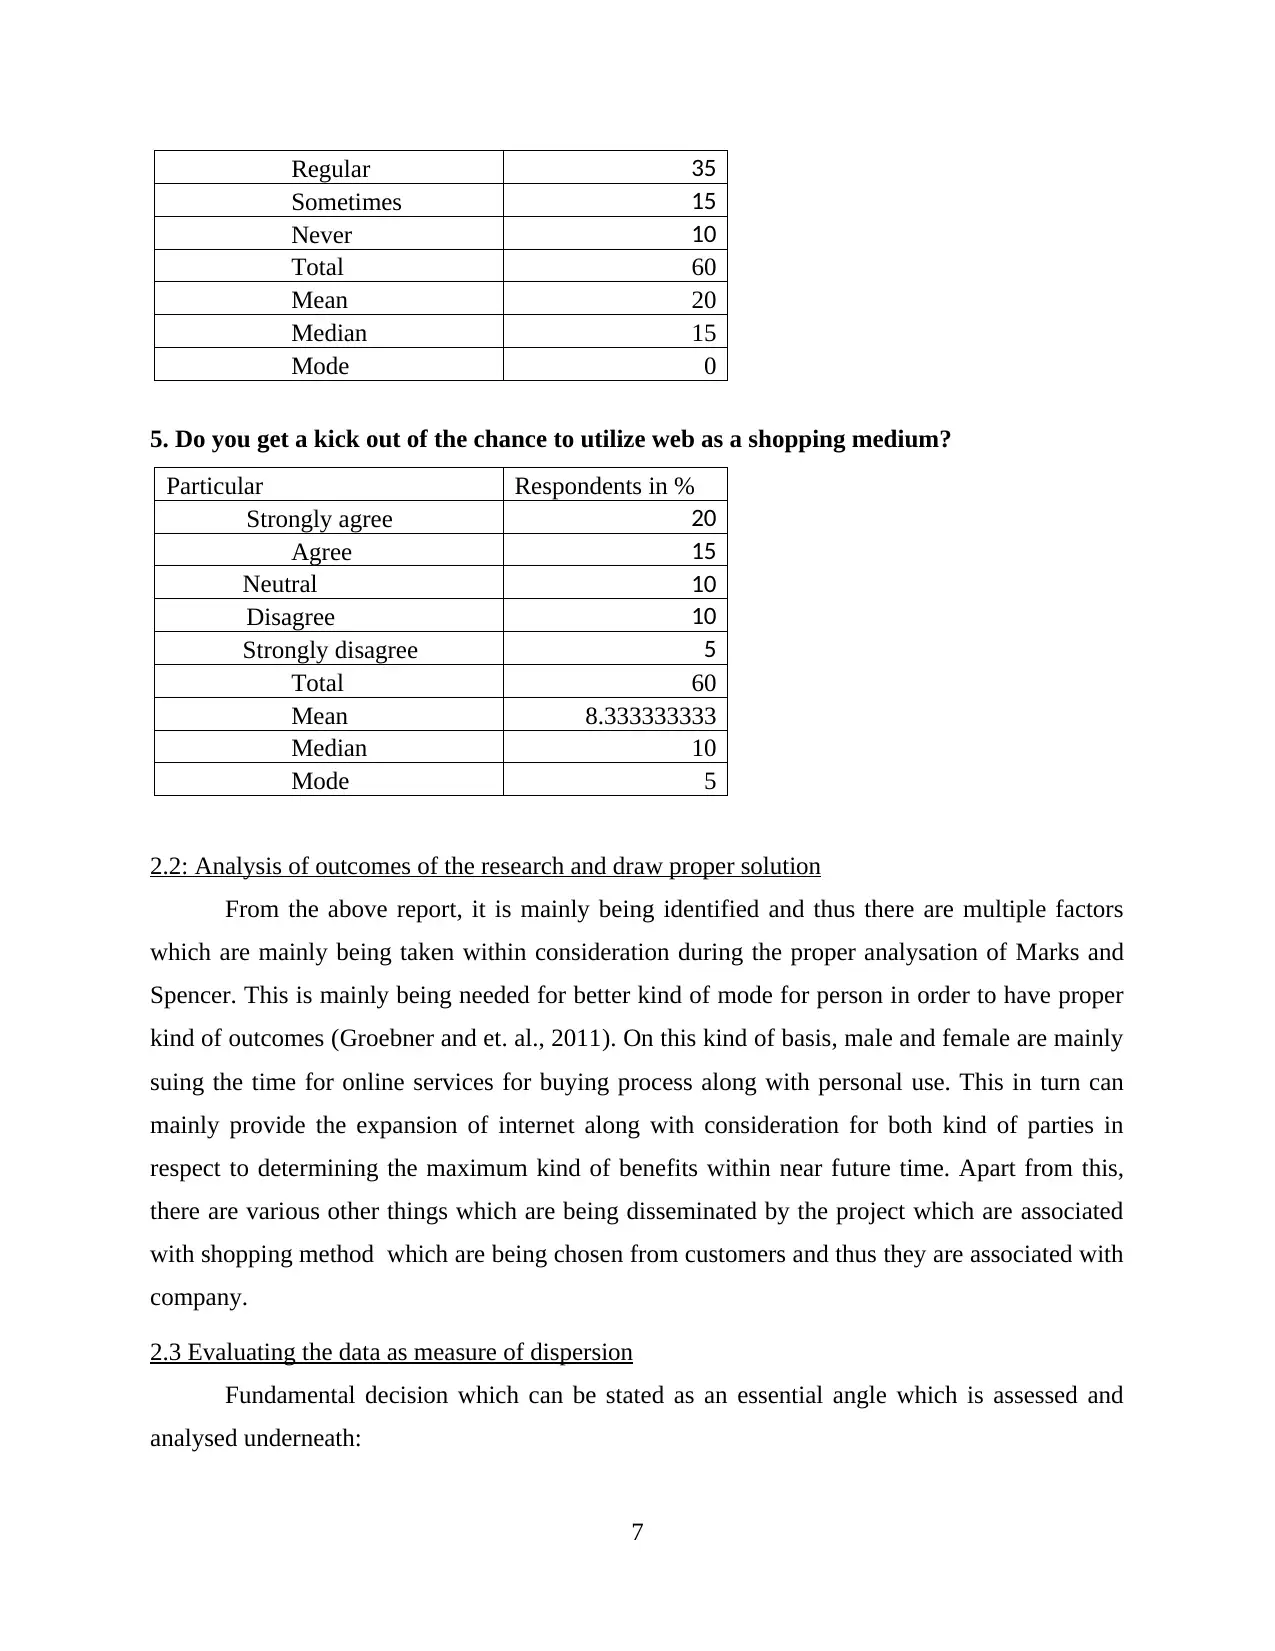
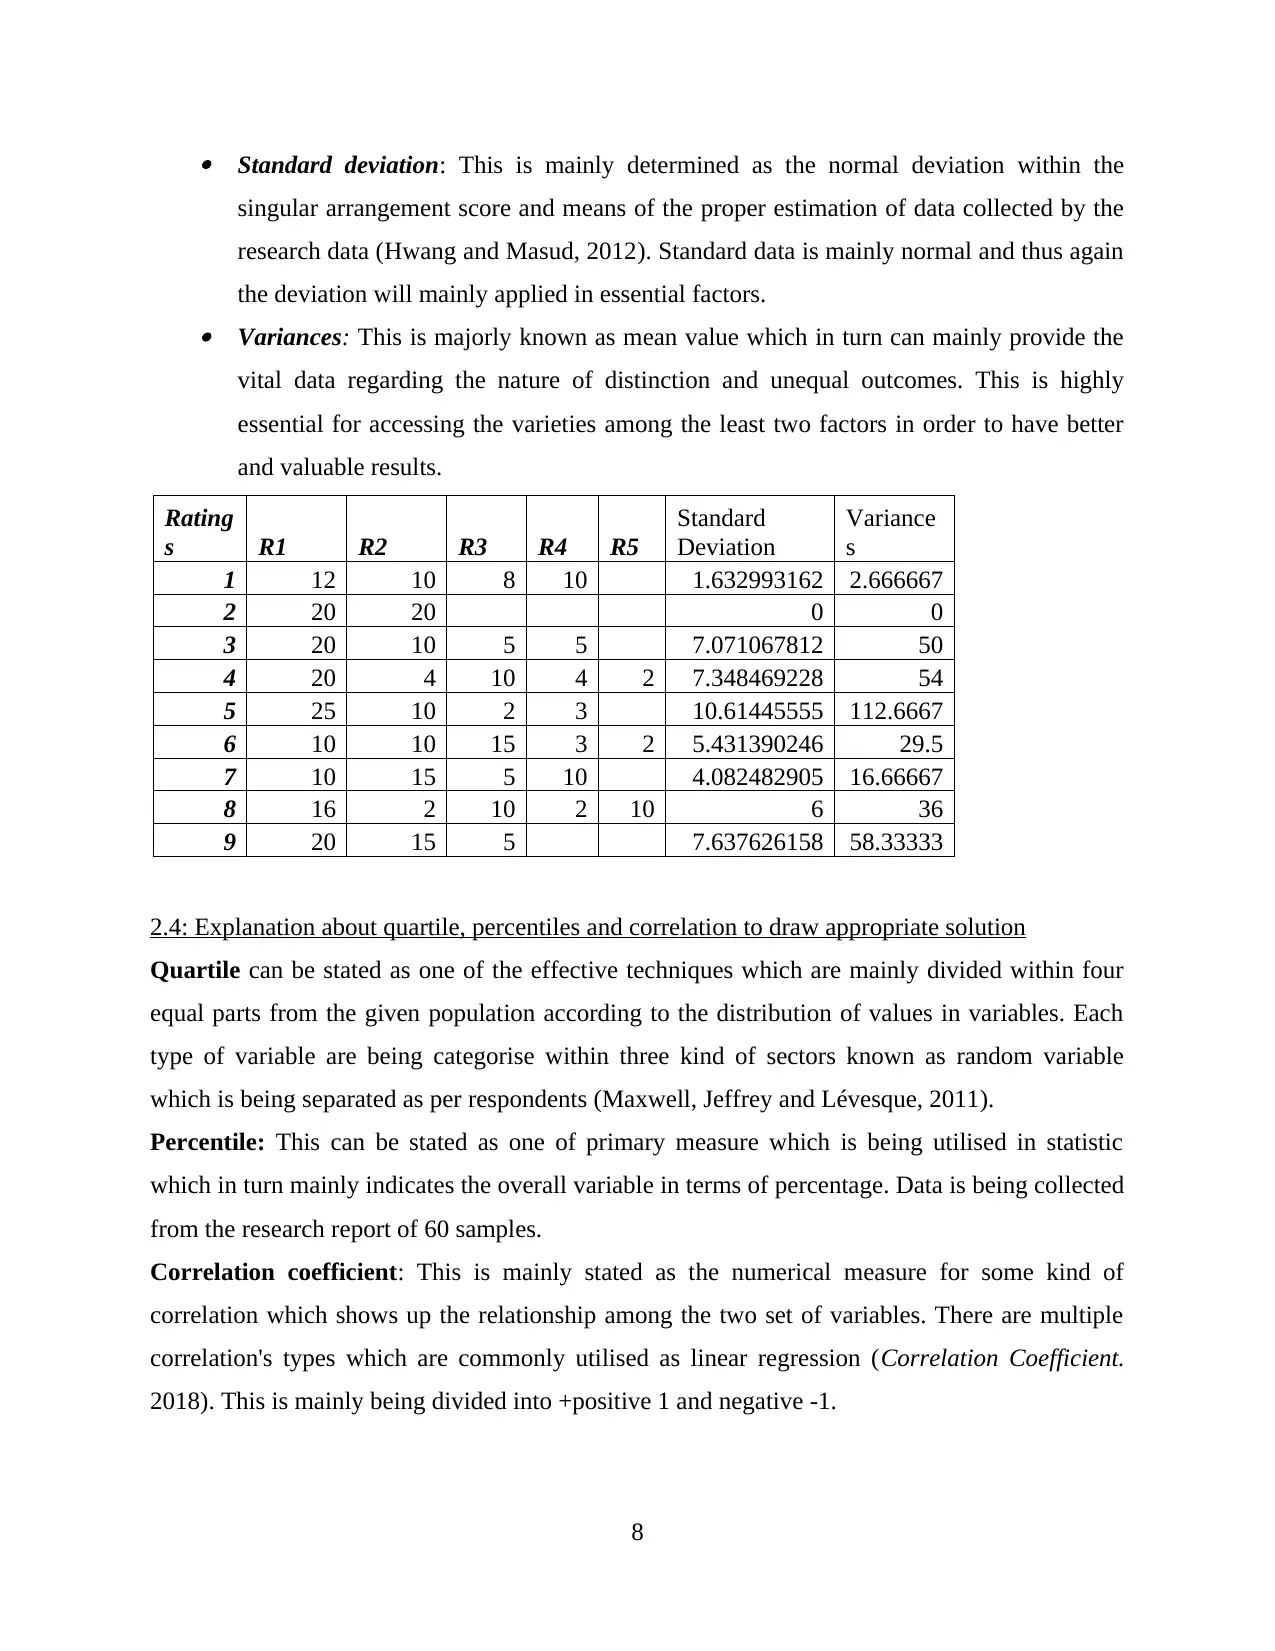
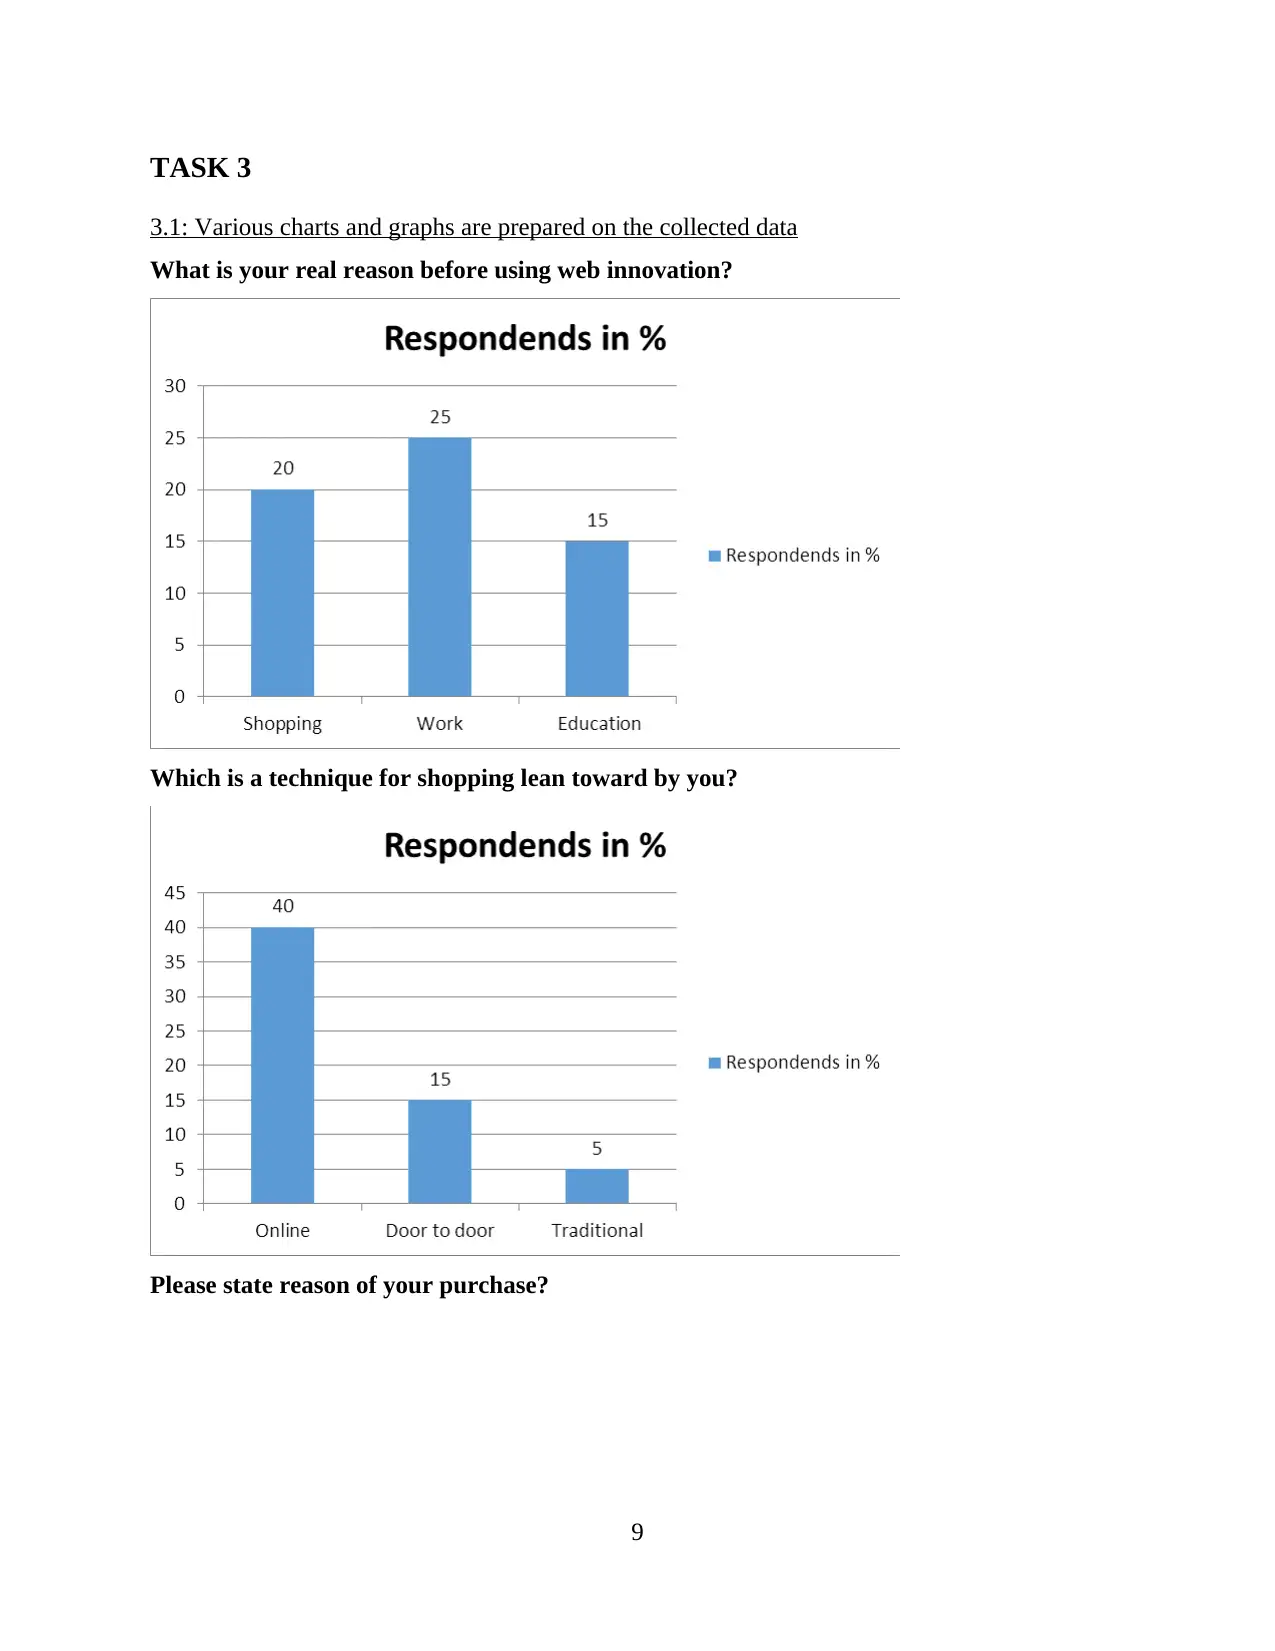
This report examines the business decision-making process at Marks and Spencer, utilizing survey data to understand consumer preferences and behaviors. The report begins with an introduction and outlines the research methodology, including the creation and distribution of a questionnaire to gather primary data. The analysis section summarizes the survey data, calculates mean, median, and mode, and evaluates the data using measures of dispersion such as standard deviation and variance. Quartiles, percentiles, and correlation coefficients are also explained to draw appropriate solutions. The report presents the data visually through charts and graphs, including trend line analysis to forecast future trends. A formal report and a poster are included to summarize the findings and recommendations. Finally, the report explores the roles and characteristics of various information systems, designs a critical path and Gantt chart, and applies financial tools to aid in decision-making, ultimately concluding with recommendations for Marks and Spencer based on the research findings.
Document Page
Business Decision Making
tabler-icon-diamond-filled.svg

Paraphrase This Document

Need a fresh take? Get an instant paraphrase of this document with our AI Paraphraser
Document Page
Table of Contents
INTRODUCTION...........................................................................................................................1
TASK 1............................................................................................................................................1
1.1 Creation of plan.....................................................................................................................1
1.2 Survey Methodology and sampling frame use .............................................................1
1.3 Creation of questionnaire......................................................................................................2
TASK 2............................................................................................................................................4
2.1 Summarise the data collected from the survey.....................................................................4
2.2: Analysis of outcomes of the research and draw proper solution .......................................5
2.3 Evaluating the data as measure of dispersion ..................................................................5
2.4: Explanation about quartile, percentiles and correlation to draw appropriate solution.........6
TASK 3............................................................................................................................................6
3.1: Various charts and graphs are prepared on the collected data.............................................6
3.2: Trend line analysis...............................................................................................................9
3.3 Poster...................................................................................................................................10
3.4: Formal report......................................................................................................................10
TASK 4..........................................................................................................................................11
4.1 Roles and characteristics play by various information system...........................................11
4.2 Design of critical path and Gantt chart in order to estimate things.....................................11
4.3 Use of financial tools for defining better decision making.................................................13
CONCLUSION..............................................................................................................................14
REFERENCES..............................................................................................................................15
Document Page
INTRODUCTION
There are many of the businesses which are working in market and the common issues
which they mainly face is decision making process which is being done on various kind of
research which in turn can mainly be conducted on several respondents (Bayne and Woolcock,
2011). Company taken for this kind report is Marks and Spencer which is retail company dealing
across the globe. Research can mainly be conducted for gaining the response for number of
people to support in making up of new venture. Managers mainly frame up the plan and on those
grounds data is being utilised to use questionnaire. On this basis, financial instruments will
mainly analyse the feasibility of project.
TASK 1
1.1 Creation of plan
Below described are the information collection tool which is being estimated by the
Marks and Spencer :
ï‚· Primary Data: This kind of factor mainly states that raw data which in turn has been
used for interpretation and give the support. This the primary source of data which helps
out in analyse the things in better and effectual manner with personal interaction process.
Numerous methods are mainly considered under the primary method which are like
questionnaire, personal interview and many more (Ford and Richardson, 2013). This in
turn can result in better level of dissemination of data.
ï‚· Secondary Data: Another tool which can be stated for supporting the views and defining
the aspects which is secondary source of data. In this kind of aspect, data is mainly
analysed for taking the consideration for giving better definition to things. Records
mainly includes profit and loss statement, cash flow and many more.
1.2 Survey Methodology and sampling frame use
Surveys are the major part of the research which includes the support in analysing the
factors in better and effectual manner. There are various kind of methods which are being needed
to include in this report and give out beneficial outcomes. Basic survey methodologies which are
being utilised for the current topic is described below:
ï‚· Survey method: This can be stated as one of the electronic source of data which in turn
can give support for availing aspects like E-mail. This can be stated as modern kind of
Document Page
survey method which can currently utilise many companies for deriving the stakeholders
mindset for effective judgement.
ï‚· Questionnaire: Another consideration in supporting the questionnaire which will not get
organised on vast individual and its surface area is limited (García-Peñalvo and Conde,
2014). This has to be mainly understood at the execution time of project for determining
the results which can be enhanced.
1.3 Creation of questionnaire
Questionnaire can be stated as an approach within survey which helps out in taking out
the benefits attribution for the project. This in turn can mainly result in drawing the beneficial
kind of outcomes for maintaining. There are 5 questions included in questionnaire with the
random sampling method upon more then 100 individuals.
tabler-icon-diamond-filled.svg

Paraphrase This Document

Need a fresh take? Get an instant paraphrase of this document with our AI Paraphraser
Document Page
QUESTIONNAIRE
Name:
Age:
Gender:
Email:
Phone Number:
1. What is your real reason before using web innovation?
ï‚· Shopping
ï‚· Work
ï‚· Education
2. Which is a technique for shopping lean toward by you?
ï‚· On line
ï‚· Door to Door
ï‚· Traditional
3. Please state reason of your purchase?
ï‚· Concern need
ï‚· Easy to operate
ï‚· Any other reason
4. How regularly you incline toward web based shopping mode?
ï‚· Regularly
ï‚· Sometimes
ï‚· Never
5. Do you get a kick out of the chance to utilize web as a shopping medium?
ï‚· Strongly agree
ï‚· Agree
ï‚· Neutral
ï‚· Disagree
ï‚· Strongly agree
Q6. Any further recommendation?
5
Document Page
TASK 2
2.1 Summarise the data collected from the survey
Below described is the data along with calculation of median, mean and mode which are
being shown from the above collected data which in turn can mainly reflect the success criteria:
1. What is your real reason before using web innovation?
Particular Respondents in %
Shopping 20
Work 25
Education 15
Total 60
Mean 20
Median 20
Mode 0
2. Which is a technique for shopping lean toward by you?
Particular Respondents in %
Online 40
Door to
door 15
Traditional 5
Total 60
Mean 20
Median 15
Mode 0
3. Please state reason of your purchase?
Particular Respondents in %
Concern need 25
Easy to operate 15
Any other reason 20
Total 60
Mean 20
Median 20
Mode 0
4. How regularly you incline toward web based shopping mode?
Particular Respondents in %
6
Document Page
Regular 35
Sometimes 15
Never 10
Total 60
Mean 20
Median 15
Mode 0
5. Do you get a kick out of the chance to utilize web as a shopping medium?
Particular Respondents in %
Strongly agree 20
Agree 15
Neutral 10
Disagree 10
Strongly disagree 5
Total 60
Mean 8.333333333
Median 10
Mode 5
2.2: Analysis of outcomes of the research and draw proper solution
From the above report, it is mainly being identified and thus there are multiple factors
which are mainly being taken within consideration during the proper analysation of Marks and
Spencer. This is mainly being needed for better kind of mode for person in order to have proper
kind of outcomes (Groebner and et. al., 2011). On this kind of basis, male and female are mainly
suing the time for online services for buying process along with personal use. This in turn can
mainly provide the expansion of internet along with consideration for both kind of parties in
respect to determining the maximum kind of benefits within near future time. Apart from this,
there are various other things which are being disseminated by the project which are associated
with shopping method which are being chosen from customers and thus they are associated with
company.
2.3 Evaluating the data as measure of dispersion
Fundamental decision which can be stated as an essential angle which is assessed and
analysed underneath:
7
tabler-icon-diamond-filled.svg

Paraphrase This Document

Need a fresh take? Get an instant paraphrase of this document with our AI Paraphraser
Document Page
ï‚· Standard deviation: This is mainly determined as the normal deviation within the
singular arrangement score and means of the proper estimation of data collected by the
research data (Hwang and Masud, 2012). Standard data is mainly normal and thus again
the deviation will mainly applied in essential factors.ï‚· Variances: This is majorly known as mean value which in turn can mainly provide the
vital data regarding the nature of distinction and unequal outcomes. This is highly
essential for accessing the varieties among the least two factors in order to have better
and valuable results.
Rating
s R1 R2 R3 R4 R5
Standard
Deviation
Variance
s
1 12 10 8 10 1.632993162 2.666667
2 20 20 0 0
3 20 10 5 5 7.071067812 50
4 20 4 10 4 2 7.348469228 54
5 25 10 2 3 10.61445555 112.6667
6 10 10 15 3 2 5.431390246 29.5
7 10 15 5 10 4.082482905 16.66667
8 16 2 10 2 10 6 36
9 20 15 5 7.637626158 58.33333
2.4: Explanation about quartile, percentiles and correlation to draw appropriate solution
Quartile can be stated as one of the effective techniques which are mainly divided within four
equal parts from the given population according to the distribution of values in variables. Each
type of variable are being categorise within three kind of sectors known as random variable
which is being separated as per respondents (Maxwell, Jeffrey and Lévesque, 2011).
Percentile: This can be stated as one of primary measure which is being utilised in statistic
which in turn mainly indicates the overall variable in terms of percentage. Data is being collected
from the research report of 60 samples.
Correlation coefficient: This is mainly stated as the numerical measure for some kind of
correlation which shows up the relationship among the two set of variables. There are multiple
correlation's types which are commonly utilised as linear regression (Correlation Coefficient.
2018). This is mainly being divided into +positive 1 and negative -1.
8
Document Page
TASK 3
3.1: Various charts and graphs are prepared on the collected data
What is your real reason before using web innovation?
Which is a technique for shopping lean toward by you?
Please state reason of your purchase?
9
Document Page
How regularly you incline toward web based shopping mode?
Do you get a kick out of the chance to utilize web as a shopping medium?
10
tabler-icon-diamond-filled.svg

Paraphrase This Document

Need a fresh take? Get an instant paraphrase of this document with our AI Paraphraser
Document Page
3.2: Trend line analysis
There are mainly numerous kind of patterns which are being needed by the researcher for
forecasting the coming future. This mainly deals with benefits for the company and thus those
are connected with every kind of individual data which can be comprehended by company's
management (Schmoldt and et. al., 2013). Ample of opportunities are being provided for gaining
expected outcomes in specific tenure. Estimation will be done by analysing trend line charts.
Sales Revenue Year
10,000
unit
5,00,000 2018-
2019
15,000
units
1,20,000 2019-
2020
18,000
units
14,00,000 2020-
2021
11
Document Page
From the above trend line graphs, company observed that the they had started from 2017 to
2021. There are certain results which are mainly giving out new ways of innovation for business
along with its ability which can give out proper nature of which is being held responsible for
having better kind of results during the period tenure (Stine and Foster, 2014).
3.3 Poster
3.4: Formal report
REPORT
To
The managers
Retail time magazine
Data: 5th June 2018
Subject:
Introduction:
This kind of project is mainly based upon the collecting the effective data from
numerous respondents which are using internet facilities fro own use. Research is being done on
various kind of perspectives where the people will mainly utilise them for online shopping
approaches from past few years.
Methodology: This kind of report is mainly being prepared by various methods which are
responsible for giving out crucial kind of data to research. Some of them are mainly related with
12
chevron_up_icon
1 out of 17
circle_padding
hide_on_mobile
zoom_out_icon
[object Object]