Business Decision Making Report: UKCBC College, Student Analysis
VerifiedAdded on 2020/07/22
|55
|9015
|29
Report
AI Summary
This report provides a detailed analysis of business decision-making at UKCBC College, focusing on student satisfaction and experience. The study involves a survey of students from two campuses, Wentworth and Lord House, to gather data on their perceptions of educational facilities and services. The report outlines the methodology, including the design of a questionnaire with closed-ended questions, and the selection of a simple random sampling technique to gather primary data. Descriptive statistics such as mean, mode, and median are used to summarize and analyze the survey data, revealing insights into student demographics, campus preferences, course choices, and class attendance. The analysis extends to the use of graphs, trend lines, and investment appraisal techniques to support decision-making processes. Furthermore, the report includes a project plan and discusses information processing tools. The findings are presented in a formal business report and a PowerPoint presentation, offering recommendations for enhancing the college's operations and student satisfaction.

BUSINESS DECISION
MAKING
MAKING
Paraphrase This Document
Need a fresh take? Get an instant paraphrase of this document with our AI Paraphraser
TABLE OF CONTENTS
INTRODUCTION...........................................................................................................................1
TASK 1............................................................................................................................................1
a. Creating a plan for the collection of data............................................................................1
b. Presenting survey methodology and sampling frame in the context of current research issue
................................................................................................................................................3
c. Designing a questionnaire for survey.................................................................................4
TASK 2..........................................................................................................................................10
a. Summarizing data gathered through descriptive statistics via mean, mode and median..10
b. Analysing results of survey and drawing conclusion.......................................................13
c. Measures of dispersion.....................................................................................................16
d. Calculating quartile and percentile...................................................................................16
TASK 3..........................................................................................................................................21
a. Producing graphs by using spreadsheets..........................................................................21
b. Creating trend line for assessing the pattern of student’s responses................................36
c. Preparing power point presentation for presenting findings.............................................40
d. Producing a formal business report..................................................................................40
TASK 4..........................................................................................................................................42
a. Analysing information processing tools that help in decision making.............................42
b. Preparing project plan and determination of critical path................................................43
c. Using investment appraisal techniques for decision making............................................45
CONCLUSION..............................................................................................................................47
REFERENCES..............................................................................................................................48
APPENDIX ...................................................................................................................................50
Appendix 1: Research Questionnaire...................................................................................50
INTRODUCTION
For the success of any business, it is necessary to have good planning and decision
making team. To compete in this world that is full of challenges and competition, one should
have to be good in the decision making. Employee's Development is necessary for college in
measuring the work performance of professors and tutors. It helps the students in building their
career on the right path by motivating them towards achieving study goals.
This project report is based on UKCBC which is one of the leading college institutions of
UK. For conducting study in appropriate manner two campuses of educational institution has
been selected such as Wentworth and Lord house. Innovative ideas from employees make new
changes in the growth of UKCBC College. So, the talented and skilled teachers are to be hired
over there. Besides this, report will also shed light on statistical as well as financial tools and
techniques that aid in the decision making process. Hence, report will develop understanding
about varied tools like correlation, descriptive statistics etc.It also depicts manner in which
information processing tool helps in simplifying the large data set. The present report will
present the manner in which different investment appraisal techniques help in selecting suitable
project
TASK 1
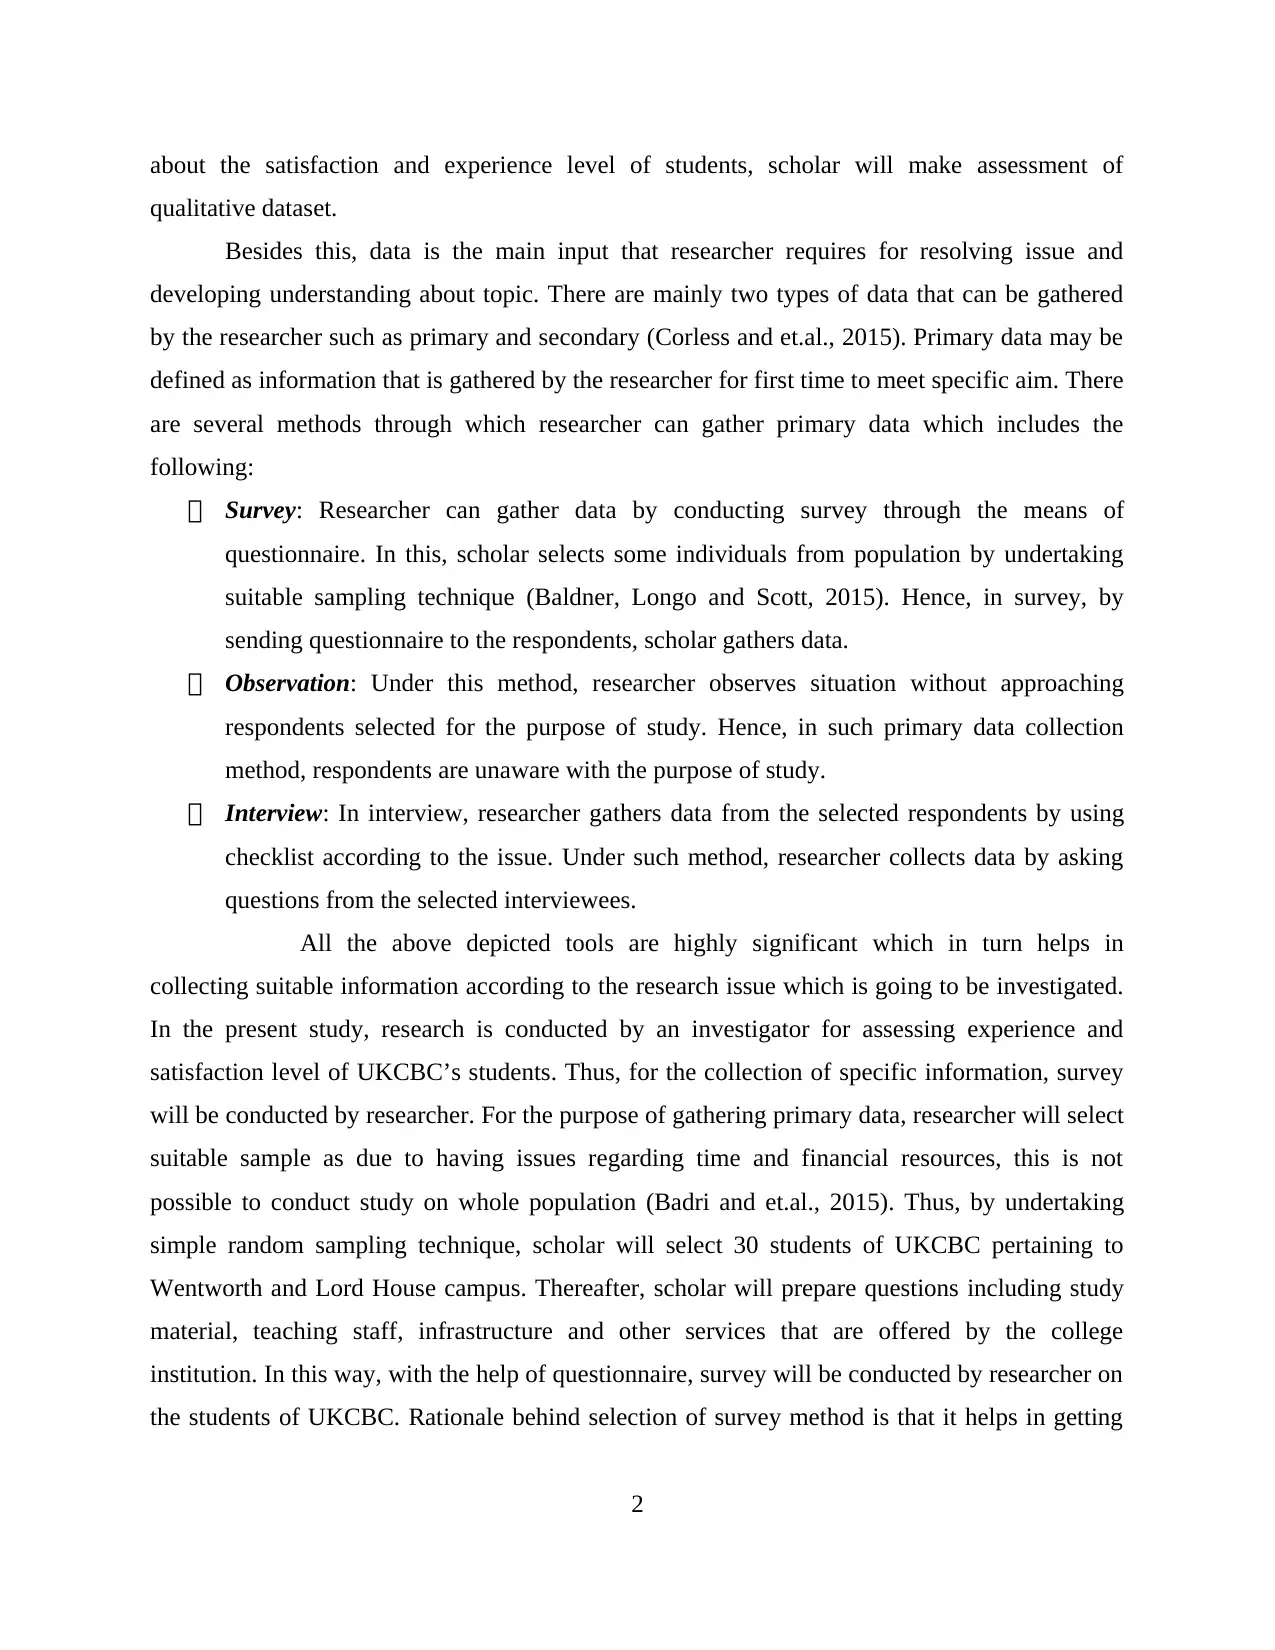
a. Creating a plan for the collection of data
On the basis of cited case situation, UKCBC College wishes to get information about
experience and satisfaction level of students. Higher authorities of college want to assess the
challenges that are facing by students. Growth and success of the college is highly influenced
from the extent to which students are satisfied with the educational facilities provided by
institution. Thus, to meet such objective, UKCBC has taken decision in relation to conduct
investigation. In this, researcher is required to select appropriate investigation type out of two
such as qualitative and quantitative. Under qualitative investigation, scholar makes assessment of
theoretical aspects and thereby presents suitable solution. Such investigation is highly significant
which in turn helps in developing future hypothesis more effectually (Anderson and et.al., 2015).
On the other side, in quantitative investigation, scholar makes assessment of numeric facts and
figures to analyse the issue.
In this, qualitative investigation has been selected by the researcher which in turn helps in
evaluating the underlying facts and opinions more effectually. Thus, for getting information
1
For the success of any business, it is necessary to have good planning and decision
making team. To compete in this world that is full of challenges and competition, one should
have to be good in the decision making. Employee's Development is necessary for college in
measuring the work performance of professors and tutors. It helps the students in building their
career on the right path by motivating them towards achieving study goals.
This project report is based on UKCBC which is one of the leading college institutions of
UK. For conducting study in appropriate manner two campuses of educational institution has
been selected such as Wentworth and Lord house. Innovative ideas from employees make new
changes in the growth of UKCBC College. So, the talented and skilled teachers are to be hired
over there. Besides this, report will also shed light on statistical as well as financial tools and
techniques that aid in the decision making process. Hence, report will develop understanding
about varied tools like correlation, descriptive statistics etc.It also depicts manner in which
information processing tool helps in simplifying the large data set. The present report will
present the manner in which different investment appraisal techniques help in selecting suitable
project
TASK 1
a. Creating a plan for the collection of data
On the basis of cited case situation, UKCBC College wishes to get information about
experience and satisfaction level of students. Higher authorities of college want to assess the
challenges that are facing by students. Growth and success of the college is highly influenced
from the extent to which students are satisfied with the educational facilities provided by
institution. Thus, to meet such objective, UKCBC has taken decision in relation to conduct
investigation. In this, researcher is required to select appropriate investigation type out of two
such as qualitative and quantitative. Under qualitative investigation, scholar makes assessment of
theoretical aspects and thereby presents suitable solution. Such investigation is highly significant
which in turn helps in developing future hypothesis more effectually (Anderson and et.al., 2015).
On the other side, in quantitative investigation, scholar makes assessment of numeric facts and
figures to analyse the issue.
In this, qualitative investigation has been selected by the researcher which in turn helps in
evaluating the underlying facts and opinions more effectually. Thus, for getting information
1
⊘ This is a preview!⊘
Do you want full access?
Subscribe today to unlock all pages.
Trusted by 1+ million students worldwide
about the satisfaction and experience level of students, scholar will make assessment of
qualitative dataset.
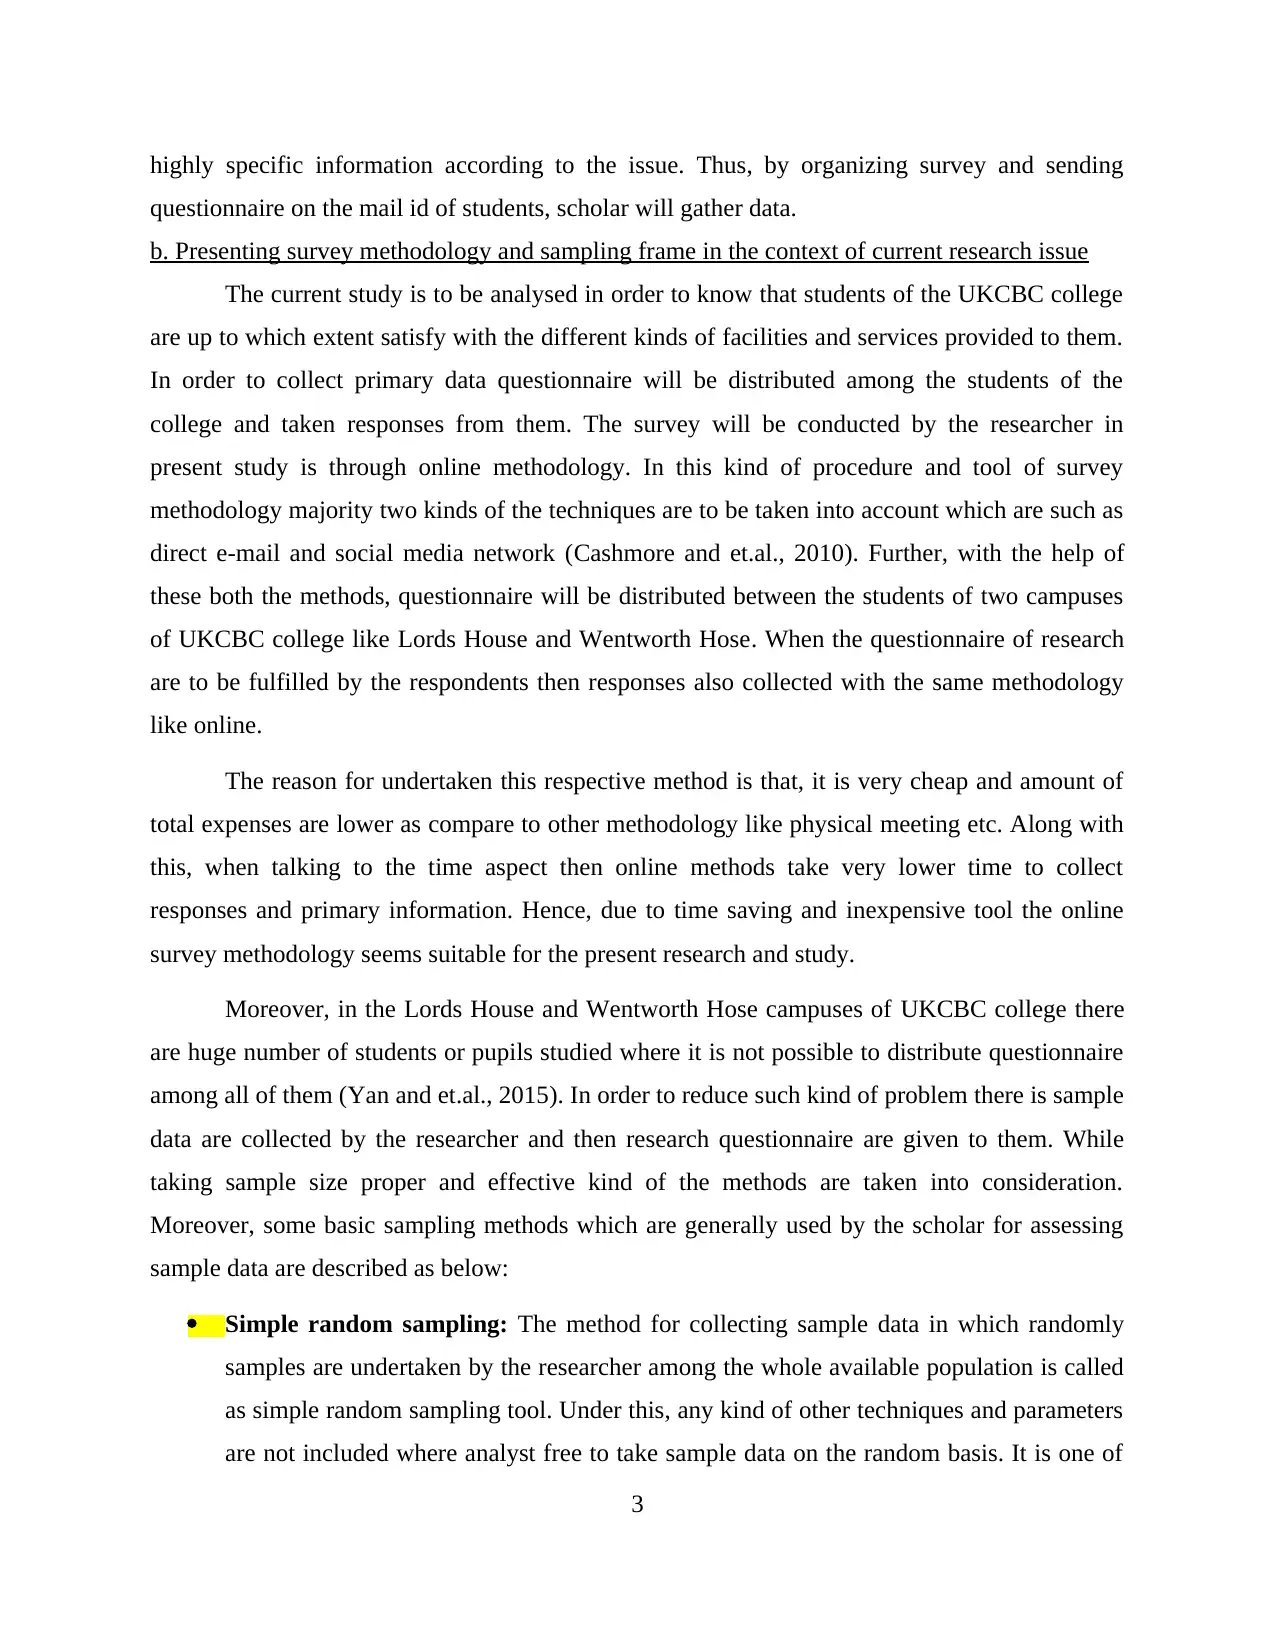
Besides this, data is the main input that researcher requires for resolving issue and
developing understanding about topic. There are mainly two types of data that can be gathered
by the researcher such as primary and secondary (Corless and et.al., 2015). Primary data may be
defined as information that is gathered by the researcher for first time to meet specific aim. There
are several methods through which researcher can gather primary data which includes the
following:
Survey: Researcher can gather data by conducting survey through the means of
questionnaire. In this, scholar selects some individuals from population by undertaking
suitable sampling technique (Baldner, Longo and Scott, 2015). Hence, in survey, by
sending questionnaire to the respondents, scholar gathers data.
Observation: Under this method, researcher observes situation without approaching
respondents selected for the purpose of study. Hence, in such primary data collection
method, respondents are unaware with the purpose of study.
Interview: In interview, researcher gathers data from the selected respondents by using
checklist according to the issue. Under such method, researcher collects data by asking
questions from the selected interviewees.
All the above depicted tools are highly significant which in turn helps in
collecting suitable information according to the research issue which is going to be investigated.
In the present study, research is conducted by an investigator for assessing experience and
satisfaction level of UKCBC’s students. Thus, for the collection of specific information, survey
will be conducted by researcher. For the purpose of gathering primary data, researcher will select
suitable sample as due to having issues regarding time and financial resources, this is not
possible to conduct study on whole population (Badri and et.al., 2015). Thus, by undertaking
simple random sampling technique, scholar will select 30 students of UKCBC pertaining to
Wentworth and Lord House campus. Thereafter, scholar will prepare questions including study
material, teaching staff, infrastructure and other services that are offered by the college
institution. In this way, with the help of questionnaire, survey will be conducted by researcher on
the students of UKCBC. Rationale behind selection of survey method is that it helps in getting
2
qualitative dataset.
Besides this, data is the main input that researcher requires for resolving issue and
developing understanding about topic. There are mainly two types of data that can be gathered
by the researcher such as primary and secondary (Corless and et.al., 2015). Primary data may be
defined as information that is gathered by the researcher for first time to meet specific aim. There
are several methods through which researcher can gather primary data which includes the
following:
Survey: Researcher can gather data by conducting survey through the means of
questionnaire. In this, scholar selects some individuals from population by undertaking
suitable sampling technique (Baldner, Longo and Scott, 2015). Hence, in survey, by
sending questionnaire to the respondents, scholar gathers data.
Observation: Under this method, researcher observes situation without approaching
respondents selected for the purpose of study. Hence, in such primary data collection
method, respondents are unaware with the purpose of study.
Interview: In interview, researcher gathers data from the selected respondents by using
checklist according to the issue. Under such method, researcher collects data by asking
questions from the selected interviewees.
All the above depicted tools are highly significant which in turn helps in
collecting suitable information according to the research issue which is going to be investigated.
In the present study, research is conducted by an investigator for assessing experience and
satisfaction level of UKCBC’s students. Thus, for the collection of specific information, survey
will be conducted by researcher. For the purpose of gathering primary data, researcher will select
suitable sample as due to having issues regarding time and financial resources, this is not
possible to conduct study on whole population (Badri and et.al., 2015). Thus, by undertaking
simple random sampling technique, scholar will select 30 students of UKCBC pertaining to
Wentworth and Lord House campus. Thereafter, scholar will prepare questions including study
material, teaching staff, infrastructure and other services that are offered by the college
institution. In this way, with the help of questionnaire, survey will be conducted by researcher on
the students of UKCBC. Rationale behind selection of survey method is that it helps in getting
2
Paraphrase This Document
Need a fresh take? Get an instant paraphrase of this document with our AI Paraphraser
highly specific information according to the issue. Thus, by organizing survey and sending
questionnaire on the mail id of students, scholar will gather data.
b. Presenting survey methodology and sampling frame in the context of current research issue
The current study is to be analysed in order to know that students of the UKCBC college
are up to which extent satisfy with the different kinds of facilities and services provided to them.
In order to collect primary data questionnaire will be distributed among the students of the
college and taken responses from them. The survey will be conducted by the researcher in
present study is through online methodology. In this kind of procedure and tool of survey
methodology majority two kinds of the techniques are to be taken into account which are such as
direct e-mail and social media network (Cashmore and et.al., 2010). Further, with the help of
these both the methods, questionnaire will be distributed between the students of two campuses
of UKCBC college like Lords House and Wentworth Hose. When the questionnaire of research
are to be fulfilled by the respondents then responses also collected with the same methodology
like online.
The reason for undertaken this respective method is that, it is very cheap and amount of
total expenses are lower as compare to other methodology like physical meeting etc. Along with
this, when talking to the time aspect then online methods take very lower time to collect
responses and primary information. Hence, due to time saving and inexpensive tool the online
survey methodology seems suitable for the present research and study.
Moreover, in the Lords House and Wentworth Hose campuses of UKCBC college there
are huge number of students or pupils studied where it is not possible to distribute questionnaire
among all of them (Yan and et.al., 2015). In order to reduce such kind of problem there is sample
data are collected by the researcher and then research questionnaire are given to them. While
taking sample size proper and effective kind of the methods are taken into consideration.
Moreover, some basic sampling methods which are generally used by the scholar for assessing
sample data are described as below:
Simple random sampling: The method for collecting sample data in which randomly
samples are undertaken by the researcher among the whole available population is called
as simple random sampling tool. Under this, any kind of other techniques and parameters
are not included where analyst free to take sample data on the random basis. It is one of
3
the very easy as well simple method in which any kind of difficulty is not to be faced by
the scholar.
Cluster sampling: According to this method of sample size collection, overall research
area is to be divided on the basis of geographic concepts (Barrick and et.al., 2015). It is
one of the best tool of sample data collection for the marketing researcher where analysis
of the overall area can be done in effectual ways. Further, in this kind of method
parameters are settled out which are geographic basis.
Stratified sampling: As per this respective method, sample size are taken on the basis of
different demographic factors and elements which are like age, gender, marital status etc
(Danforth and et.al., 2016). Further, overall population is to be divided in such kind of the
aspects and then sample data are collected.
In the present study of Lords House and Wentworth Hose campuses, simple random
sampling method is undertaken by the researcher where sample of 60 students are taken
randomly.
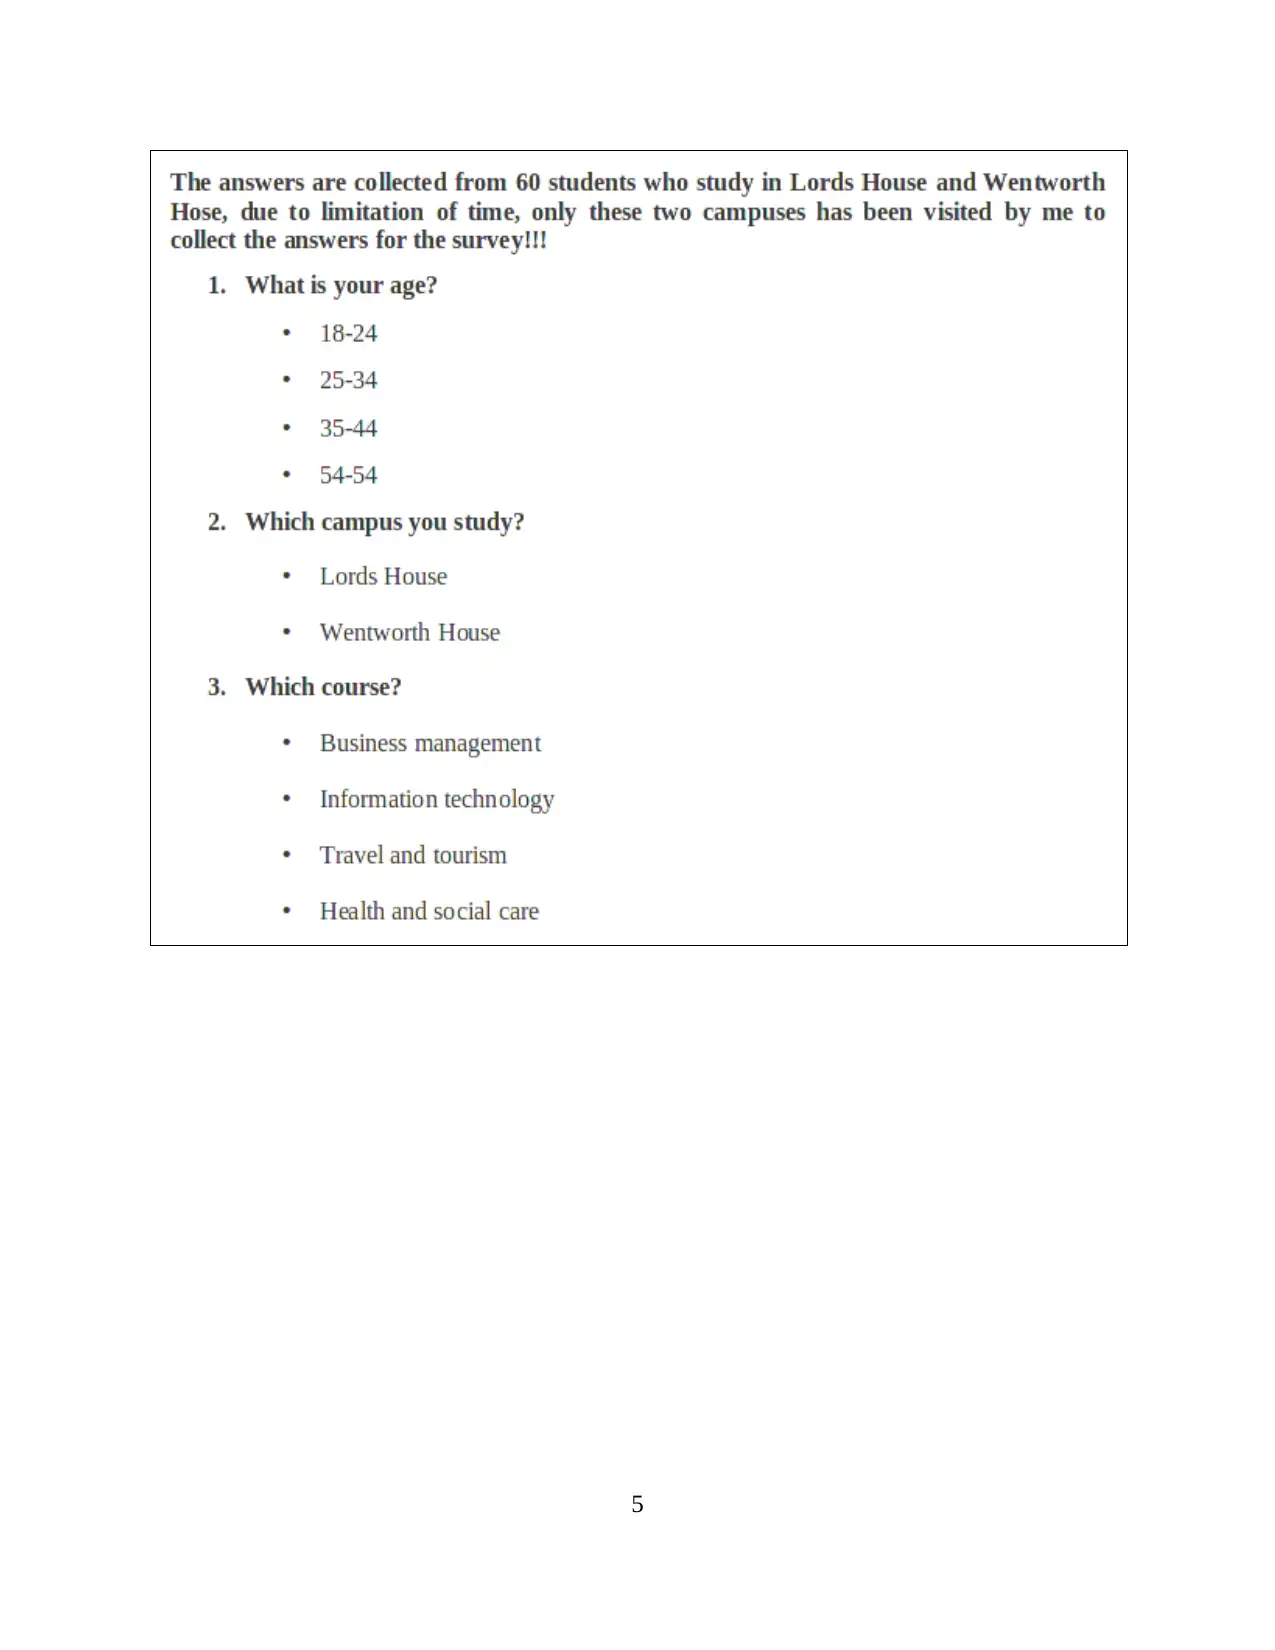
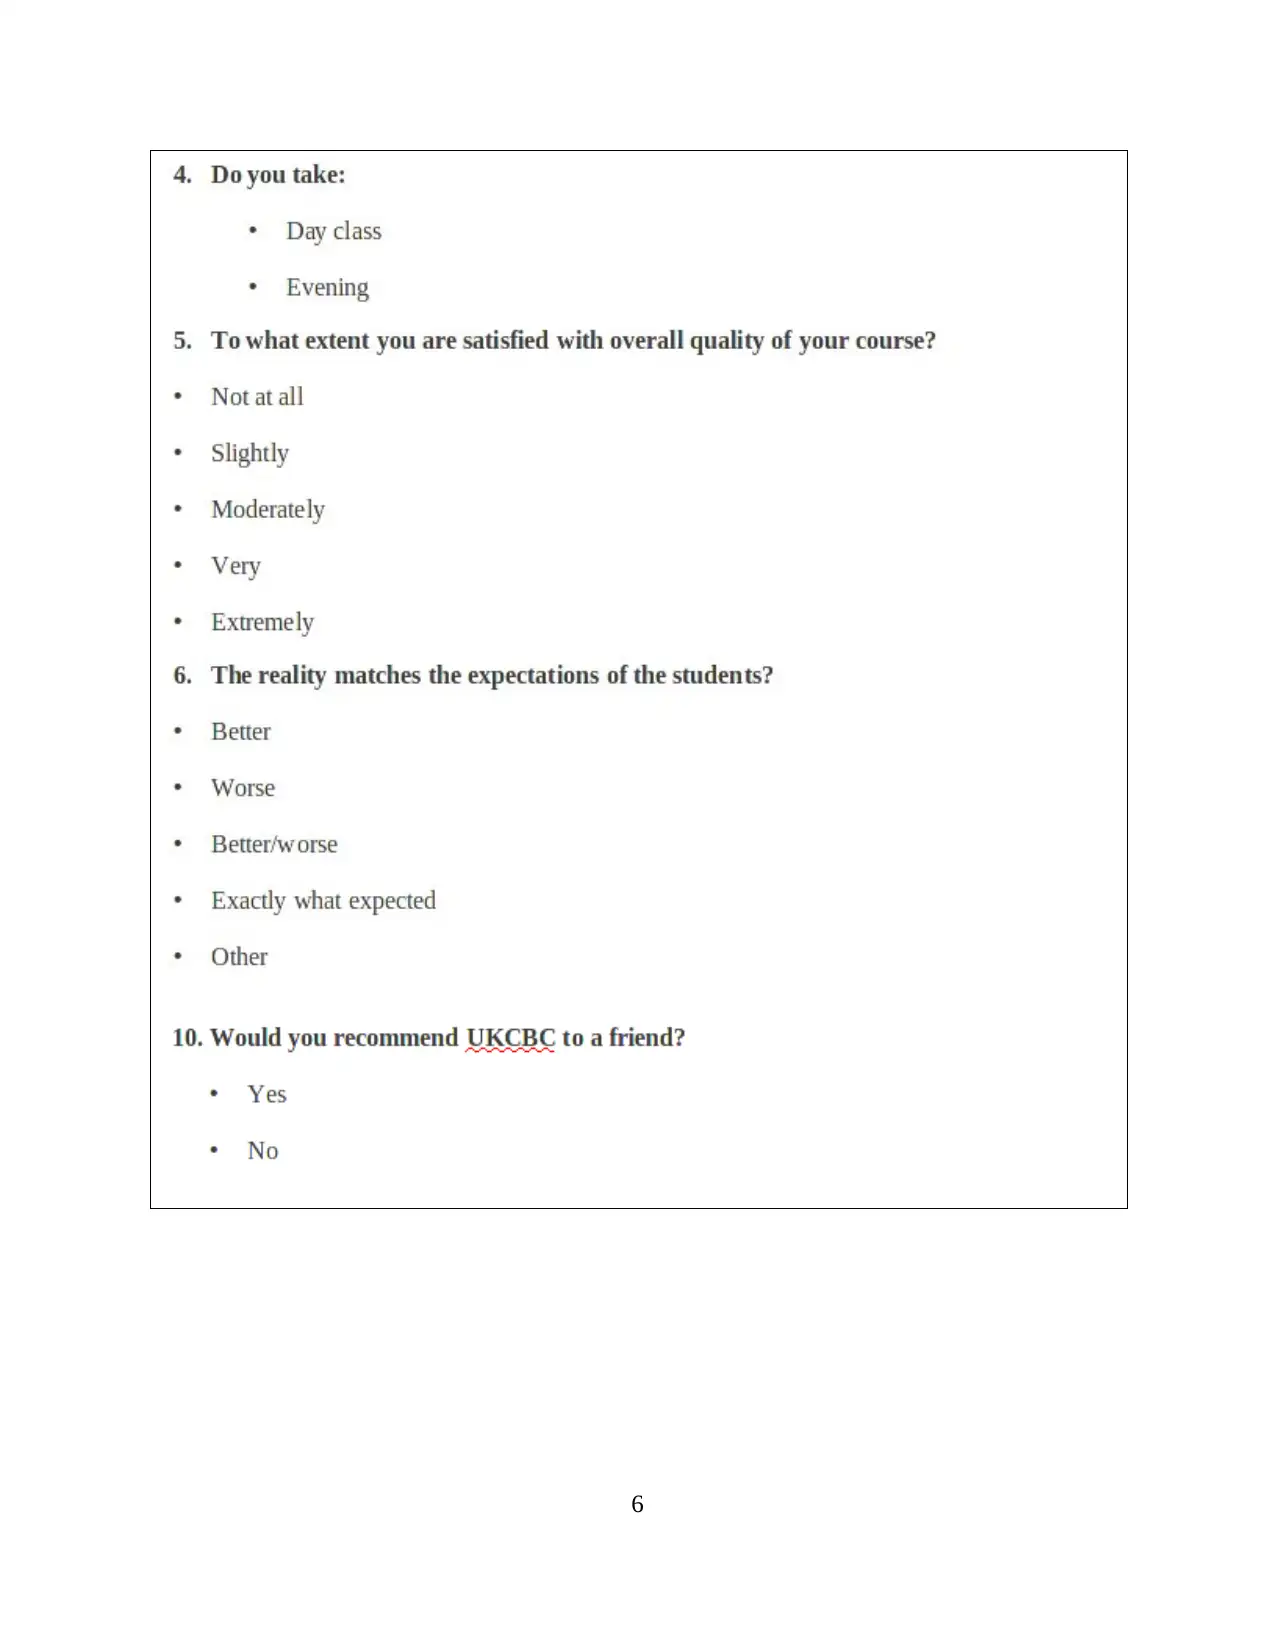
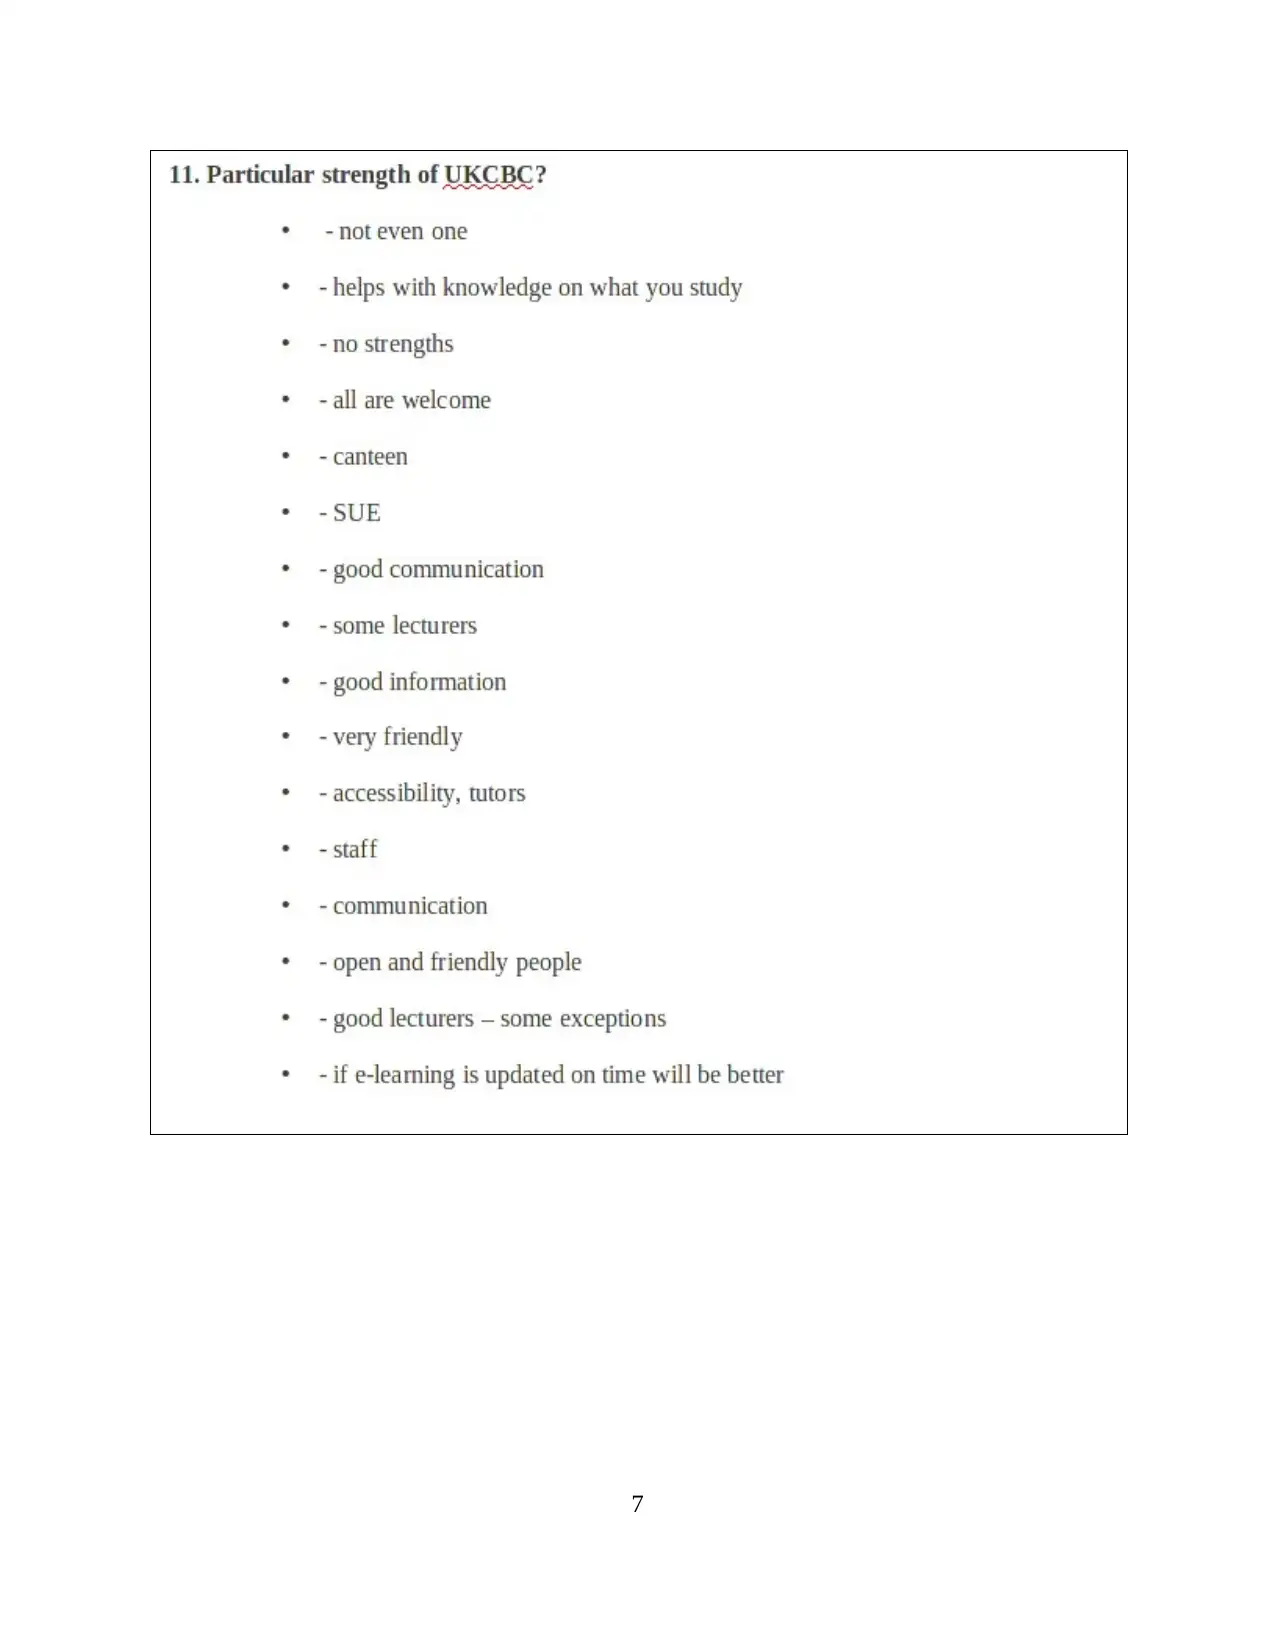
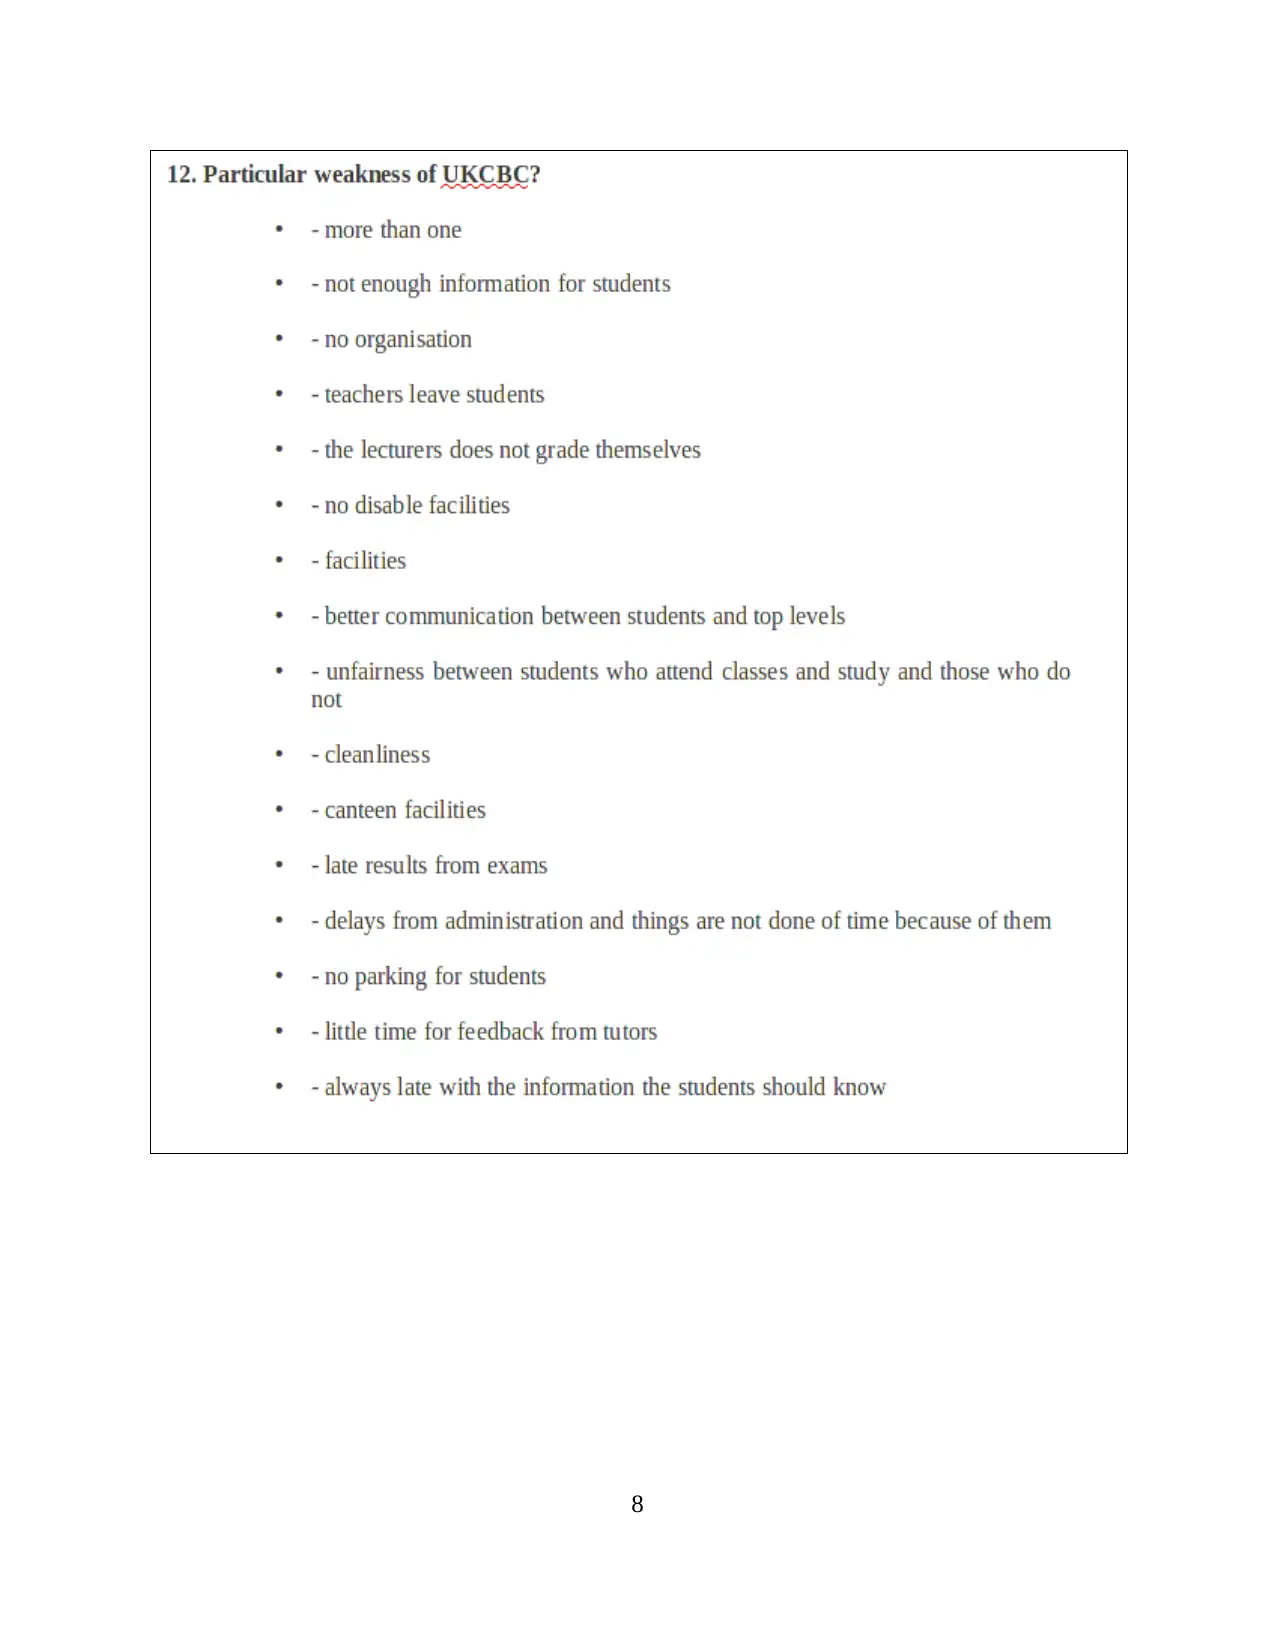
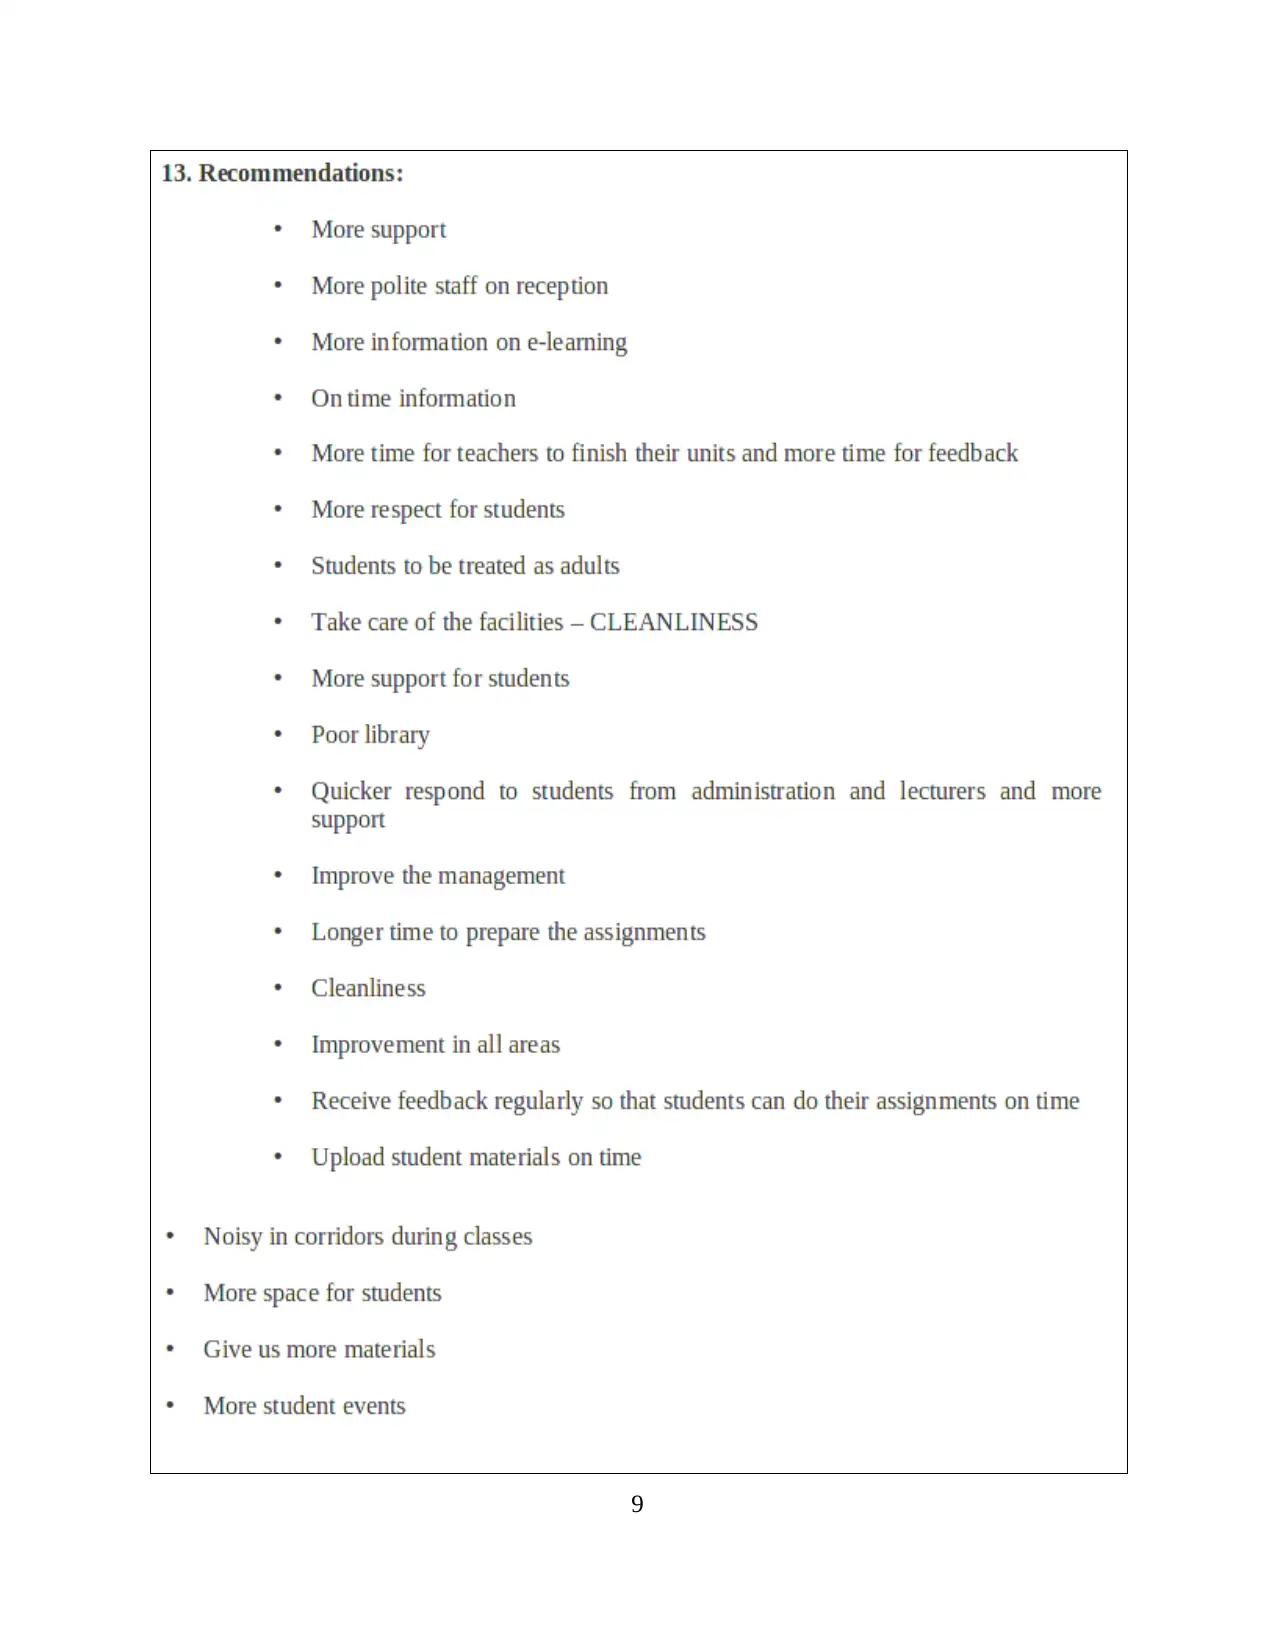
c. Designing a questionnaire for survey
In order to do survey of the students of two campuses of the UKCBC college there are
questionnaire framed and distributed among them. Further, questions for conducting research are
of the close ended in which options are to be given (Bantug and et.al., 2016). Such kinds of
questions are stated below:
Research Questionnaire
4
the scholar.
Cluster sampling: According to this method of sample size collection, overall research
area is to be divided on the basis of geographic concepts (Barrick and et.al., 2015). It is
one of the best tool of sample data collection for the marketing researcher where analysis
of the overall area can be done in effectual ways. Further, in this kind of method
parameters are settled out which are geographic basis.
Stratified sampling: As per this respective method, sample size are taken on the basis of
different demographic factors and elements which are like age, gender, marital status etc
(Danforth and et.al., 2016). Further, overall population is to be divided in such kind of the
aspects and then sample data are collected.
In the present study of Lords House and Wentworth Hose campuses, simple random
sampling method is undertaken by the researcher where sample of 60 students are taken
randomly.
c. Designing a questionnaire for survey
In order to do survey of the students of two campuses of the UKCBC college there are
questionnaire framed and distributed among them. Further, questions for conducting research are
of the close ended in which options are to be given (Bantug and et.al., 2016). Such kinds of
questions are stated below:
Research Questionnaire
4
⊘ This is a preview!⊘
Do you want full access?
Subscribe today to unlock all pages.
Trusted by 1+ million students worldwide
5
Paraphrase This Document
Need a fresh take? Get an instant paraphrase of this document with our AI Paraphraser
6
7
⊘ This is a preview!⊘
Do you want full access?
Subscribe today to unlock all pages.
Trusted by 1+ million students worldwide
8
Paraphrase This Document
Need a fresh take? Get an instant paraphrase of this document with our AI Paraphraser
9
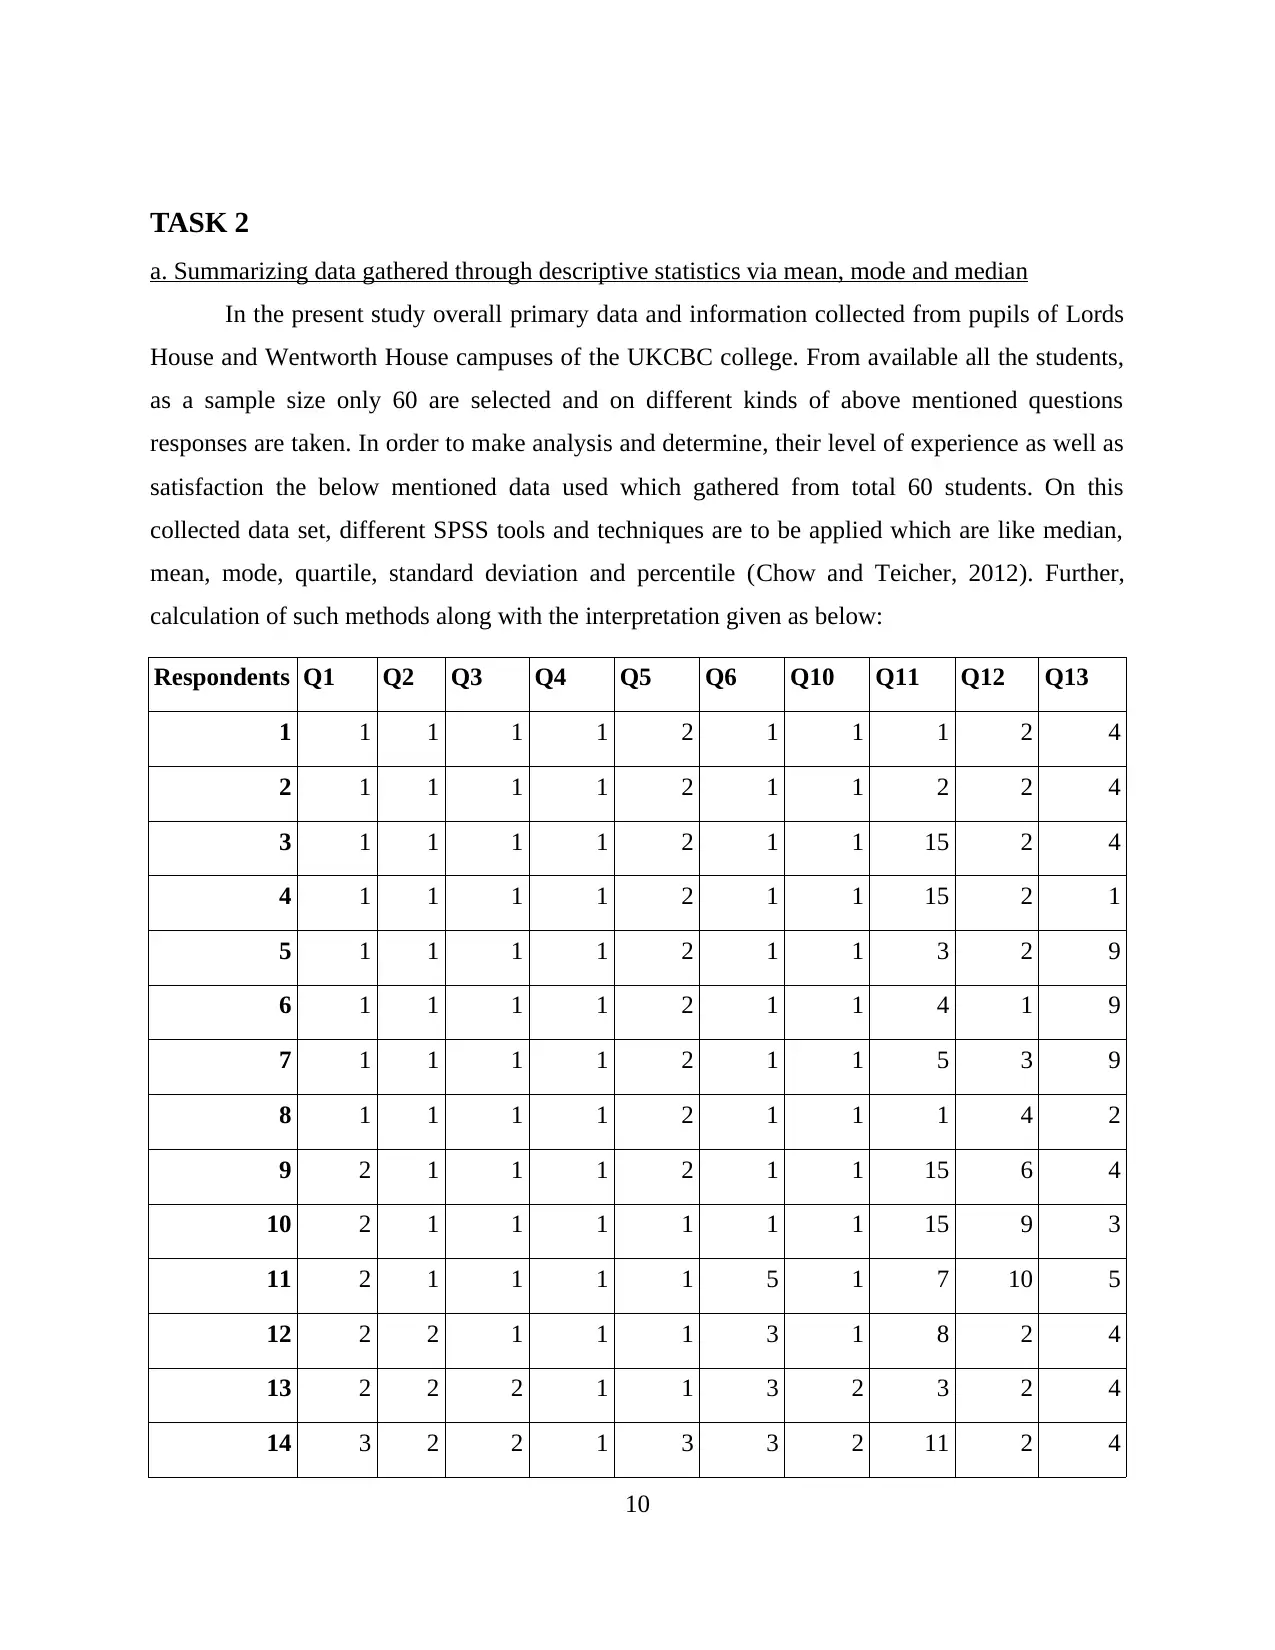
TASK 2
a. Summarizing data gathered through descriptive statistics via mean, mode and median
In the present study overall primary data and information collected from pupils of Lords
House and Wentworth House campuses of the UKCBC college. From available all the students,
as a sample size only 60 are selected and on different kinds of above mentioned questions
responses are taken. In order to make analysis and determine, their level of experience as well as
satisfaction the below mentioned data used which gathered from total 60 students. On this
collected data set, different SPSS tools and techniques are to be applied which are like median,
mean, mode, quartile, standard deviation and percentile (Chow and Teicher, 2012). Further,
calculation of such methods along with the interpretation given as below:
Respondents Q1 Q2 Q3 Q4 Q5 Q6 Q10 Q11 Q12 Q13
1 1 1 1 1 2 1 1 1 2 4
2 1 1 1 1 2 1 1 2 2 4
3 1 1 1 1 2 1 1 15 2 4
4 1 1 1 1 2 1 1 15 2 1
5 1 1 1 1 2 1 1 3 2 9
6 1 1 1 1 2 1 1 4 1 9
7 1 1 1 1 2 1 1 5 3 9
8 1 1 1 1 2 1 1 1 4 2
9 2 1 1 1 2 1 1 15 6 4
10 2 1 1 1 1 1 1 15 9 3
11 2 1 1 1 1 5 1 7 10 5
12 2 2 1 1 1 3 1 8 2 4
13 2 2 2 1 1 3 2 3 2 4
14 3 2 2 1 3 3 2 11 2 4
10
⊘ This is a preview!⊘
Do you want full access?
Subscribe today to unlock all pages.
Trusted by 1+ million students worldwide
1 out of 55
Related Documents


Your All-in-One AI-Powered Toolkit for Academic Success.
+13062052269
info@desklib.com
Available 24*7 on WhatsApp / Email
![[object Object]](/_next/static/media/star-bottom.7253800d.svg)
Unlock your academic potential
Copyright © 2020–2026 A2Z Services. All Rights Reserved. Developed and managed by ZUCOL.