Local College Business Decision Making Report Analysis
VerifiedAdded on 2020/01/15
|18
|3292
|192
Report
AI Summary
This report, prepared for a local college, addresses business decision-making challenges by analyzing primary and secondary data to improve course offerings and services. It employs questionnaires, survey methodologies, and statistical tools such as measures of dispersion, quartiles, percentiles, and correlation coefficients to analyze data related to expenditure, profits, and student feedback. The analysis includes graphical representations of sales and price trends, followed by project management strategies for introducing a new computer system. The report concludes with recommendations based on the findings to enhance the college's competitiveness and student satisfaction. The report covers topics like data collection methods, questionnaire design, survey methodology, sampling frame, descriptive statistics, measure of dispersion, and project management.

BUSINESS DECISION MAKING
Paraphrase This Document
Need a fresh take? Get an instant paraphrase of this document with our AI Paraphraser
TABLE OF CONTENTS
Introduction..........................................................................................................................................
Task One...............................................................................................................................................
Data collection Methods..............................................................................................................1
Questionnaire...............................................................................................................................2
Survey methodology and sampling frame...................................................................................3
Developing information for decision making..............................................................................4
Measure of dispersion..................................................................................................................5
Explanation of quartiles, percentiles and the correlation coefficient...........................................6
Summary of the data using representative values........................................................................7
Task Two..............................................................................................................................................
Graphs and Spreadsheets.............................................................................................................8
Task Three..........................................................................................................................................
Project Management..................................................................................................................10
Conclusion..........................................................................................................................................
References..........................................................................................................................................
INTRODUCTION
Every business operating in the current market is making valiant efforts to maintain its
position moreover enhancing its functioning to attain long term sustainability. Herein, local
college is seeking for the advice regarding developing new courses and other services to
effectively compete in the market (Francioni, Musso and Cioppi, 2015). For this, business
consultant has been hired who as the responsibility to carry out analysis for gathering secondary
and primary data for future improvements for the college. Further, different statistical tools has
been used to conduct the study and analyzing the collected information. Lastly, through the
means of project management tool, proper plan has been developed regarding introducing new
computer system for A&H Jones.
TASK ONE
Data collection Methods
There are several methods through the means of which researcher can gather the data and
accordingly analysis the findings. Popularly there are two approaches such as Primary and
secondary with the help of which investigator gathers wide range of information. Herein,
business consultant has been hired by the Local College’s top level management who is planning
to introduce new courses and other services so that they can enhance the level of education
within the institute and effectively compete within the target market (Amankwah-Amoah, 2015).
Primary data: Looking at the nature of current study, primary data collection method is
considered as the feasible option to gather wide range of data regarding improvements in
the services for college as well as introducing new courses for better education system.
Herein, consultant is focusing framing questionnaire in which both open ended and close
ended questions will be asked to the independent students who currently studying in the
college as well as to the students who have passed from the college.
Secondary data: This is one of the most important source of collecting data because with
the help of this research can develop suitable theoretical base and understanding the
requirement according to the topic. According to the present given scenario, business
consultant will gather secondary data by analysing and evaluating the current courses
available in the college (Pimentel, Kuntz and Elenkov, 2010). Further, analysing the
official websites of other competitors so as to identify the courses offered by them. Along
1 | P a g e
⊘ This is a preview!⊘
Do you want full access?
Subscribe today to unlock all pages.
Trusted by 1+ million students worldwide
with secondary data will assist in analysing the current trends in terms of courses
available for the students through the means of which management can easily enhance
their current portfolio as per the purchasing habits of students.
Questionnaire
Questionnaire
Demographic:
Name: _____
Age: _____
Gender: _____
Ques1: For which course are you associated with Local College?
Diplomas
Bachelor degrees
Foundation degrees
Post-graduation degrees
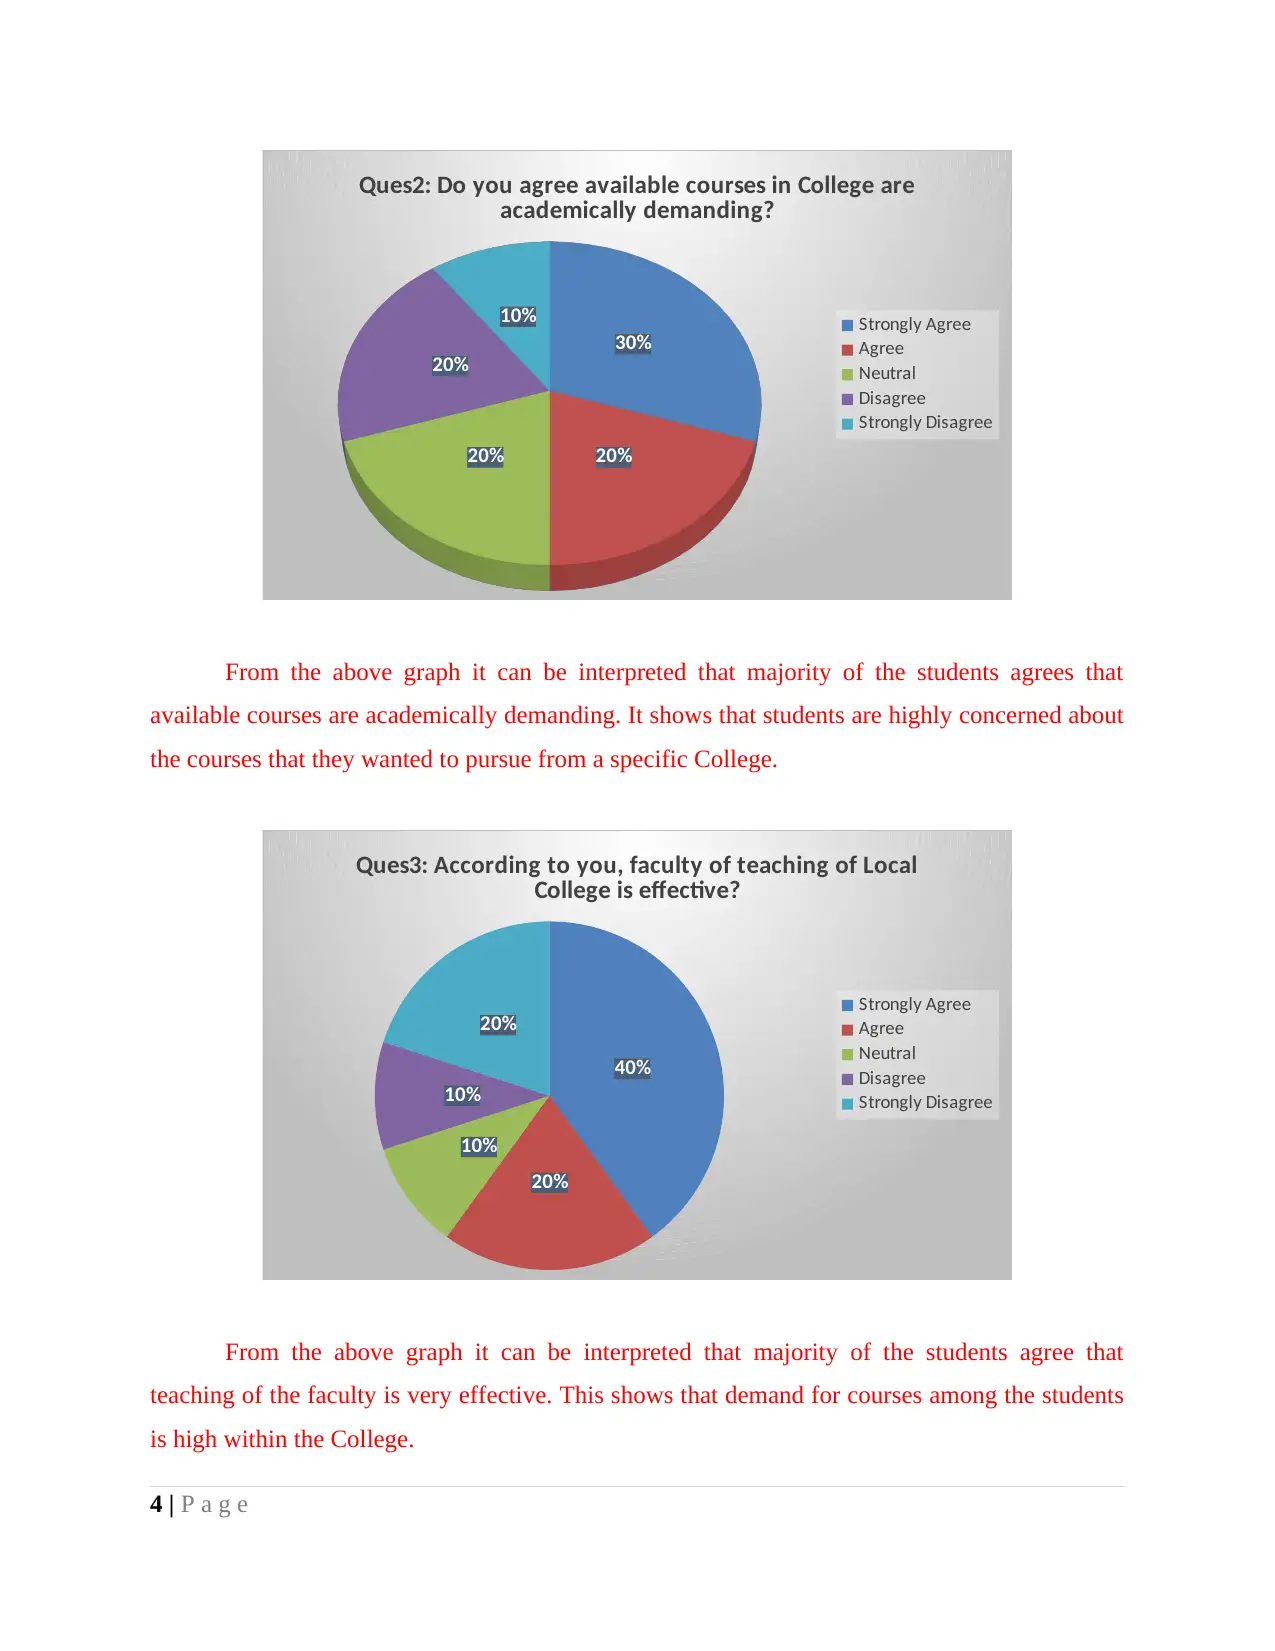
Ques2: Do you agree available courses in College are academically demanding?
Strongly Agree
Agree
Neutral
Disagree
Strongly Disagree
Ques3: According to you, faculty of teaching of Local College is effective?
Strongly Agree
Agree
Neutral
Disagree
Strongly Disagree
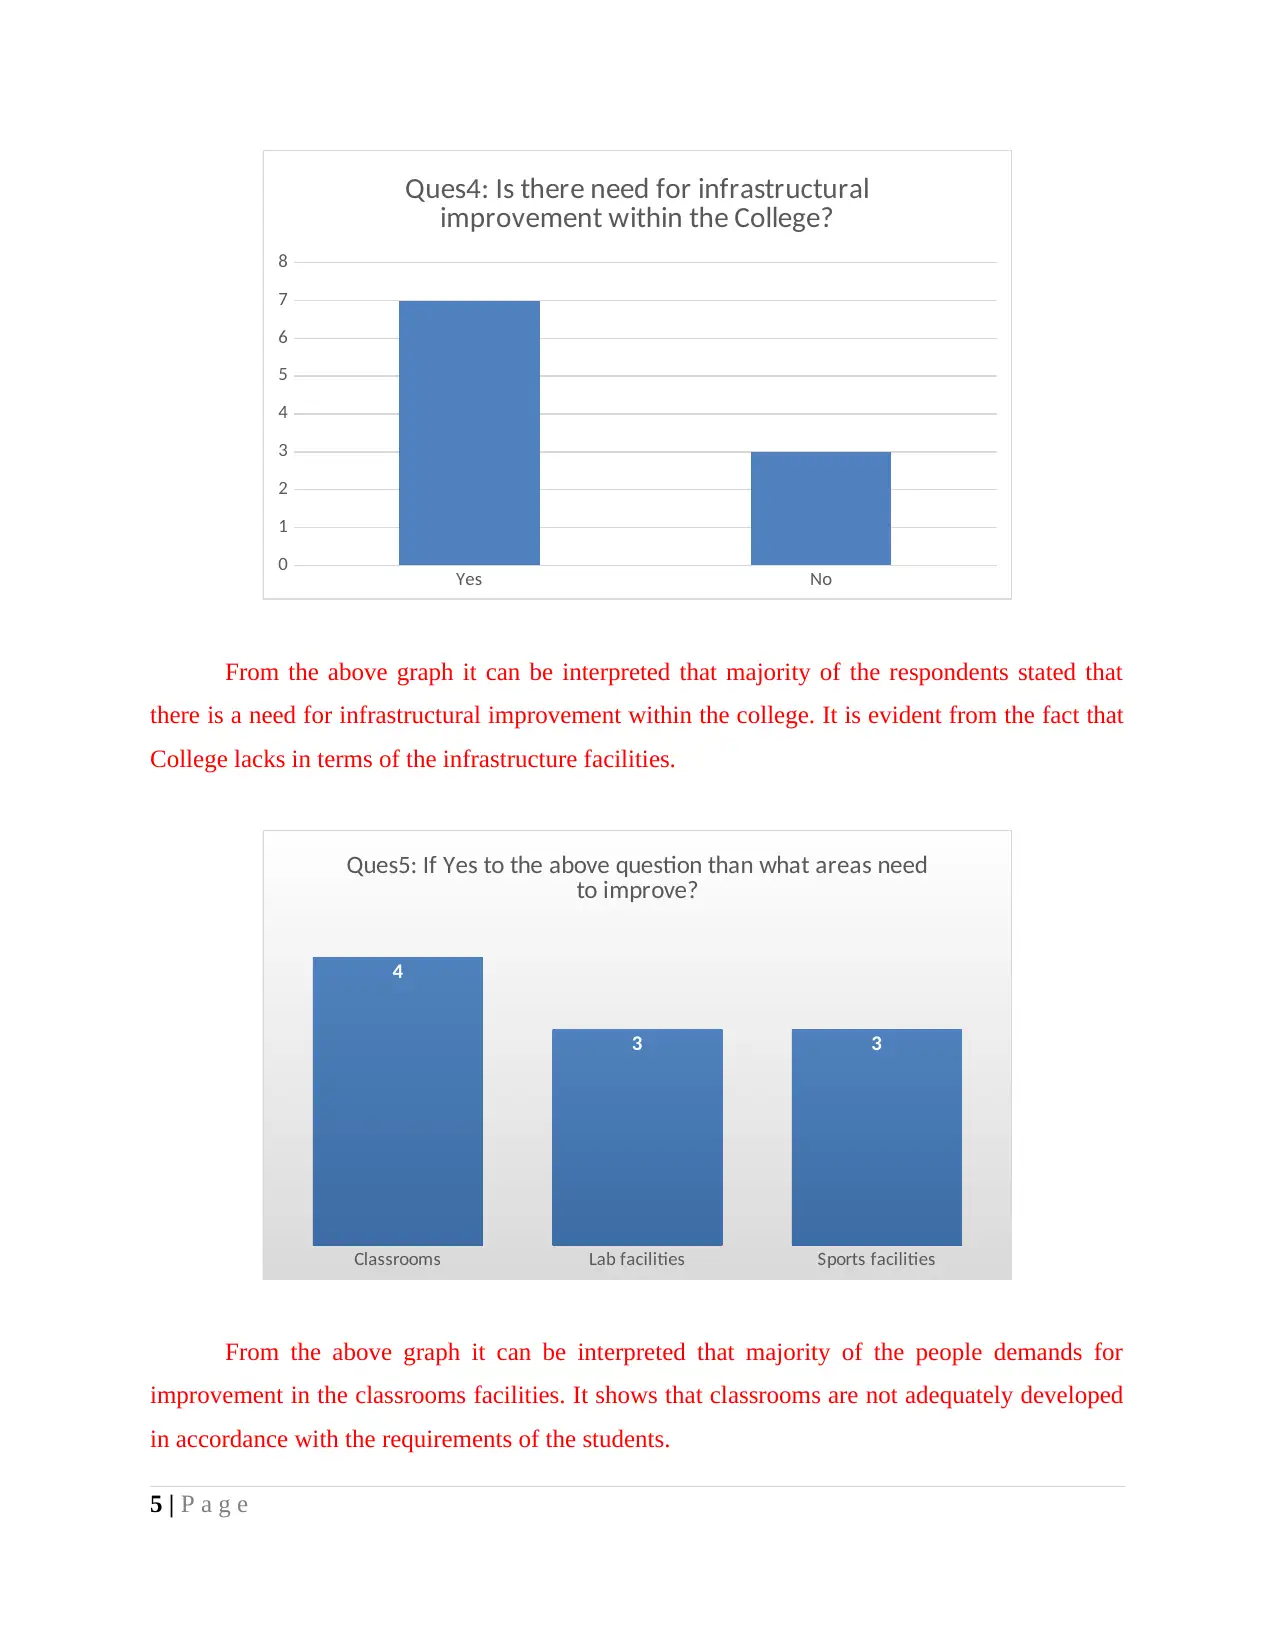
Ques4: Is there need for infrastructural improvement within the College?
Yes
No
Ques5: If Yes to the above question than what areas need to improve?
2 | P a g e
available for the students through the means of which management can easily enhance
their current portfolio as per the purchasing habits of students.
Questionnaire
Questionnaire
Demographic:
Name: _____
Age: _____
Gender: _____
Ques1: For which course are you associated with Local College?
Diplomas
Bachelor degrees
Foundation degrees
Post-graduation degrees
Ques2: Do you agree available courses in College are academically demanding?
Strongly Agree
Agree
Neutral
Disagree
Strongly Disagree
Ques3: According to you, faculty of teaching of Local College is effective?
Strongly Agree
Agree
Neutral
Disagree
Strongly Disagree
Ques4: Is there need for infrastructural improvement within the College?
Yes
No
Ques5: If Yes to the above question than what areas need to improve?
2 | P a g e
Paraphrase This Document
Need a fresh take? Get an instant paraphrase of this document with our AI Paraphraser
Classrooms
Lab facilities
Sports facilities
Ques6: Are there adequate opportunities for student employment?
Yes
No
Ques7: According to you what new courses should be introduced within the education system
of Local College?
_____________________________________________________________________
_____________________________________________________________________
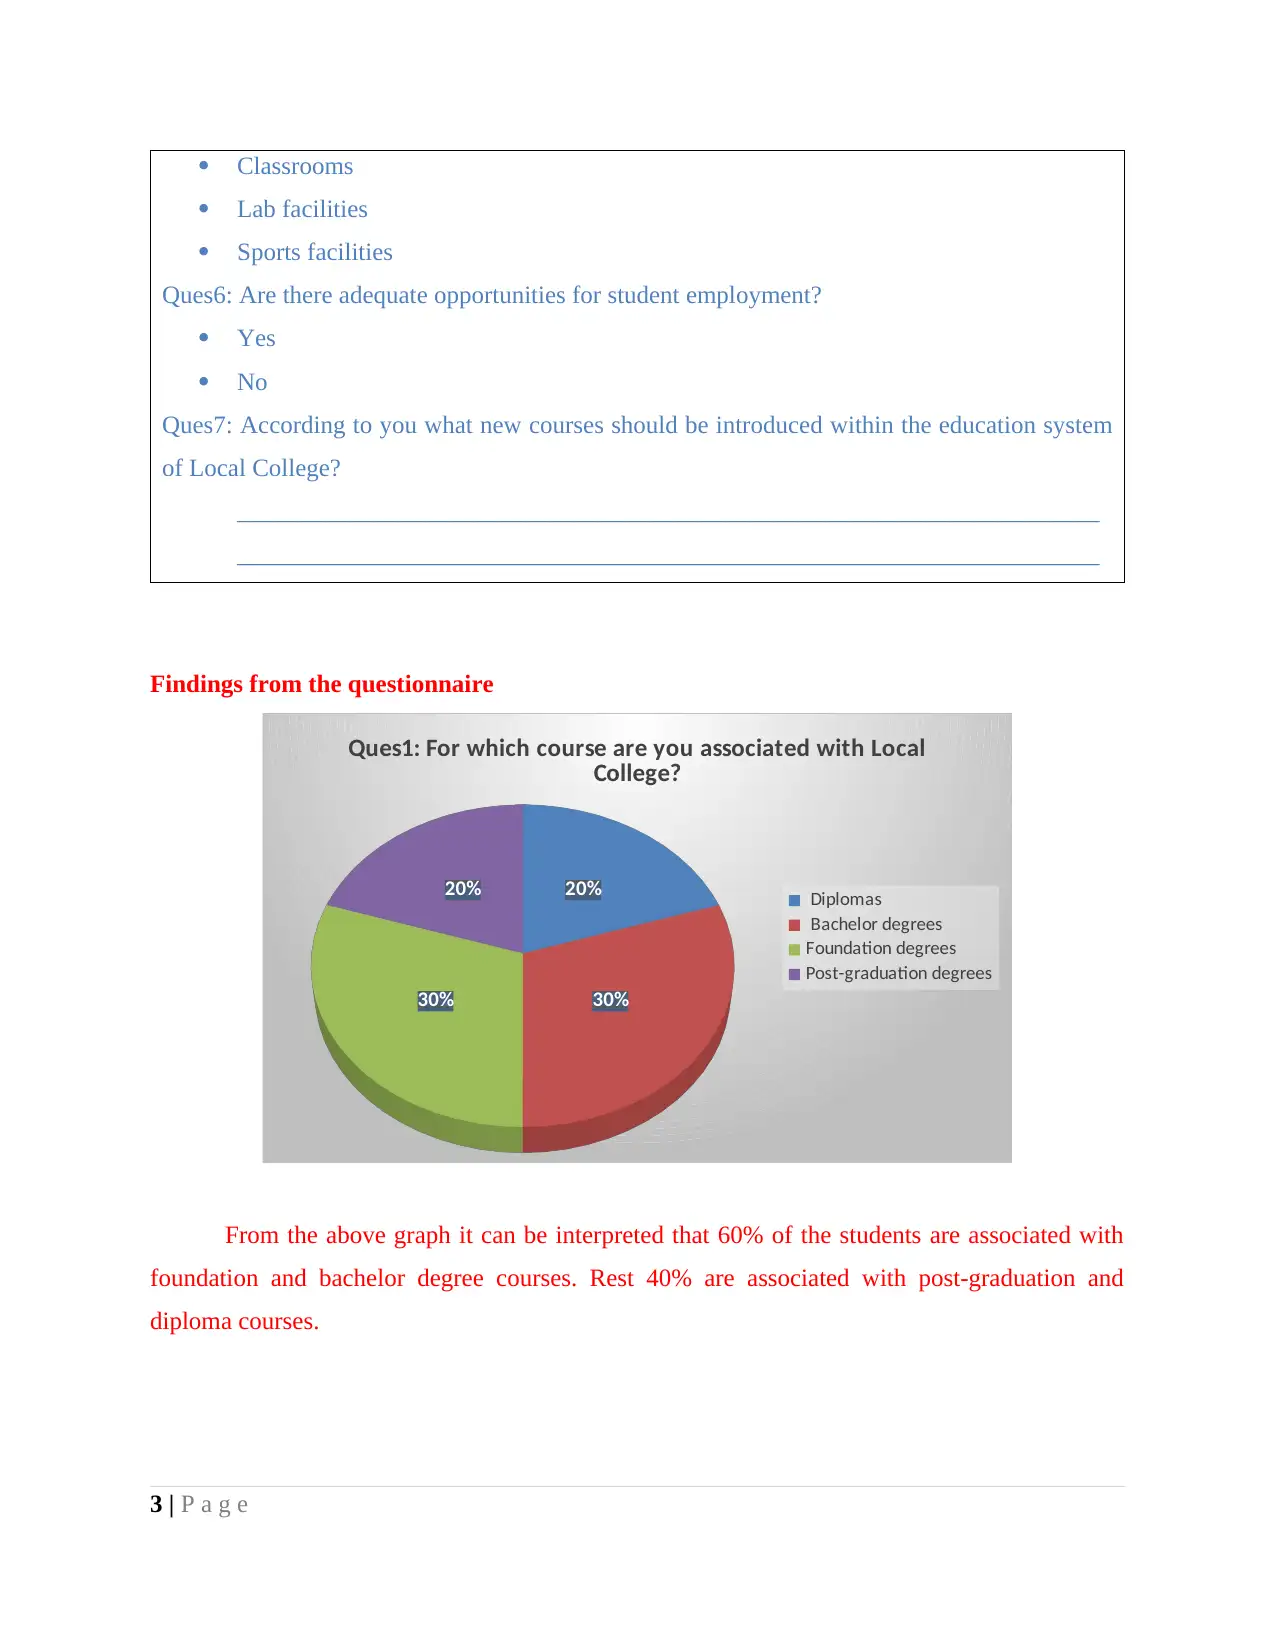
Findings from the questionnaire
20%
30%30%
20%
Ques1: For which course are you associated with Local
College?
Diplomas
Bachelor degrees
Foundation degrees
Post-graduation degrees
From the above graph it can be interpreted that 60% of the students are associated with
foundation and bachelor degree courses. Rest 40% are associated with post-graduation and
diploma courses.
3 | P a g e
Lab facilities
Sports facilities
Ques6: Are there adequate opportunities for student employment?
Yes
No
Ques7: According to you what new courses should be introduced within the education system
of Local College?
_____________________________________________________________________
_____________________________________________________________________
Findings from the questionnaire
20%
30%30%
20%
Ques1: For which course are you associated with Local
College?
Diplomas
Bachelor degrees
Foundation degrees
Post-graduation degrees
From the above graph it can be interpreted that 60% of the students are associated with
foundation and bachelor degree courses. Rest 40% are associated with post-graduation and
diploma courses.
3 | P a g e
30%
20%20%
20%
10%
Ques2: Do you agree available courses in College are
academically demanding?
Strongly Agree
Agree
Neutral
Disagree
Strongly Disagree
From the above graph it can be interpreted that majority of the students agrees that
available courses are academically demanding. It shows that students are highly concerned about
the courses that they wanted to pursue from a specific College.
40%
20%
10%
10%
20%
Ques3: According to you, faculty of teaching of Local
College is effective?
Strongly Agree
Agree
Neutral
Disagree
Strongly Disagree
From the above graph it can be interpreted that majority of the students agree that
teaching of the faculty is very effective. This shows that demand for courses among the students
is high within the College.
4 | P a g e
⊘ This is a preview!⊘
Do you want full access?
Subscribe today to unlock all pages.
Trusted by 1+ million students worldwide
Yes No
0
1
2
3
4
5
6
7
8
Ques4: Is there need for infrastructural
improvement within the College?
From the above graph it can be interpreted that majority of the respondents stated that
there is a need for infrastructural improvement within the college. It is evident from the fact that
College lacks in terms of the infrastructure facilities.
Classrooms Lab facilities Sports facilities
4
3 3
Ques5: If Yes to the above question than what areas need
to improve?
From the above graph it can be interpreted that majority of the people demands for
improvement in the classrooms facilities. It shows that classrooms are not adequately developed
in accordance with the requirements of the students.
5 | P a g e
Paraphrase This Document
Need a fresh take? Get an instant paraphrase of this document with our AI Paraphraser
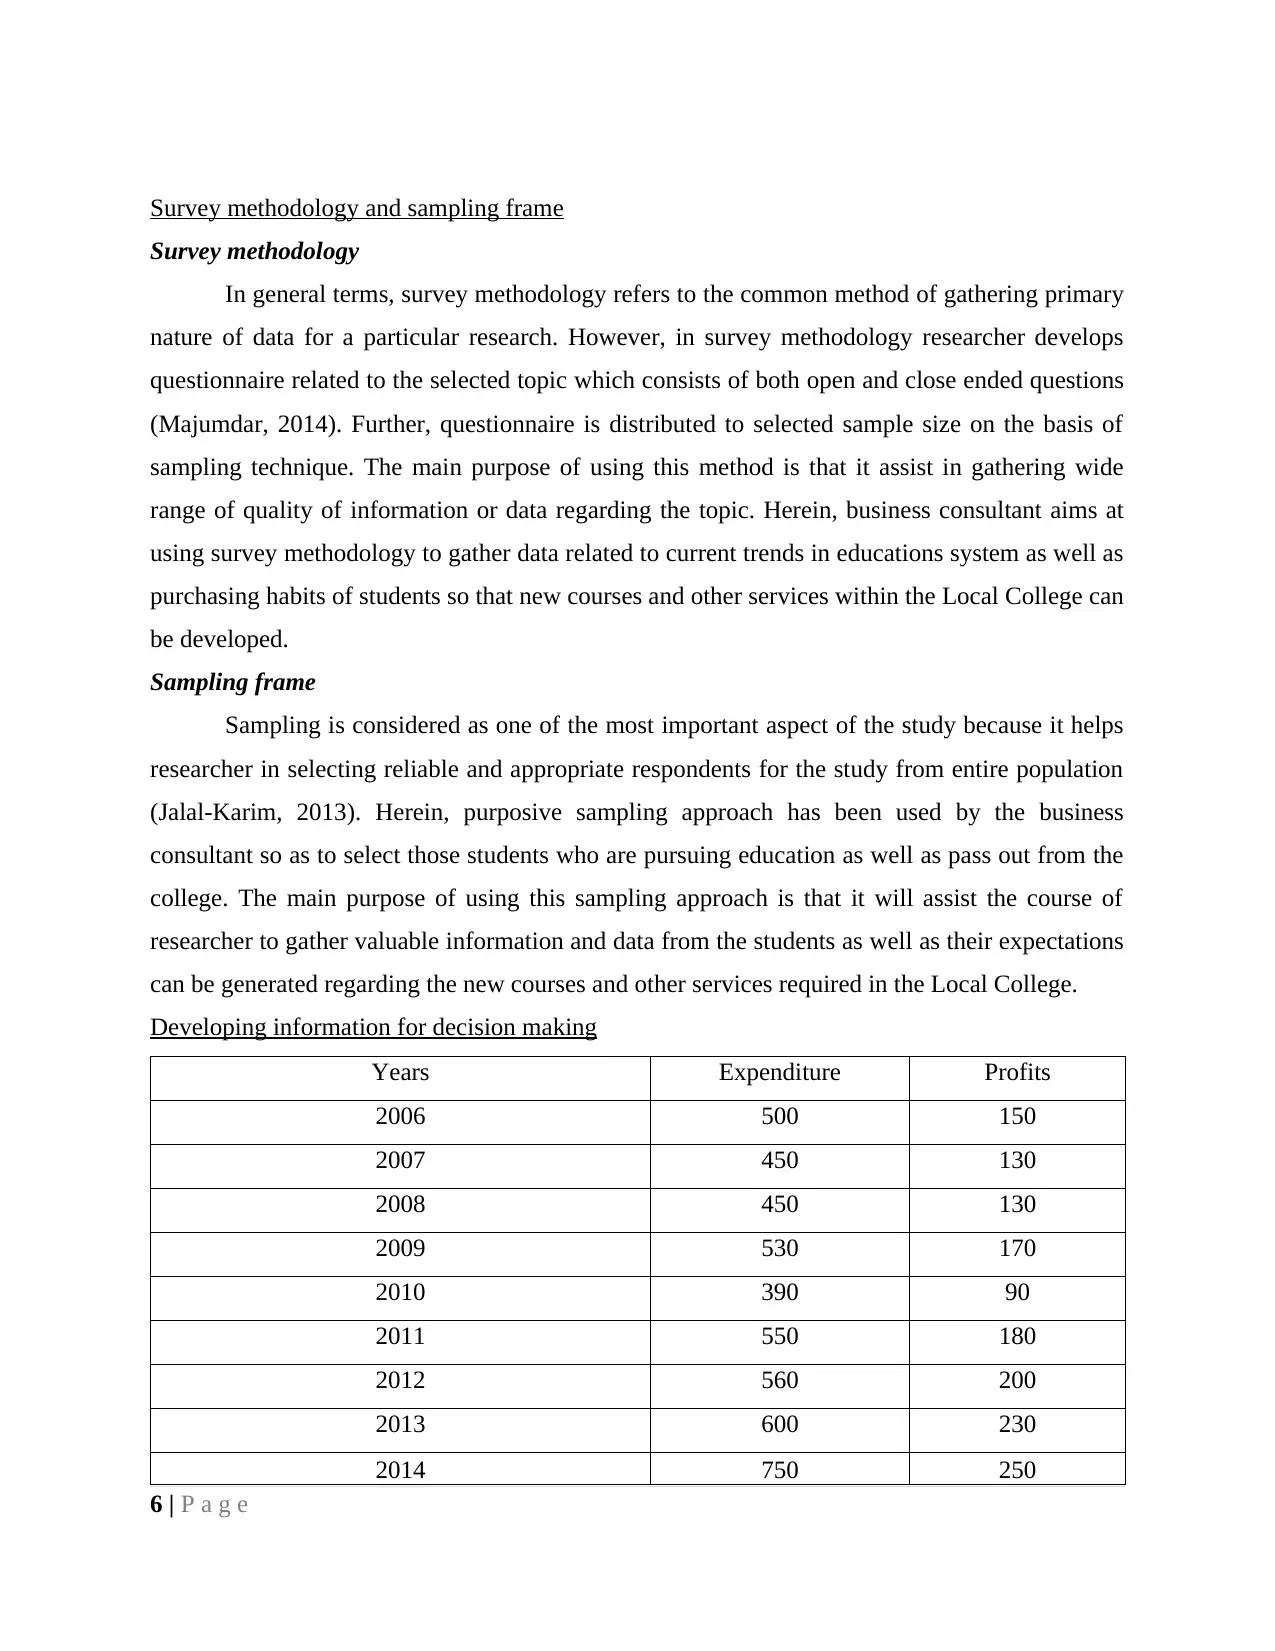
Survey methodology and sampling frame
Survey methodology
In general terms, survey methodology refers to the common method of gathering primary
nature of data for a particular research. However, in survey methodology researcher develops
questionnaire related to the selected topic which consists of both open and close ended questions
(Majumdar, 2014). Further, questionnaire is distributed to selected sample size on the basis of
sampling technique. The main purpose of using this method is that it assist in gathering wide
range of quality of information or data regarding the topic. Herein, business consultant aims at
using survey methodology to gather data related to current trends in educations system as well as
purchasing habits of students so that new courses and other services within the Local College can
be developed.
Sampling frame
Sampling is considered as one of the most important aspect of the study because it helps
researcher in selecting reliable and appropriate respondents for the study from entire population
(Jalal‐Karim, 2013). Herein, purposive sampling approach has been used by the business
consultant so as to select those students who are pursuing education as well as pass out from the
college. The main purpose of using this sampling approach is that it will assist the course of
researcher to gather valuable information and data from the students as well as their expectations
can be generated regarding the new courses and other services required in the Local College.
Developing information for decision making
Years Expenditure Profits
2006 500 150
2007 450 130
2008 450 130
2009 530 170
2010 390 90
2011 550 180
2012 560 200
2013 600 230
2014 750 250
6 | P a g e
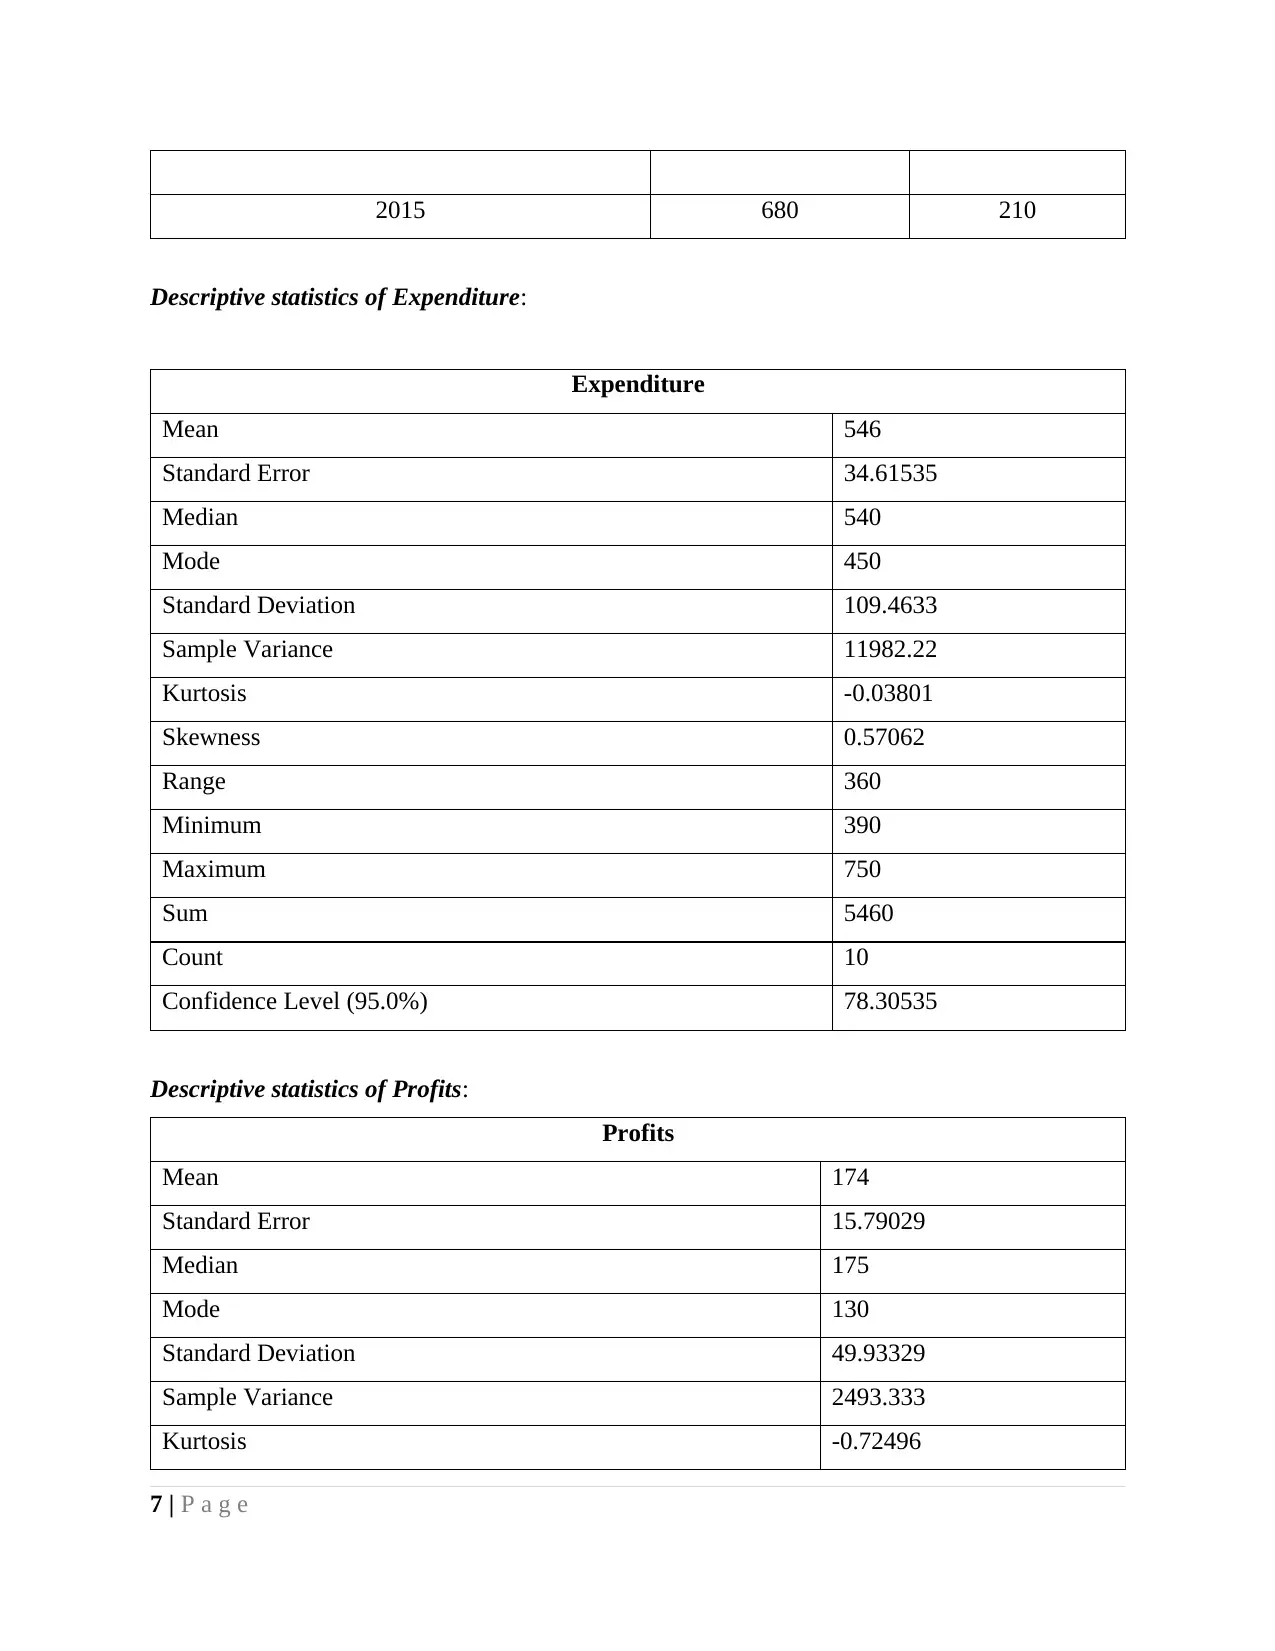
2015 680 210
Descriptive statistics of Expenditure:
Expenditure
Mean 546
Standard Error 34.61535
Median 540
Mode 450
Standard Deviation 109.4633
Sample Variance 11982.22
Kurtosis -0.03801
Skewness 0.57062
Range 360
Minimum 390
Maximum 750
Sum 5460
Count 10
Confidence Level (95.0%) 78.30535
Descriptive statistics of Profits:
Profits
Mean 174
Standard Error 15.79029
Median 175
Mode 130
Standard Deviation 49.93329
Sample Variance 2493.333
Kurtosis -0.72496
7 | P a g e
⊘ This is a preview!⊘
Do you want full access?
Subscribe today to unlock all pages.
Trusted by 1+ million students worldwide

Skewness -0.10924
Range 160
Minimum 90
Maximum 250
Sum 1740
Count 10
Confidence Level (95.0%) 35.72012
Measure of dispersion
Measure of dispersion can be referred as the approach or method for analysing how
spread the given set of information is in the chosen variables (Hyde and Decrop, 2011). There
are various elements of measure of dispersion which are essential for the researcher to analyse
and evaluate. Following are the essential elements of measure of dispersion:
Variance: In general, variance can be defined as the difference between actual and
desired results (Dunne, Flanagan and Buckley, 2011). Further, the main purpose of
computing variance is that it assist in determining the patterns of distribution of the
defined samples. There are three types of variance available within the data i.e. zero,
negative and positive. Zero variance assist in illustrating the homogeneous values (Mele,
2010). On the basis of above study, variance identified in expenditure incurred by the
Local College during the past 10 years and profits generated is 11982.22 and 2493.333
respectively.
Standard deviation: The main aim behind computing standard deviation is that it assist in
identifying and analysing the variations within the given set of information. Looking the
results generated from the data collected it can be said that standard deviation of
expenditure and profit is relatively low i.e. 109.4633 and 49.93329 respectively.
Range: This is another major element of measure of dispersion which assist in
identifying and analysing the difference between highest and lowest value of the defined
population (Kimmel, 2013). Range in general can be determined by deducting minimum
value from the maximum value. Herein, range for the expenditure and profit is 360 and
160 respectively.
8 | P a g e
Paraphrase This Document
Need a fresh take? Get an instant paraphrase of this document with our AI Paraphraser
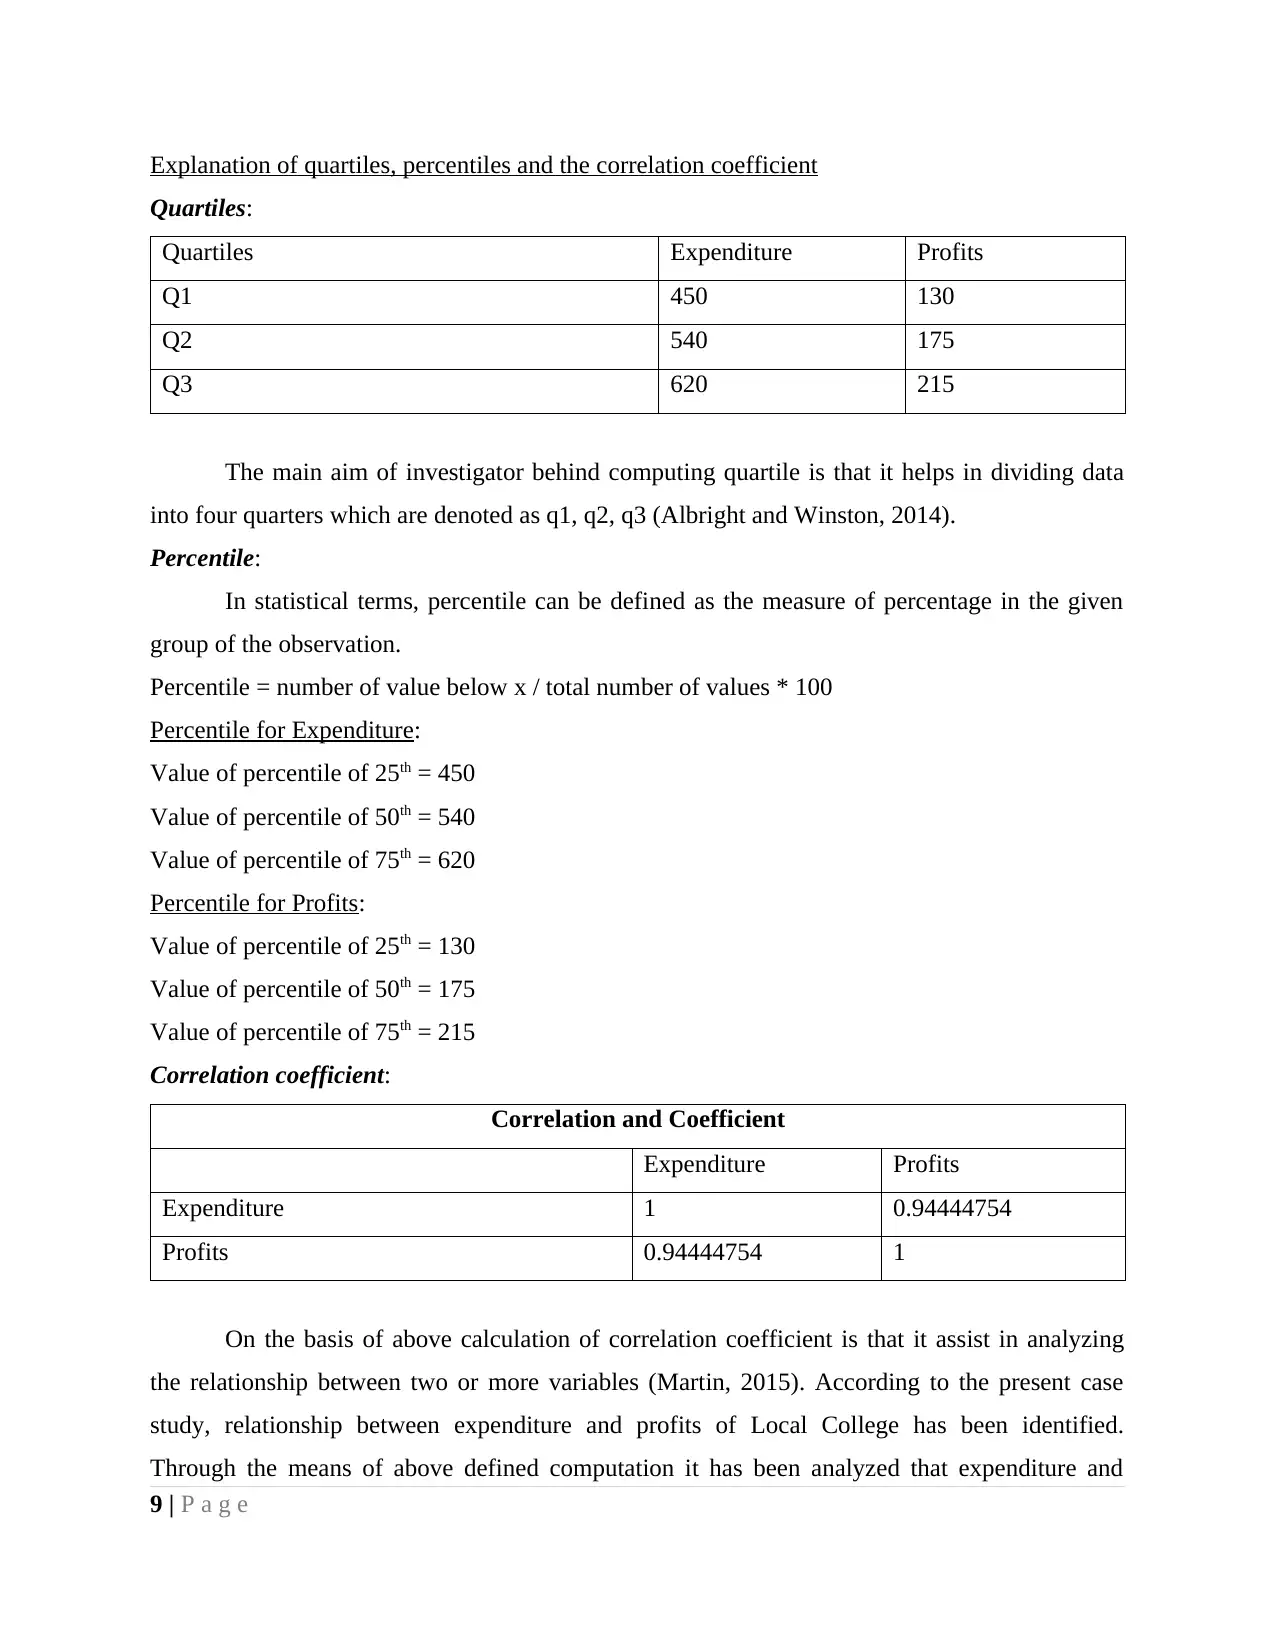
Explanation of quartiles, percentiles and the correlation coefficient
Quartiles:
Quartiles Expenditure Profits
Q1 450 130
Q2 540 175
Q3 620 215
The main aim of investigator behind computing quartile is that it helps in dividing data
into four quarters which are denoted as q1, q2, q3 (Albright and Winston, 2014).
Percentile:
In statistical terms, percentile can be defined as the measure of percentage in the given
group of the observation.
Percentile = number of value below x / total number of values * 100
Percentile for Expenditure:
Value of percentile of 25th = 450
Value of percentile of 50th = 540
Value of percentile of 75th = 620
Percentile for Profits:
Value of percentile of 25th = 130
Value of percentile of 50th = 175
Value of percentile of 75th = 215
Correlation coefficient:
Correlation and Coefficient
Expenditure Profits
Expenditure 1 0.94444754
Profits 0.94444754 1
On the basis of above calculation of correlation coefficient is that it assist in analyzing
the relationship between two or more variables (Martin, 2015). According to the present case
study, relationship between expenditure and profits of Local College has been identified.
Through the means of above defined computation it has been analyzed that expenditure and
9 | P a g e
profits are highly correlated to each other which means expenditure increase, profit decreases
and vice versa.
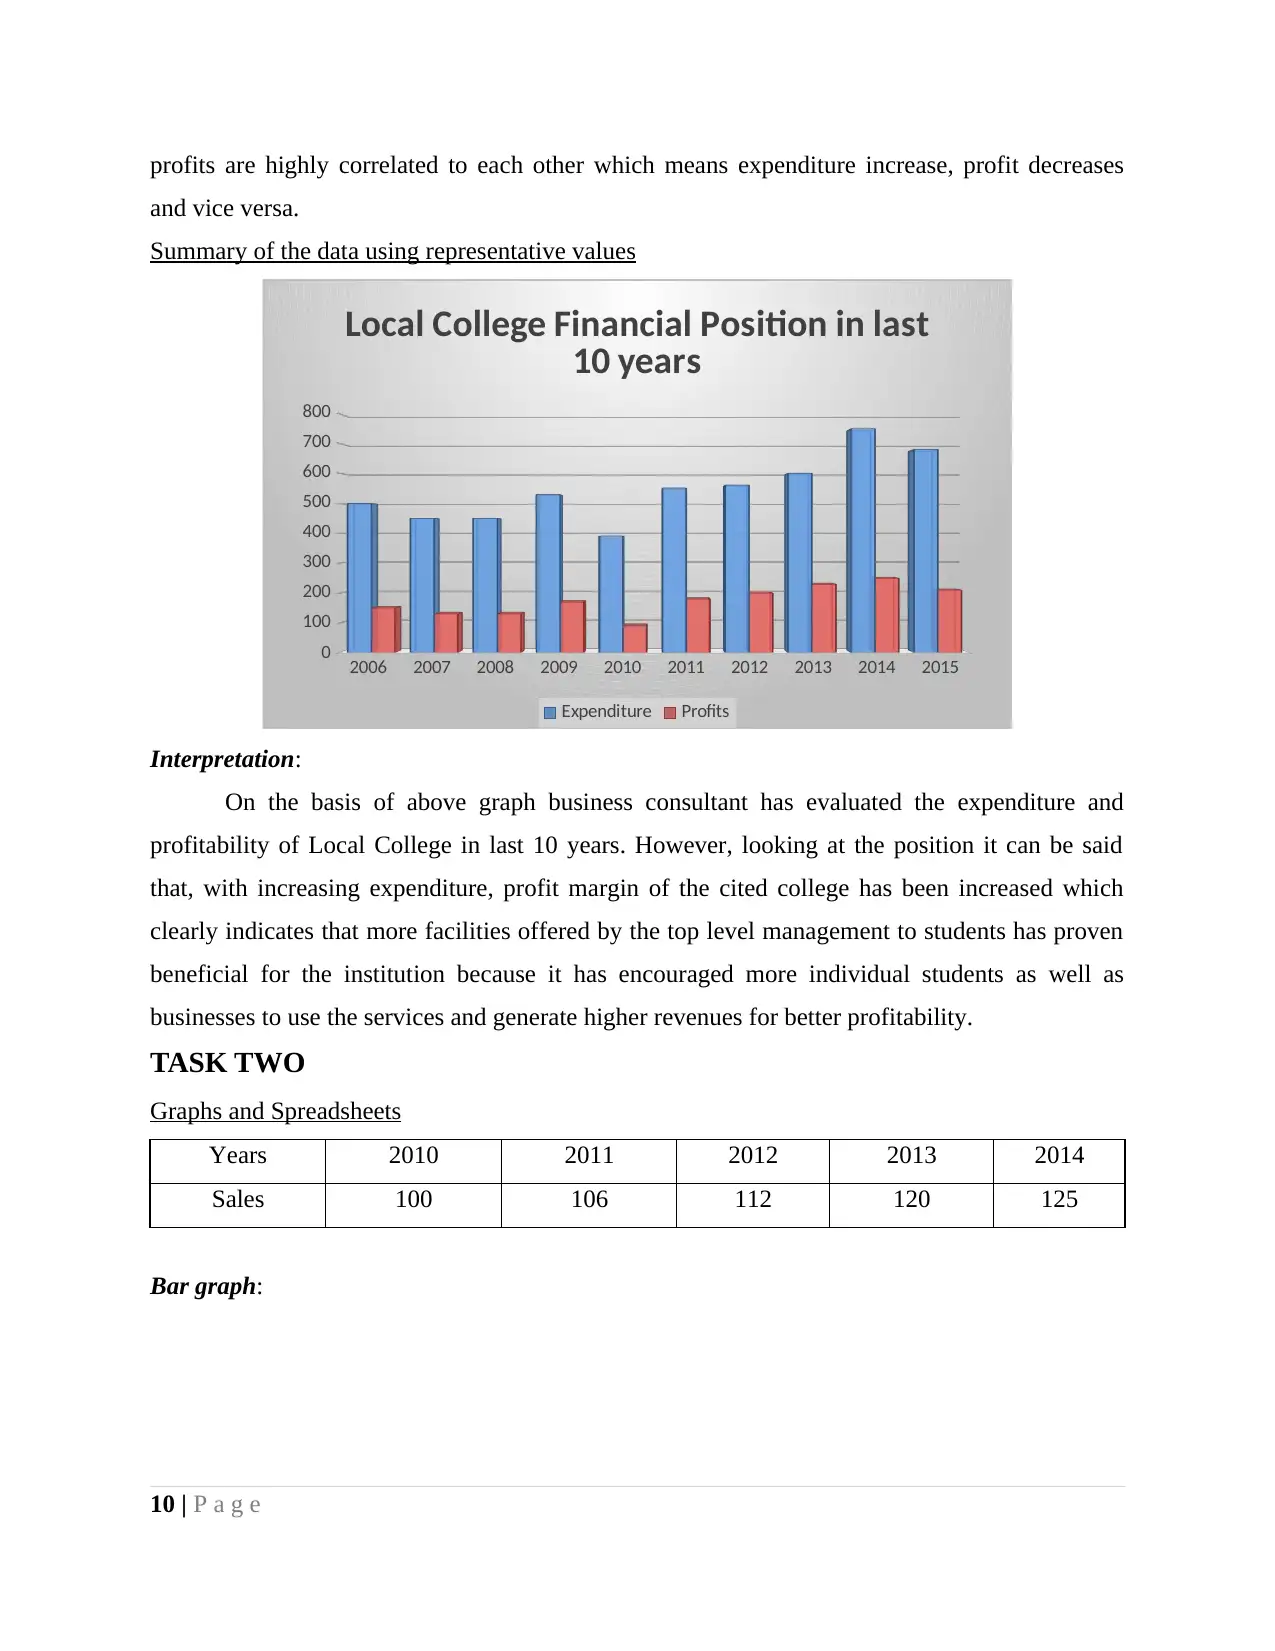
Summary of the data using representative values
2006 2007 2008 2009 2010 2011 2012 2013 2014 2015
0
100
200
300
400
500
600
700
800
Local College Financial Position in last
10 years
Expenditure Profits
Interpretation:
On the basis of above graph business consultant has evaluated the expenditure and
profitability of Local College in last 10 years. However, looking at the position it can be said
that, with increasing expenditure, profit margin of the cited college has been increased which
clearly indicates that more facilities offered by the top level management to students has proven
beneficial for the institution because it has encouraged more individual students as well as
businesses to use the services and generate higher revenues for better profitability.
TASK TWO
Graphs and Spreadsheets
Years 2010 2011 2012 2013 2014
Sales 100 106 112 120 125
Bar graph:
10 | P a g e
and vice versa.
Summary of the data using representative values
2006 2007 2008 2009 2010 2011 2012 2013 2014 2015
0
100
200
300
400
500
600
700
800
Local College Financial Position in last
10 years
Expenditure Profits
Interpretation:
On the basis of above graph business consultant has evaluated the expenditure and
profitability of Local College in last 10 years. However, looking at the position it can be said
that, with increasing expenditure, profit margin of the cited college has been increased which
clearly indicates that more facilities offered by the top level management to students has proven
beneficial for the institution because it has encouraged more individual students as well as
businesses to use the services and generate higher revenues for better profitability.
TASK TWO
Graphs and Spreadsheets
Years 2010 2011 2012 2013 2014
Sales 100 106 112 120 125
Bar graph:
10 | P a g e
⊘ This is a preview!⊘
Do you want full access?
Subscribe today to unlock all pages.
Trusted by 1+ million students worldwide
1 out of 18
Related Documents


Your All-in-One AI-Powered Toolkit for Academic Success.
+13062052269
info@desklib.com
Available 24*7 on WhatsApp / Email
![[object Object]](/_next/static/media/star-bottom.7253800d.svg)
Unlock your academic potential
Copyright © 2020–2026 A2Z Services. All Rights Reserved. Developed and managed by ZUCOL.