Business Modeling Project: Inventory and Decision Analysis
VerifiedAdded on 2022/12/28
|14
|2667
|26
Project
AI Summary
This project delves into various aspects of business modeling to aid decision-making. It begins with an exploration of inventory management using the Economic Order Quantity (EOQ) model, comparing different scenarios and considering the ABC classification system and buffer stock strategies. The project then transitions to non-linear modeling, examining profit maximization through demand, cost, and profit analysis, including the development of profit equations and graphical representations. Finally, it incorporates decision tree analysis to evaluate potential outcomes and make informed choices under uncertainty, including sensitivity analysis. The project offers a comprehensive view of how different modeling techniques can be applied to solve real-world business challenges and make better decisions.
Business Modelling for
decision Making
decision Making
Paraphrase This Document
Need a fresh take? Get an instant paraphrase of this document with our AI Paraphraser
Contents
Contents...........................................................................................................................................2
INTRODUCTION...........................................................................................................................1
Part A – INVENTORY....................................................................................................................1
(a). EOQ for the A545 Plasma TV, (formula ¿ 2 dsh)...................................................................1
(b). Deliveries are required of the plasma TVs each year:..........................................................1
(c). Annual variable cost for TV King Ltd. TVC ¿ Q 2× h+dQ × s............................................2
d)..................................................................................................................................................2
(e).................................................................................................................................................2
Part B – NON-LINEAR/EXTREMUM...........................................................................................4
a) London furniture makers ‘profit equation...............................................................................4
b) Setting up demand, costs and profit table................................................................................4
c) Graph of demand, costs and profitability on the basis of above figures.................................5
d) Finding value of the ‘q’ that maximizes the profit..................................................................5
e) Finding value for the ‘X’ coefficients based on q (Liverpool):...............................................5
f. Strong and weak points in the London and Liverpool models:................................................6
Part C – DECISION TREE..............................................................................................................6
SECTION 1.................................................................................................................................6
i)...................................................................................................................................................6
ii. Decision Tree:.........................................................................................................................8
SECTION 2.................................................................................................................................8
CONCLUSION................................................................................................................................9
REFERENCES..............................................................................................................................10
INTRODUCTION
The term market modelling refers to the profit-making technique of the company. It
specifies the products or services that the business intends continue providing, the defined
market strategy as well as any estimated costs. For both existing and prospective businesses,
market modelling is important. They help new, developing companies, attract investment, recruit
talent, and motivate managers and directors. Using the data structure (worksheet) or business
processes in machine translation, decision products are formulated to expand efficiently while
staying simple to understand at about the same time. Since a study design is quite accurate
compare to decision criteria, when they modify some aspect of the equation, it helps us
understand specifically whatever the effect is. It's where simulation of decisions does have a
distinctive value which easy decision making. Proven businesses should update their strategic
strategies annually or fail to forecast latest opportunities and barriers. Market tactics help
consumers assess organizations that are of importance to them (Cosenz and Noto, 2018). The
research article comprises various elements of business modelling across various tasks such as
EOQ model, Non-linear framework, logistic regression, etc. for judgment frameworks.
Part A – INVENTORY
(a). EOQ for the A545 Plasma TV, (formula¿ √ 2 ds
h )
d = 900 TVs plasma,
c = Actual cost of assigning each order = £120
h = cost of holding stock = £20
EOQ = √ [(2 x 900 x £120) / £20] = 104 Units
(b). Deliveries are required of the plasma TVs each year:
Deliverables number = Annual Demand ÷ Order Quantity
900 ÷ 104= 8.65
9 (approx.)
Total frequencies of deliveries will take place?
Delivery Frequency =
No of Days company Open ÷ No of Deliveries = 52 x (7 – 1) ÷ 9 = 34.67
Every 35 days = delivery frequency
1
⊘ This is a preview!⊘
Do you want full access?
Subscribe today to unlock all pages.
Trusted by 1+ million students worldwide
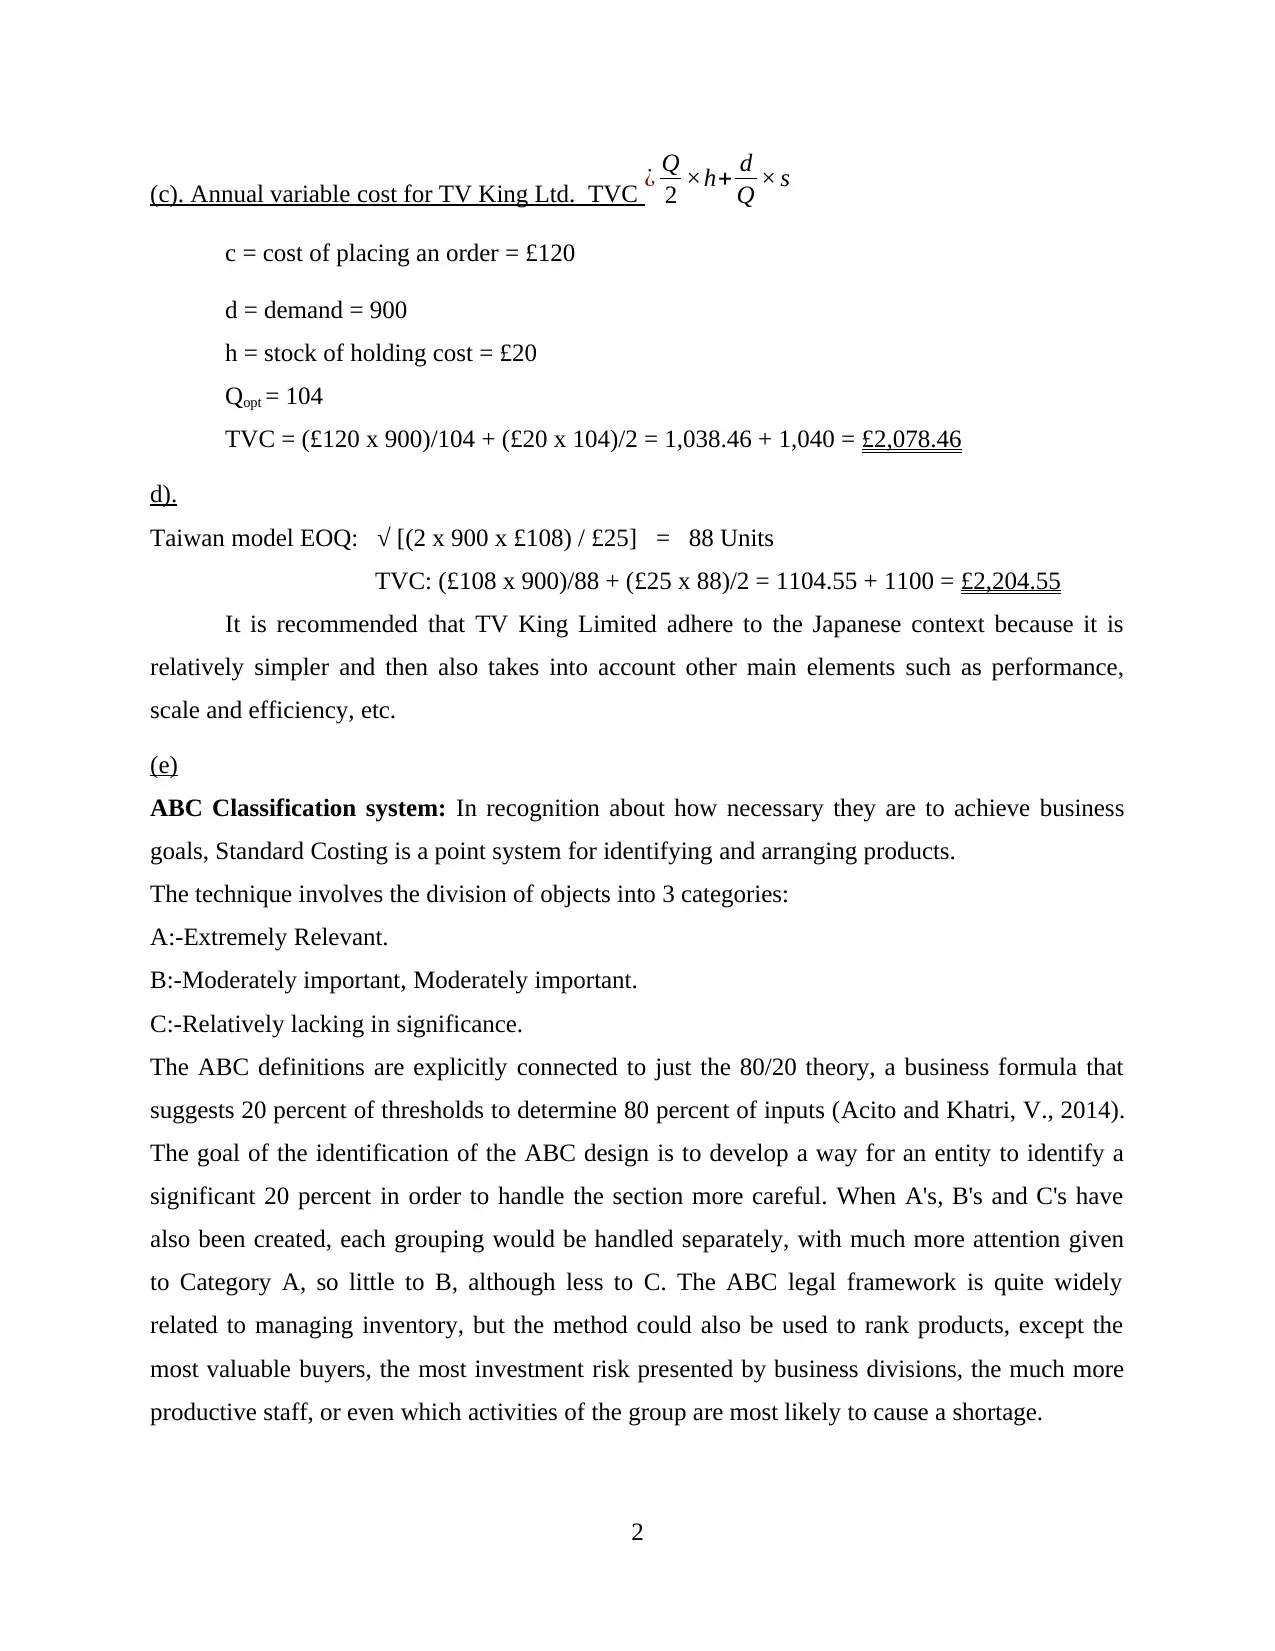
(c). Annual variable cost for TV King Ltd. TVC ¿ Q
2 ×h+ d
Q × s
c = cost of placing an order = £120
d = demand = 900
h = stock of holding cost = £20
Qopt = 104
TVC = (£120 x 900)/104 + (£20 x 104)/2 = 1,038.46 + 1,040 = £2,078.46
d).
Taiwan model EOQ: √ [(2 x 900 x £108) / £25] = 88 Units
TVC: (£108 x 900)/88 + (£25 x 88)/2 = 1104.55 + 1100 = £2,204.55
It is recommended that TV King Limited adhere to the Japanese context because it is
relatively simpler and then also takes into account other main elements such as performance,
scale and efficiency, etc.
(e)
ABC Classification system: In recognition about how necessary they are to achieve business
goals, Standard Costing is a point system for identifying and arranging products.
The technique involves the division of objects into 3 categories:
A:-Extremely Relevant.
B:-Moderately important, Moderately important.
C:-Relatively lacking in significance.
The ABC definitions are explicitly connected to just the 80/20 theory, a business formula that
suggests 20 percent of thresholds to determine 80 percent of inputs (Acito and Khatri, V., 2014).
The goal of the identification of the ABC design is to develop a way for an entity to identify a
significant 20 percent in order to handle the section more careful. When A's, B's and C's have
also been created, each grouping would be handled separately, with much more attention given
to Category A, so little to B, although less to C. The ABC legal framework is quite widely
related to managing inventory, but the method could also be used to rank products, except the
most valuable buyers, the most investment risk presented by business divisions, the much more
productive staff, or even which activities of the group are most likely to cause a shortage.
2
Paraphrase This Document
Need a fresh take? Get an instant paraphrase of this document with our AI Paraphraser
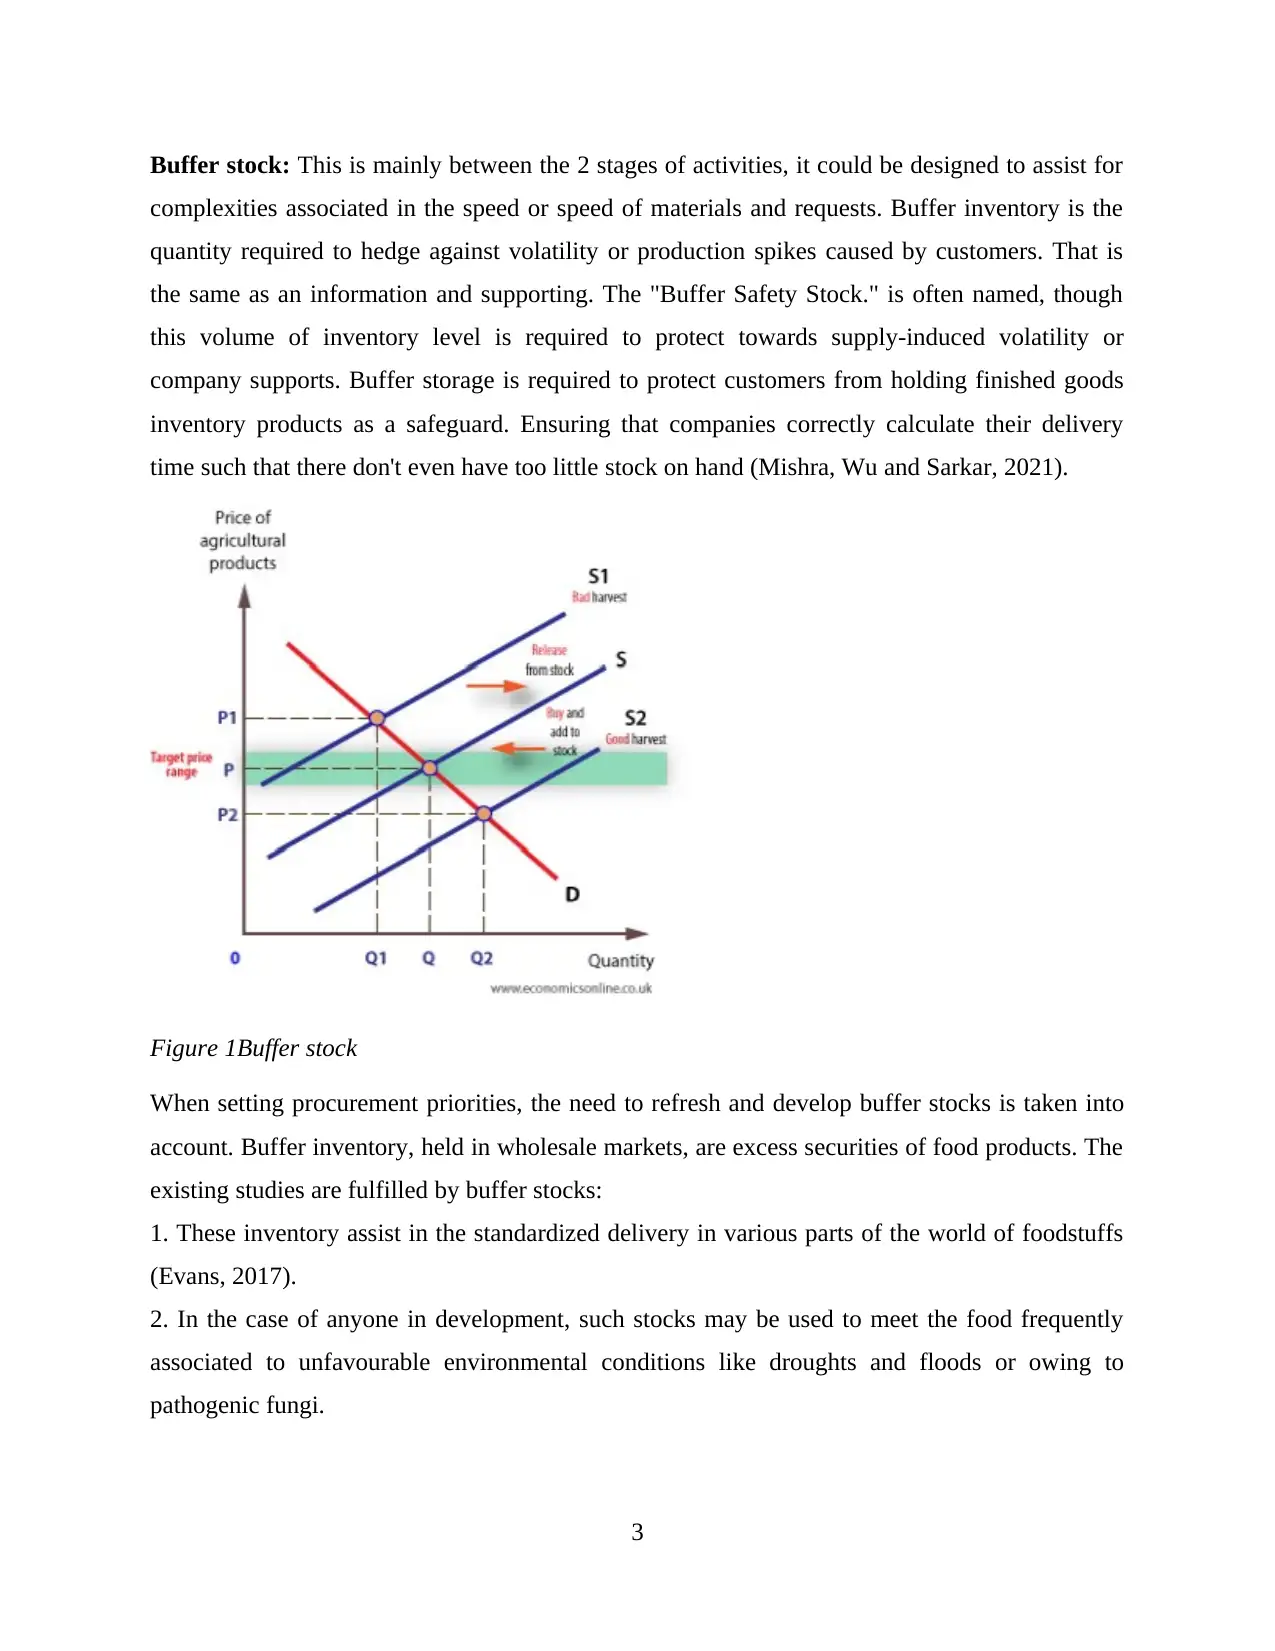
Buffer stock: This is mainly between the 2 stages of activities, it could be designed to assist for
complexities associated in the speed or speed of materials and requests. Buffer inventory is the
quantity required to hedge against volatility or production spikes caused by customers. That is
the same as an information and supporting. The "Buffer Safety Stock." is often named, though
this volume of inventory level is required to protect towards supply-induced volatility or
company supports. Buffer storage is required to protect customers from holding finished goods
inventory products as a safeguard. Ensuring that companies correctly calculate their delivery
time such that there don't even have too little stock on hand (Mishra, Wu and Sarkar, 2021).
Figure 1Buffer stock
When setting procurement priorities, the need to refresh and develop buffer stocks is taken into
account. Buffer inventory, held in wholesale markets, are excess securities of food products. The
existing studies are fulfilled by buffer stocks:
1. These inventory assist in the standardized delivery in various parts of the world of foodstuffs
(Evans, 2017).
2. In the case of anyone in development, such stocks may be used to meet the food frequently
associated to unfavourable environmental conditions like droughts and floods or owing to
pathogenic fungi.
3
Pipeline inventory: That really is the inventory seen when the item is received between stages
to cover the lack of supply. Pipeline inventory refers to current assets goods who haven't yet
entered their final destination throughout the company's shipping network. Such goods are
assumed to be part of the shipping company inventory during their transportation until items are
paid by the recipient (Lou, 2017). Alternatively, even if the consumer has not yet technically
obtained them, when a recipient invoice for the products pipeline inventory would be included in
the supplier databases. Before being a final result for the consumer to shop, value goes to many
different locations. Products can arrive from many multiple nations; one part may have occurred
in China, for instance, and also another element of the item could arrive through Nepal. As this
stays throughout the pipeline mostly on journey towards the next location, the commodity that
travels from one location to the another like it is often called pipeline inventory. It could be on
the way to a supplier from some kind of big distributor where this would be transformed through
a finished product, or it could be on the journey from the manufacturer to the local store.
Inventory system: There is a series of laws and regulations that decide and monitor the volume
of stocks when product needs to be refilled, and also the quantity of inventory that might actually
be bought. The inventory system applies to processes involving the procurement, storage and
profitability of products from manufacturer to customer across the supply chain. That looks easy,
but in terms of maintaining an organized and efficient inventory, there are many other important
daily operations. A balanced compromise between all the mechanical parts of the storage device
cannot be achieved. Efforts to combat numbers like this requires another well strategy and
system structure for the inventory management system. Depending on the organization, the
goods they involve, the regulations they really have to follow, and the size of their operation, it
will take many procedures and mechanisms to keep things running (Samara, 2017).
Part B – NON-LINEAR/EXTREMUM
a) London furniture makers ‘profit equation
Demand: 200-15q
Revenue: 200q - 15q2(demand * q2)
Total cost: 120- 8q+12q2
Profit: 200q-15q2 – 120+ 8q-12q2
-27q2+208q-120
4
⊘ This is a preview!⊘
Do you want full access?
Subscribe today to unlock all pages.
Trusted by 1+ million students worldwide
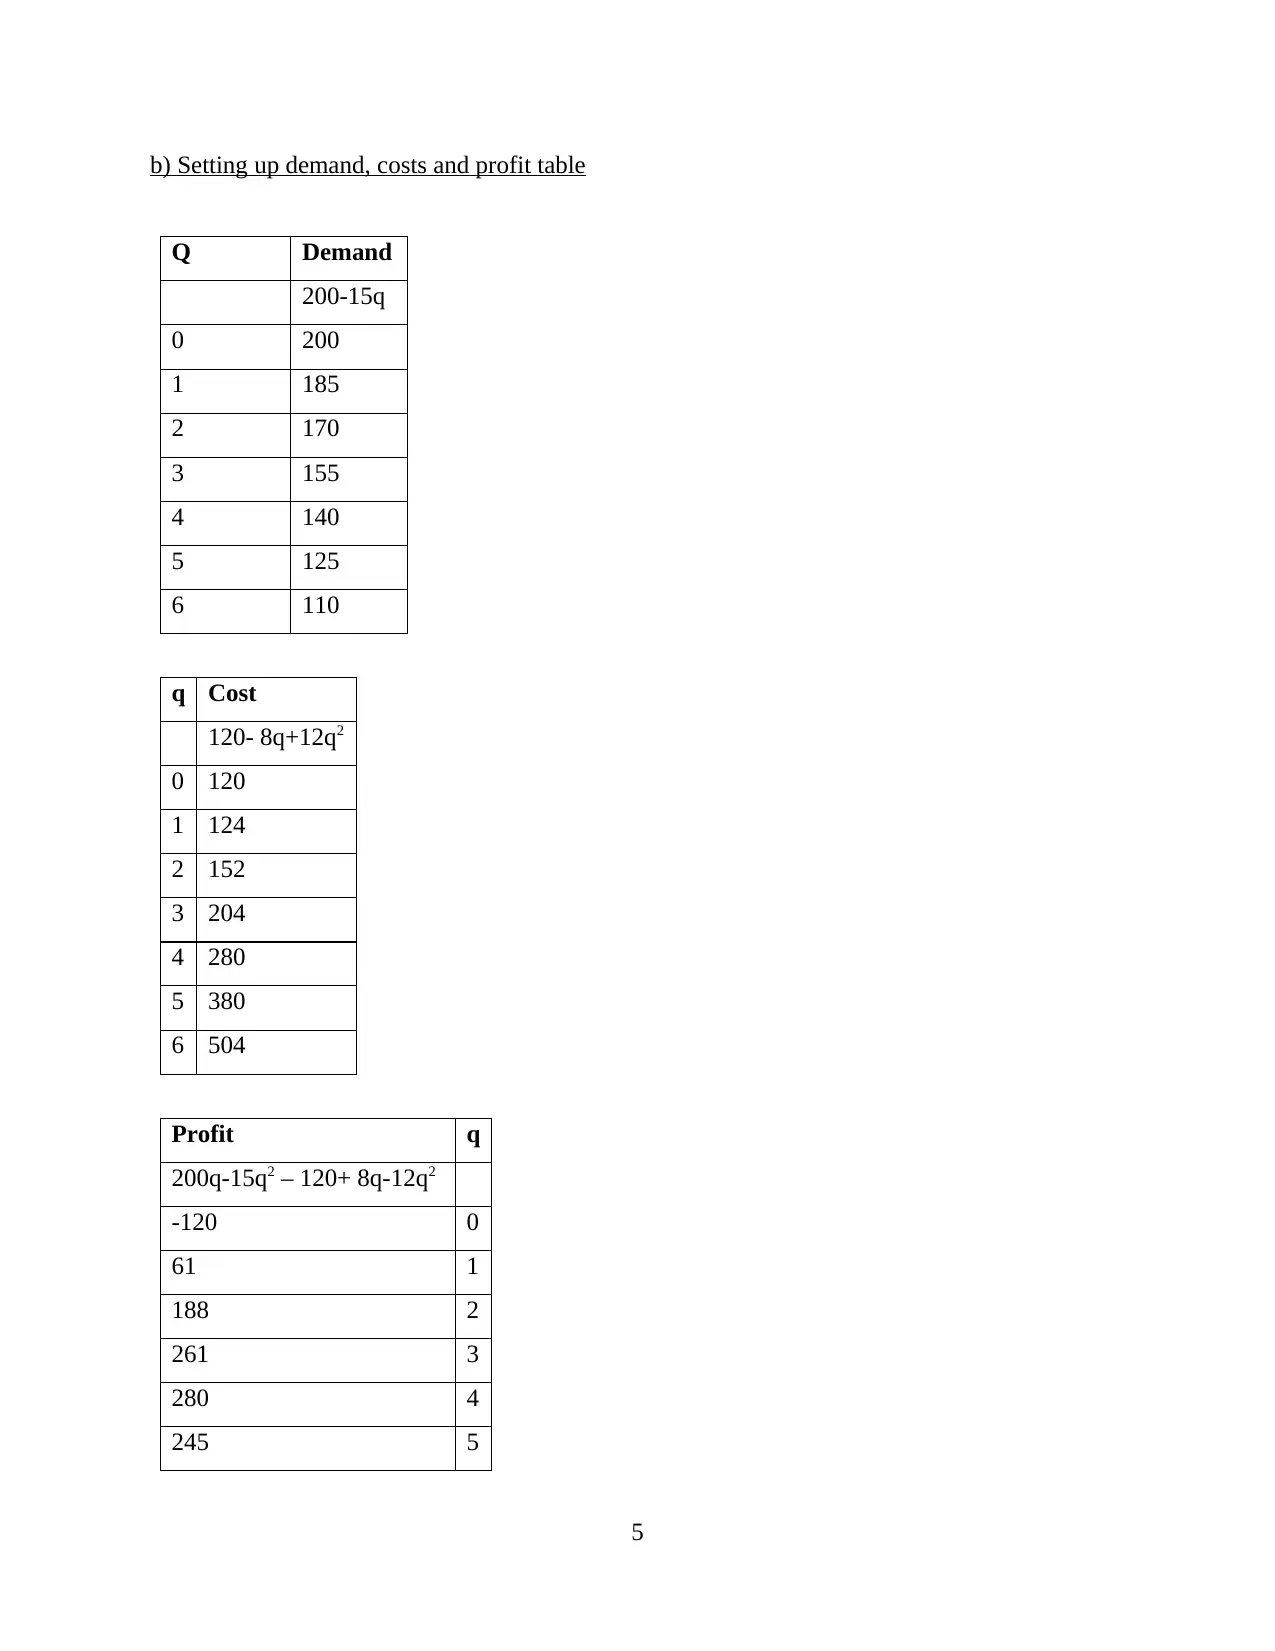
b) Setting up demand, costs and profit table
Q Demand
200-15q
0 200
1 185
2 170
3 155
4 140
5 125
6 110
q Cost
120- 8q+12q2
0 120
1 124
2 152
3 204
4 280
5 380
6 504
Profit q
200q-15q2 – 120+ 8q-12q2
-120 0
61 1
188 2
261 3
280 4
245 5
5
Q Demand
200-15q
0 200
1 185
2 170
3 155
4 140
5 125
6 110
q Cost
120- 8q+12q2
0 120
1 124
2 152
3 204
4 280
5 380
6 504
Profit q
200q-15q2 – 120+ 8q-12q2
-120 0
61 1
188 2
261 3
280 4
245 5
5
Paraphrase This Document
Need a fresh take? Get an instant paraphrase of this document with our AI Paraphraser
156 6
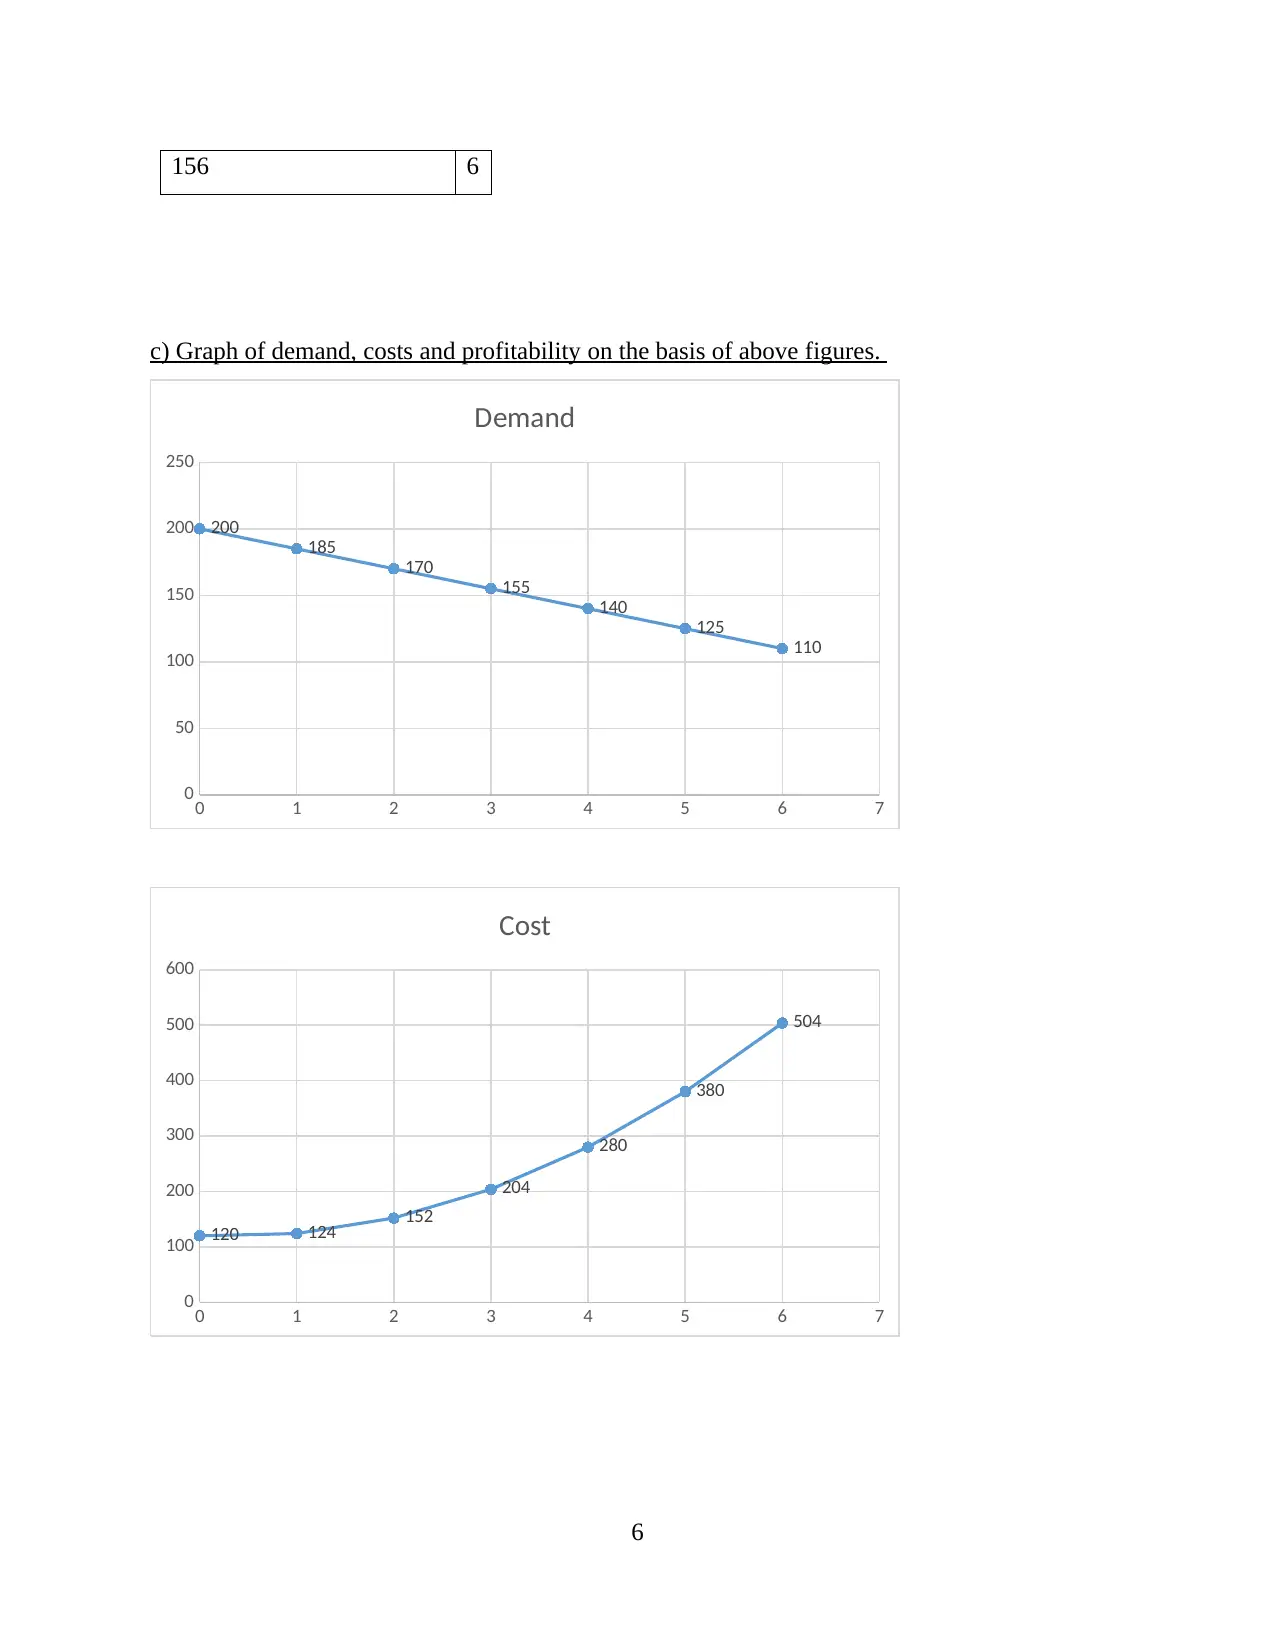
c) Graph of demand, costs and profitability on the basis of above figures.
0 1 2 3 4 5 6 7
0
50
100
150
200
250
200
185
170
155
140
125
110
Demand
0 1 2 3 4 5 6 7
0
100
200
300
400
500
600
120 124 152
204
280
380
504
Cost
6
c) Graph of demand, costs and profitability on the basis of above figures.
0 1 2 3 4 5 6 7
0
50
100
150
200
250
200
185
170
155
140
125
110
Demand
0 1 2 3 4 5 6 7
0
100
200
300
400
500
600
120 124 152
204
280
380
504
Cost
6
0 1 2 3 4 5 6 7
-150
-100
-50
0
50
100
150
200
250
300
350
-120
61
188
261 280
245
156
Profit
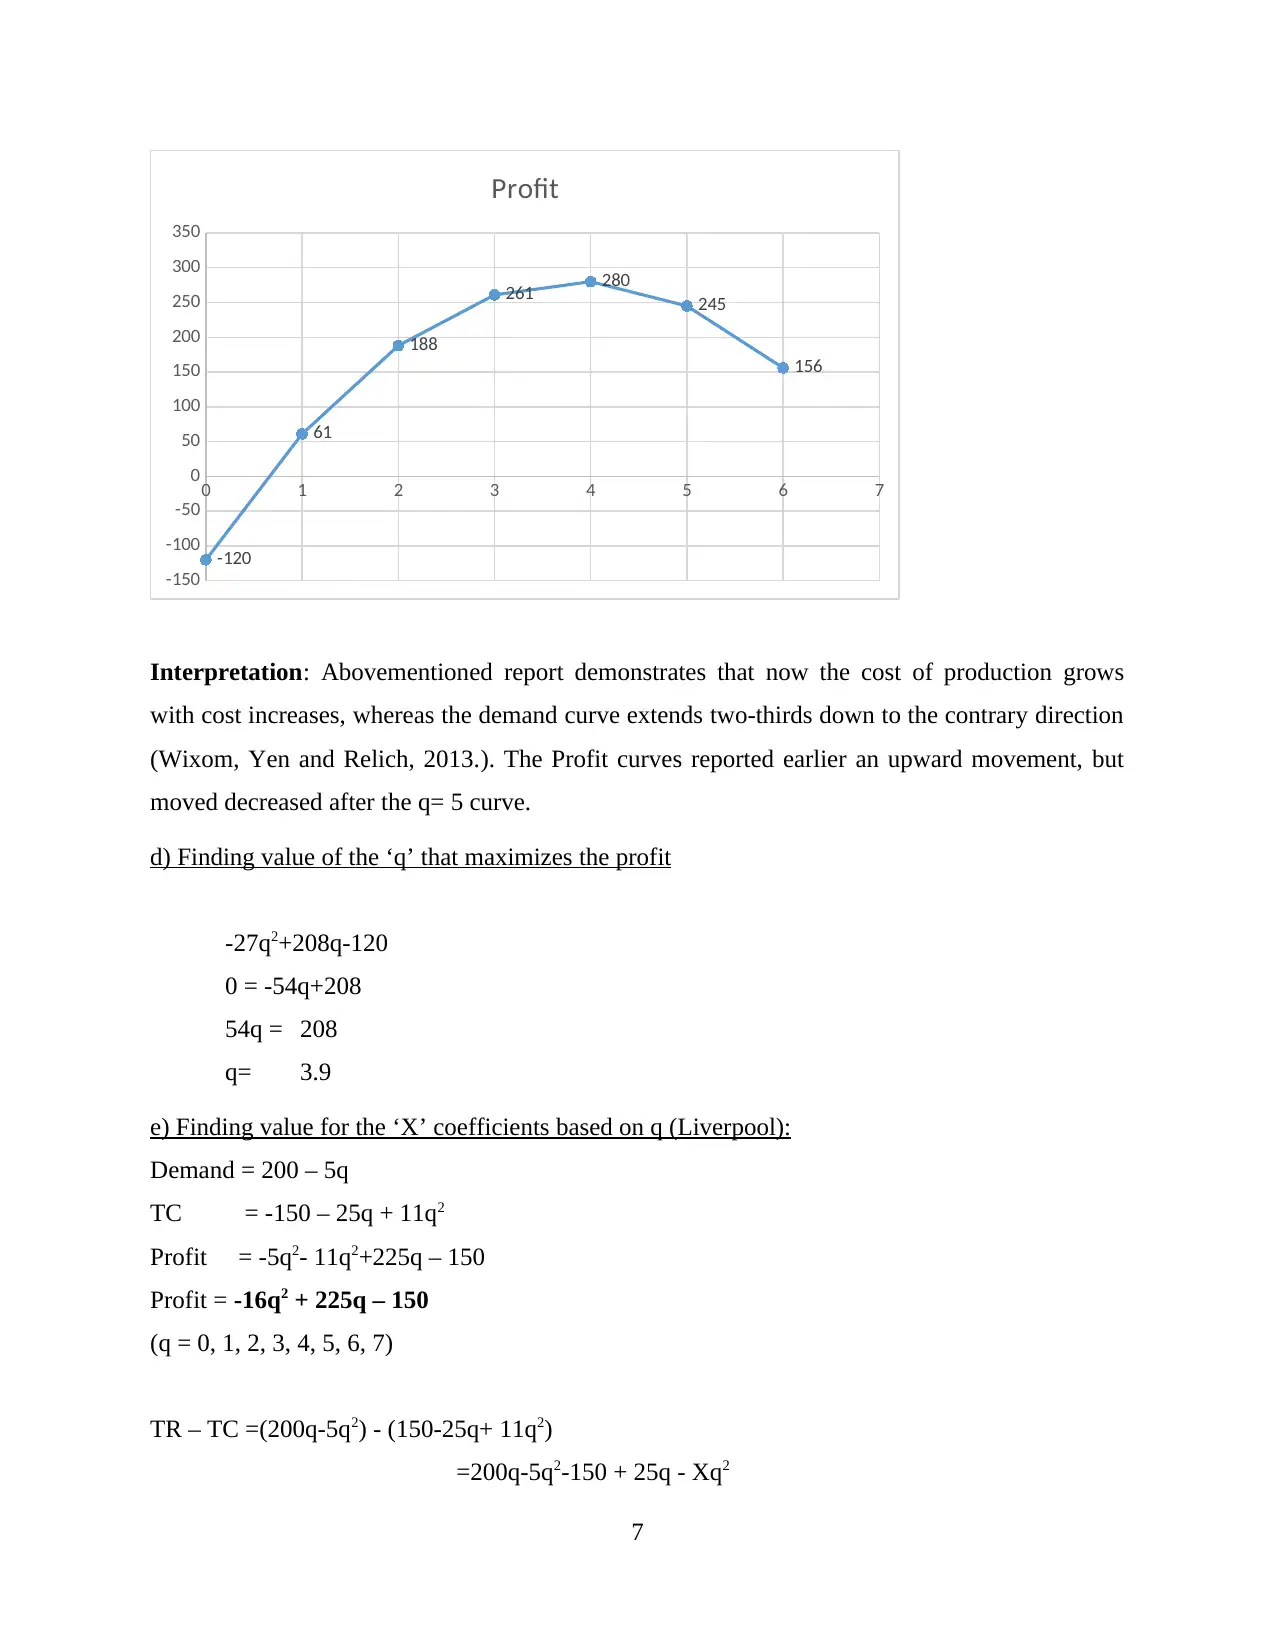
Interpretation: Abovementioned report demonstrates that now the cost of production grows
with cost increases, whereas the demand curve extends two-thirds down to the contrary direction
(Wixom, Yen and Relich, 2013.). The Profit curves reported earlier an upward movement, but
moved decreased after the q= 5 curve.
d) Finding value of the ‘q’ that maximizes the profit
-27q2+208q-120
0 = -54q+208
54q = 208
q= 3.9
e) Finding value for the ‘X’ coefficients based on q (Liverpool):
Demand = 200 – 5q
TC = -150 – 25q + 11q2
Profit = -5q2- 11q2+225q – 150
Profit = -16q2 + 225q – 150
(q = 0, 1, 2, 3, 4, 5, 6, 7)
TR – TC =(200q-5q2) - (150-25q+ 11q2)
=200q-5q2-150 + 25q - Xq2
7
-150
-100
-50
0
50
100
150
200
250
300
350
-120
61
188
261 280
245
156
Profit
Interpretation: Abovementioned report demonstrates that now the cost of production grows
with cost increases, whereas the demand curve extends two-thirds down to the contrary direction
(Wixom, Yen and Relich, 2013.). The Profit curves reported earlier an upward movement, but
moved decreased after the q= 5 curve.
d) Finding value of the ‘q’ that maximizes the profit
-27q2+208q-120
0 = -54q+208
54q = 208
q= 3.9
e) Finding value for the ‘X’ coefficients based on q (Liverpool):
Demand = 200 – 5q
TC = -150 – 25q + 11q2
Profit = -5q2- 11q2+225q – 150
Profit = -16q2 + 225q – 150
(q = 0, 1, 2, 3, 4, 5, 6, 7)
TR – TC =(200q-5q2) - (150-25q+ 11q2)
=200q-5q2-150 + 25q - Xq2
7
⊘ This is a preview!⊘
Do you want full access?
Subscribe today to unlock all pages.
Trusted by 1+ million students worldwide
TR – TC =(200q-5q2) - (150-25q+Xq2)
=200q-5q2-150 + 25q - Xq2
= -5q2-Xq2+225q – 150
DERIV: 0 =-10q-2Xq+225
0 = (-10* 5.9) - (2*X*5.9) +225
0 =166 - 11.8X
11.8X = 166
X = 14.1
f. Strong and weak points in the London and Liverpool models:
This was evaluated on the basis of the above estimation method that such a template is
effective because there are certain powerful and also negative spots. A strong point of this
template was that this template can produce profit, even when prices were lower. The net
earnings are also not impacted by growing costs. Although there is a major weakness throughout
this design, this framework has lower revenue and sometimes even expenses as demand grows.
Some other major weakness of this template would be that profit would decrease or losses may
occur as costs decreases or maximize (Duan and Xiong, 2015).
Part C – DECISION TREE
SECTION 1
i).
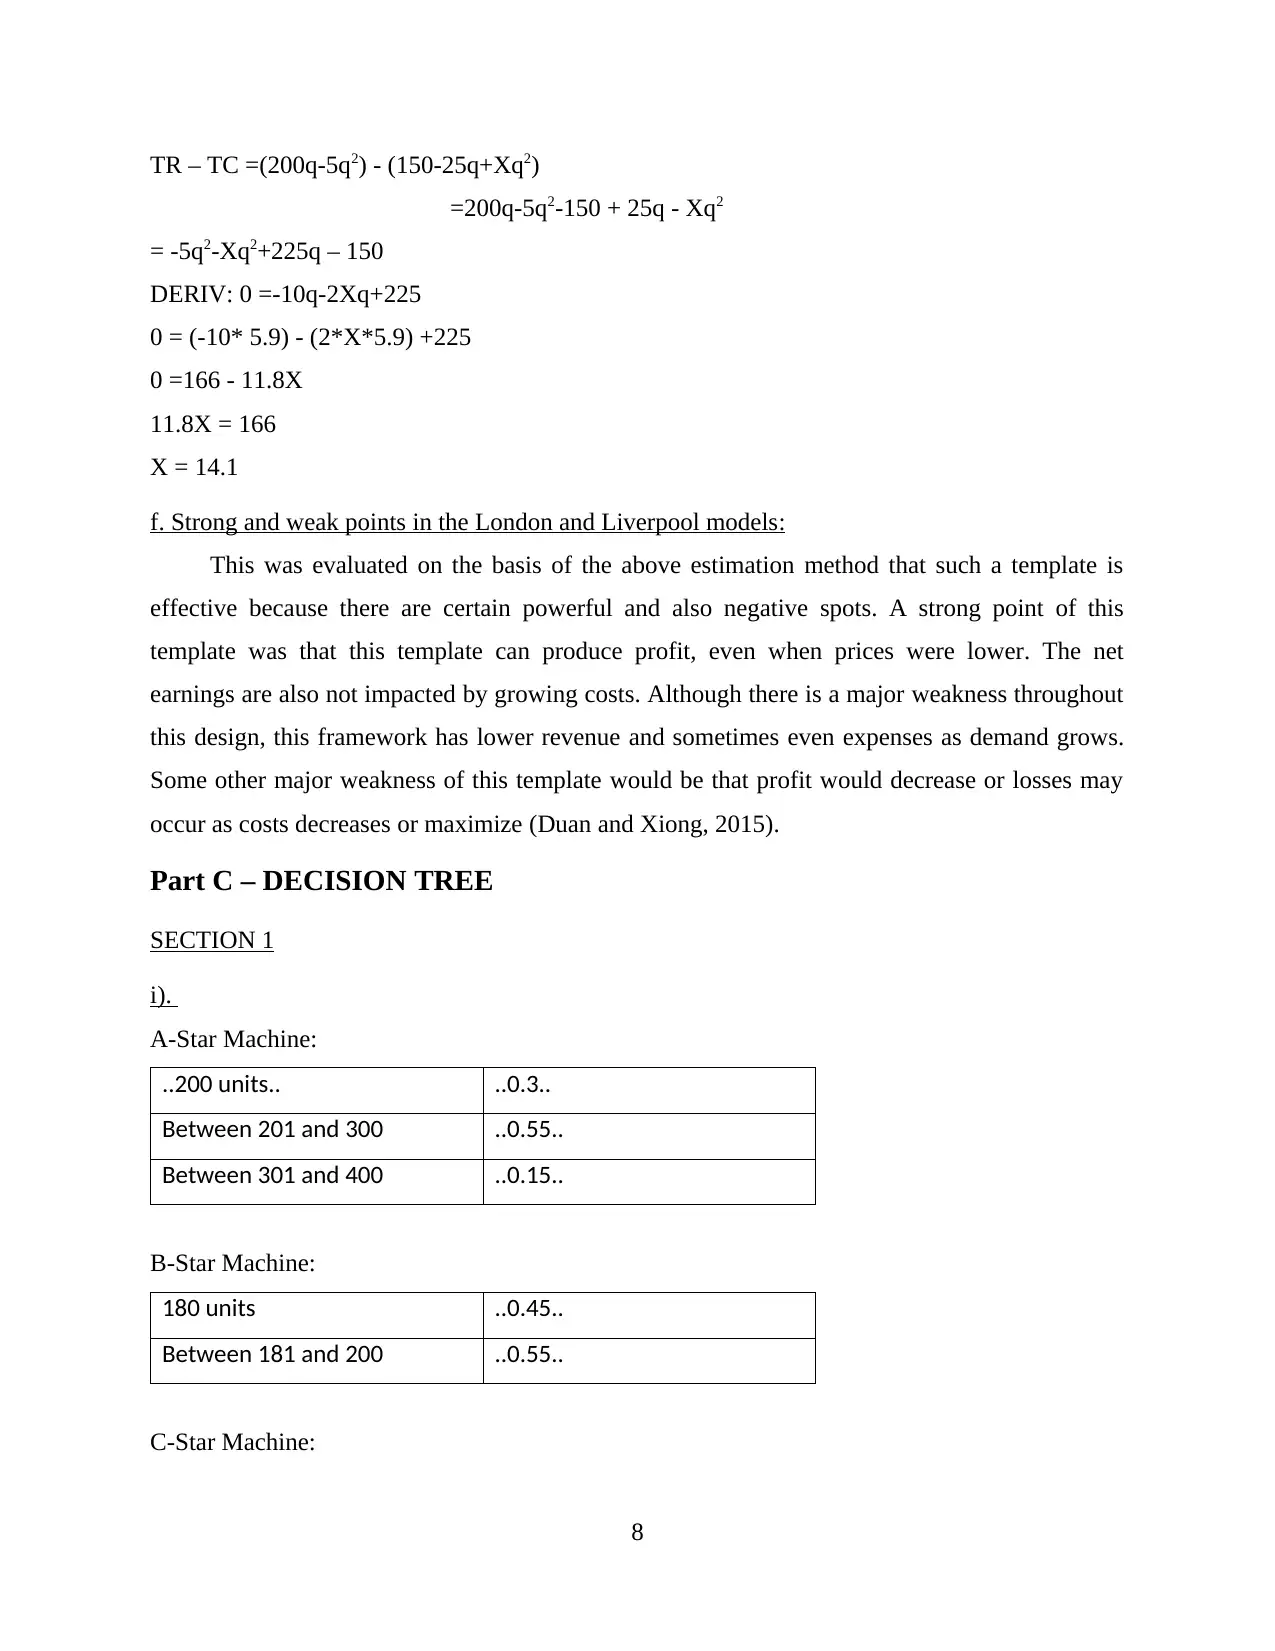
A-Star Machine:
..200 units.. ..0.3..
Between 201 and 300 ..0.55..
Between 301 and 400 ..0.15..
B-Star Machine:
180 units ..0.45..
Between 181 and 200 ..0.55..
C-Star Machine:
8
=200q-5q2-150 + 25q - Xq2
= -5q2-Xq2+225q – 150
DERIV: 0 =-10q-2Xq+225
0 = (-10* 5.9) - (2*X*5.9) +225
0 =166 - 11.8X
11.8X = 166
X = 14.1
f. Strong and weak points in the London and Liverpool models:
This was evaluated on the basis of the above estimation method that such a template is
effective because there are certain powerful and also negative spots. A strong point of this
template was that this template can produce profit, even when prices were lower. The net
earnings are also not impacted by growing costs. Although there is a major weakness throughout
this design, this framework has lower revenue and sometimes even expenses as demand grows.
Some other major weakness of this template would be that profit would decrease or losses may
occur as costs decreases or maximize (Duan and Xiong, 2015).
Part C – DECISION TREE
SECTION 1
i).
A-Star Machine:
..200 units.. ..0.3..
Between 201 and 300 ..0.55..
Between 301 and 400 ..0.15..
B-Star Machine:
180 units ..0.45..
Between 181 and 200 ..0.55..
C-Star Machine:
8
Paraphrase This Document
Need a fresh take? Get an instant paraphrase of this document with our AI Paraphraser
180 units ..0.45..
Between 181 and 200 ..0.55..
Decision Tree:
1. Q-Star: (0.3 X 800) + (0.55 X 1200) + (0.15 X 1600)
: 240 + 660 + 240
: 1140.
2. Q-Sun: (0.45 X 2160) + (0.55 X 2400)
: 972 + 1320
9
Between 181 and 200 ..0.55..
Decision Tree:
1. Q-Star: (0.3 X 800) + (0.55 X 1200) + (0.15 X 1600)
: 240 + 660 + 240
: 1140.
2. Q-Sun: (0.45 X 2160) + (0.55 X 2400)
: 972 + 1320
9
: 2292.
3. Q-Moon : (0.5 X 1920) + (0.5 X 1890)
: 960 + 990
: 1905.
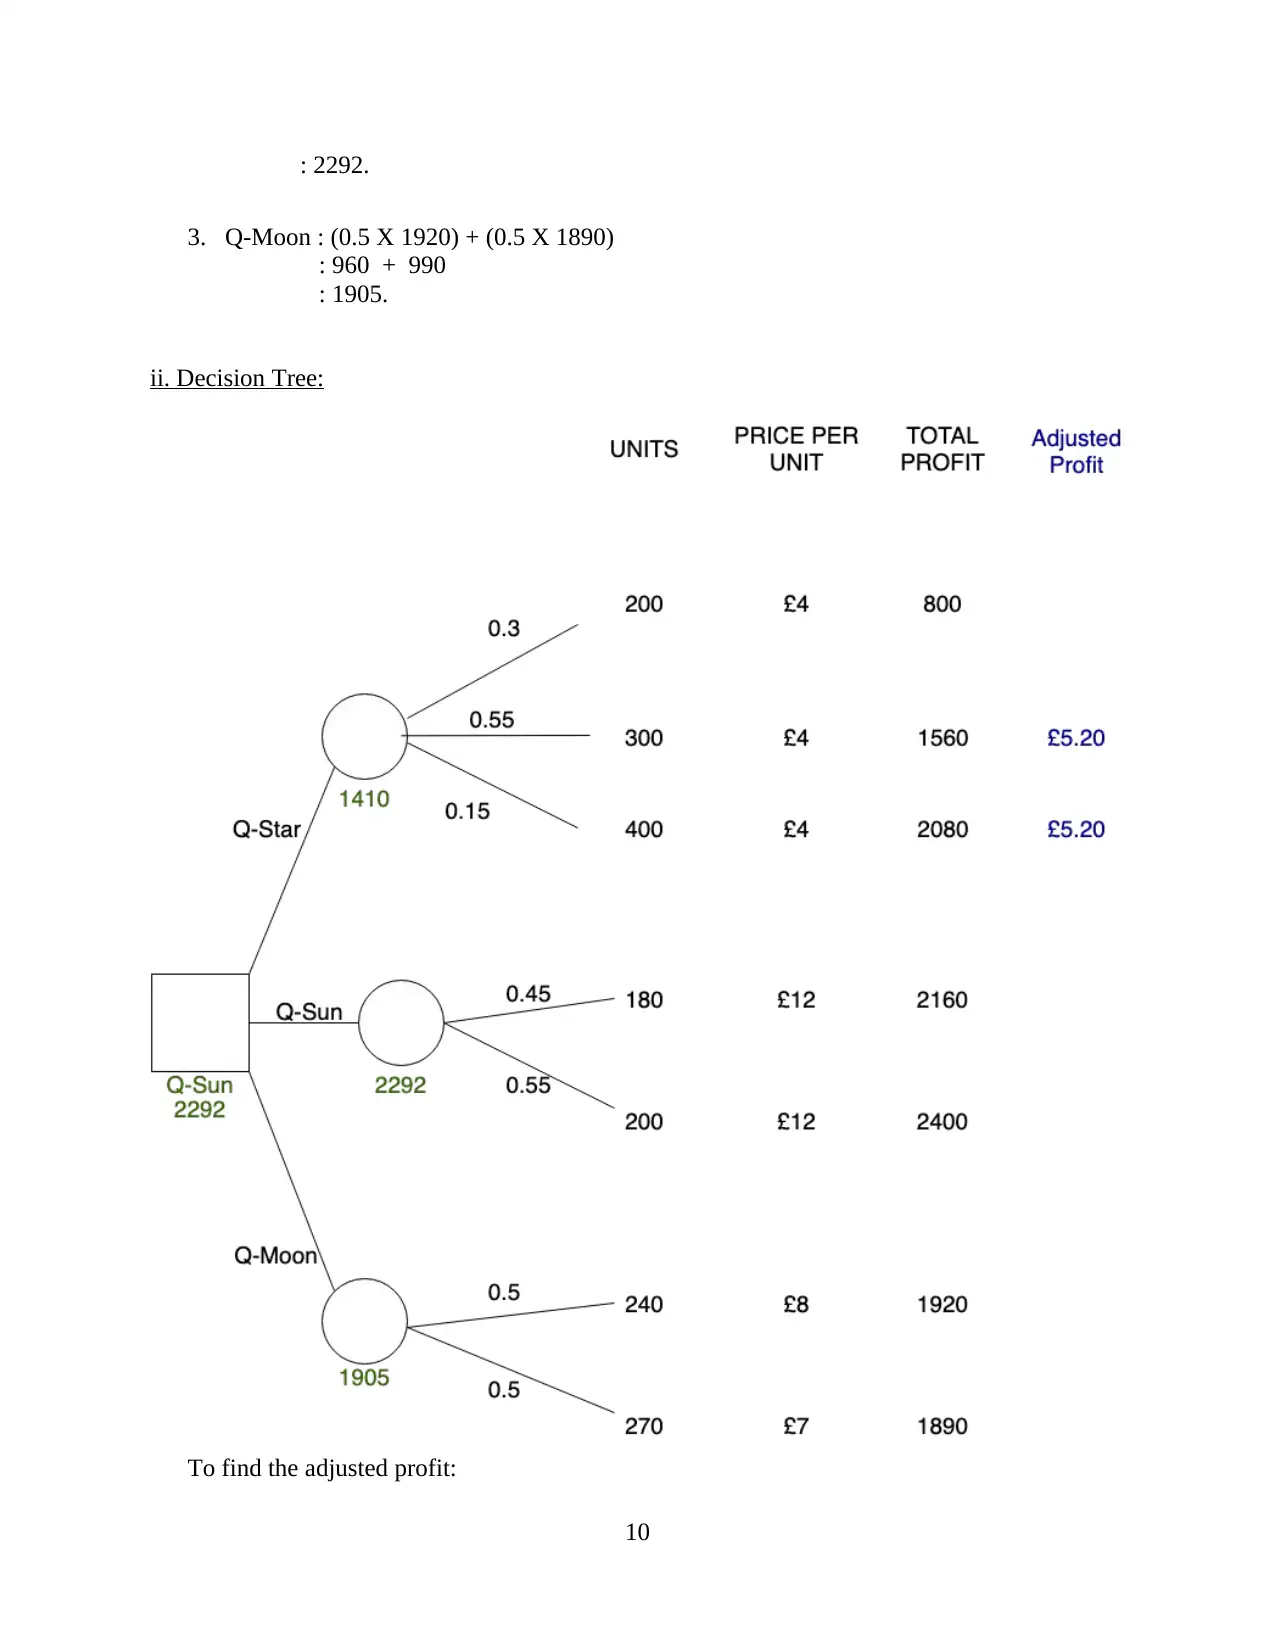
ii. Decision Tree:
To find the adjusted profit:
10
3. Q-Moon : (0.5 X 1920) + (0.5 X 1890)
: 960 + 990
: 1905.
ii. Decision Tree:
To find the adjusted profit:
10
⊘ This is a preview!⊘
Do you want full access?
Subscribe today to unlock all pages.
Trusted by 1+ million students worldwide
1 out of 14
Related Documents


Your All-in-One AI-Powered Toolkit for Academic Success.
+13062052269
info@desklib.com
Available 24*7 on WhatsApp / Email
![[object Object]](/_next/static/media/star-bottom.7253800d.svg)
Unlock your academic potential
Copyright © 2020–2026 A2Z Services. All Rights Reserved. Developed and managed by ZUCOL.