Business Decision Making: Restaurant Data Analysis and Recommendations

Verified

Added on  2023/04/04

|12
|434
|87
Report
AI Summary
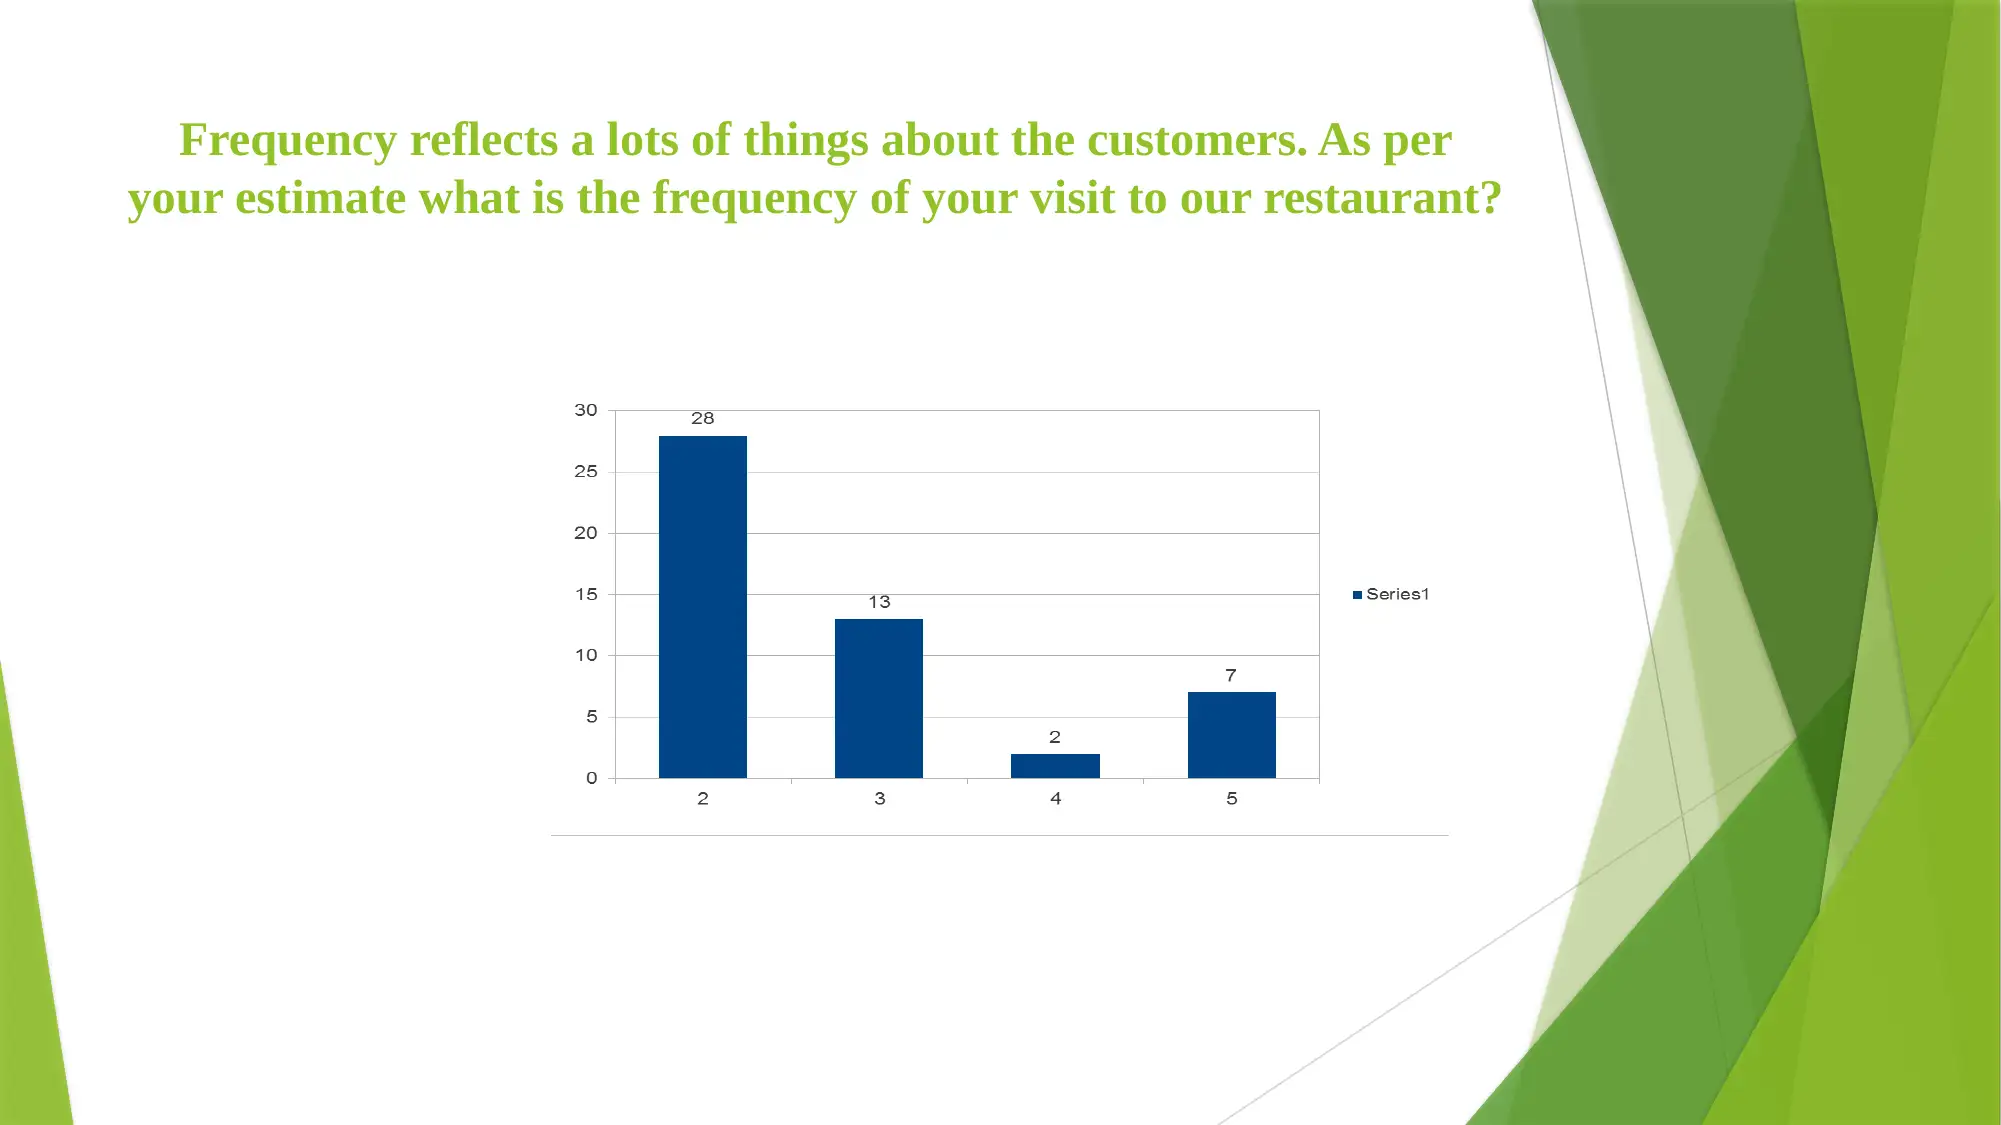
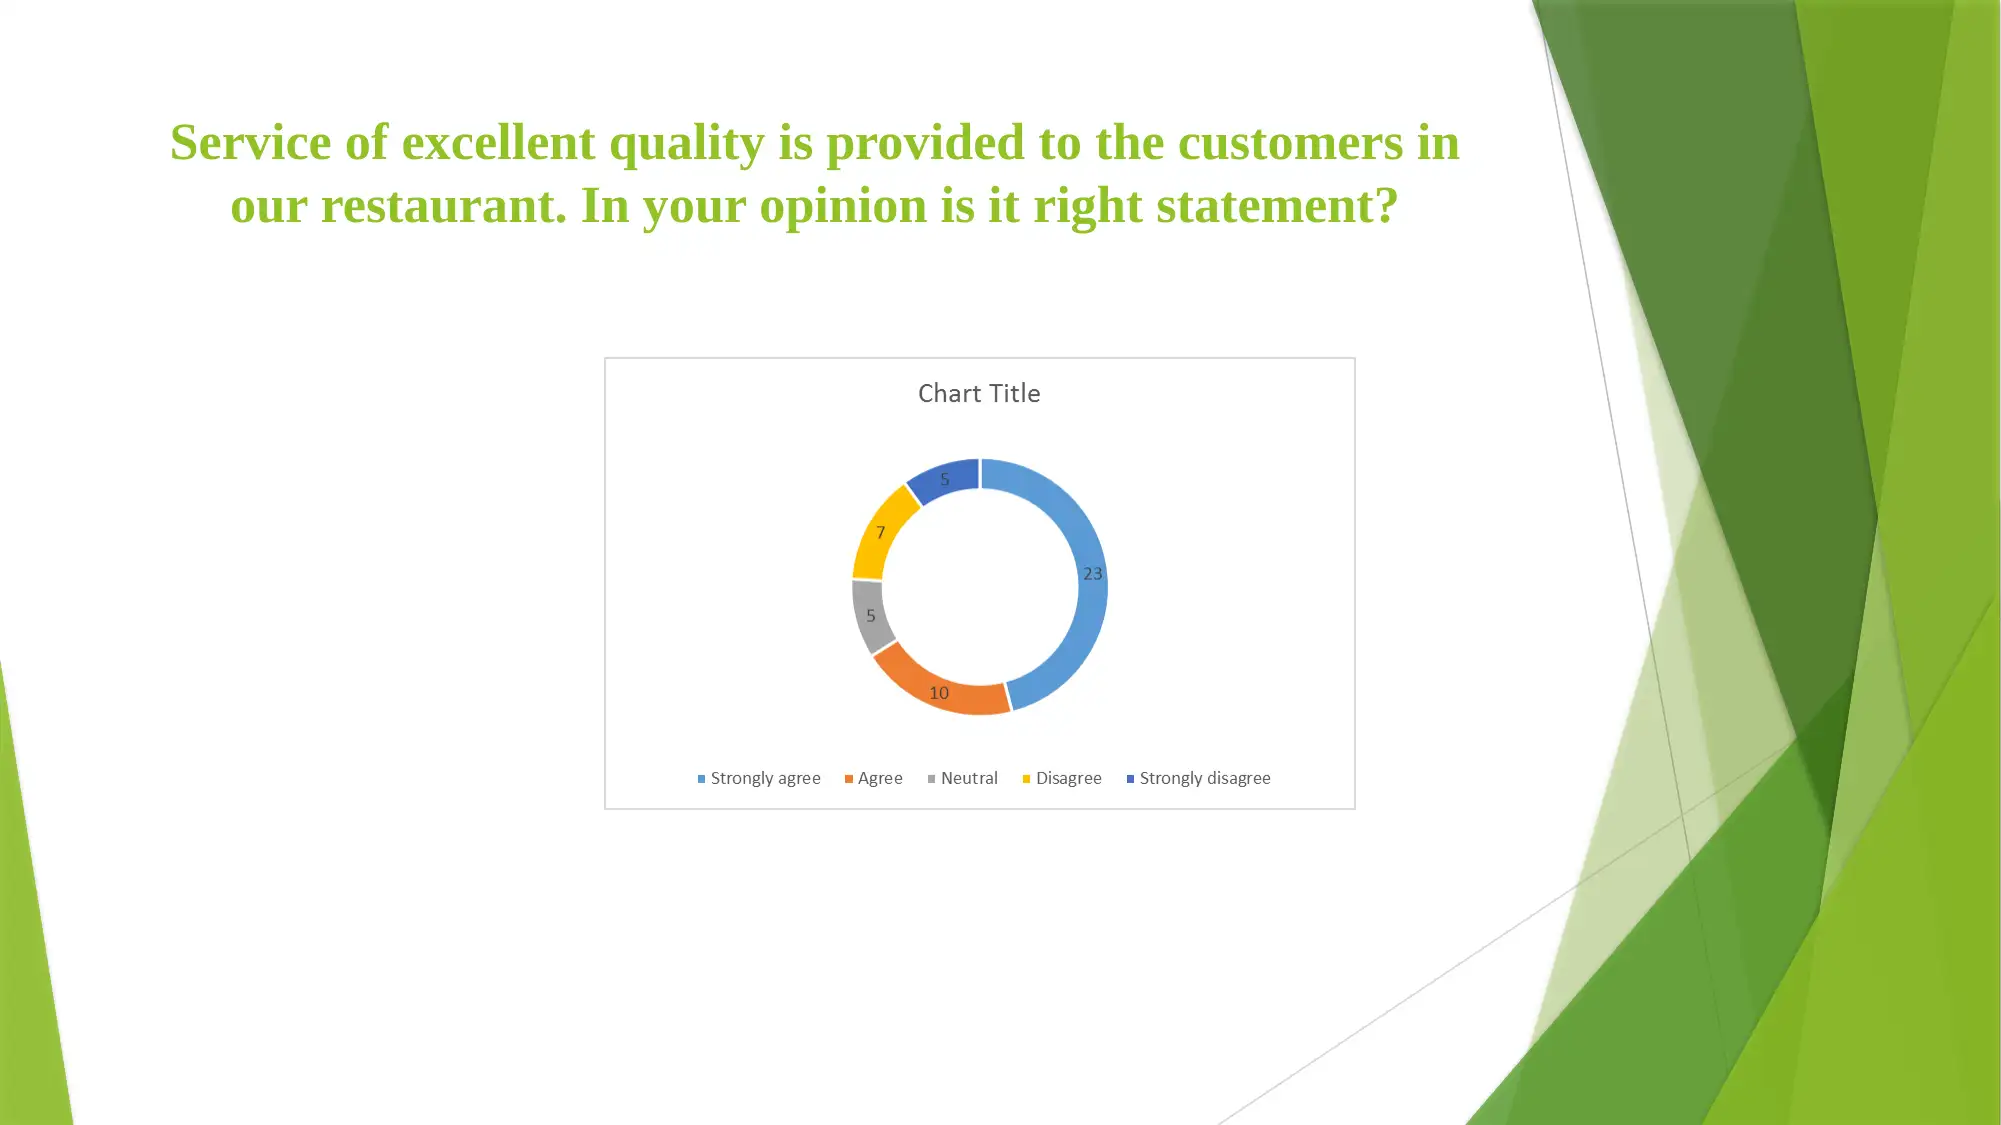
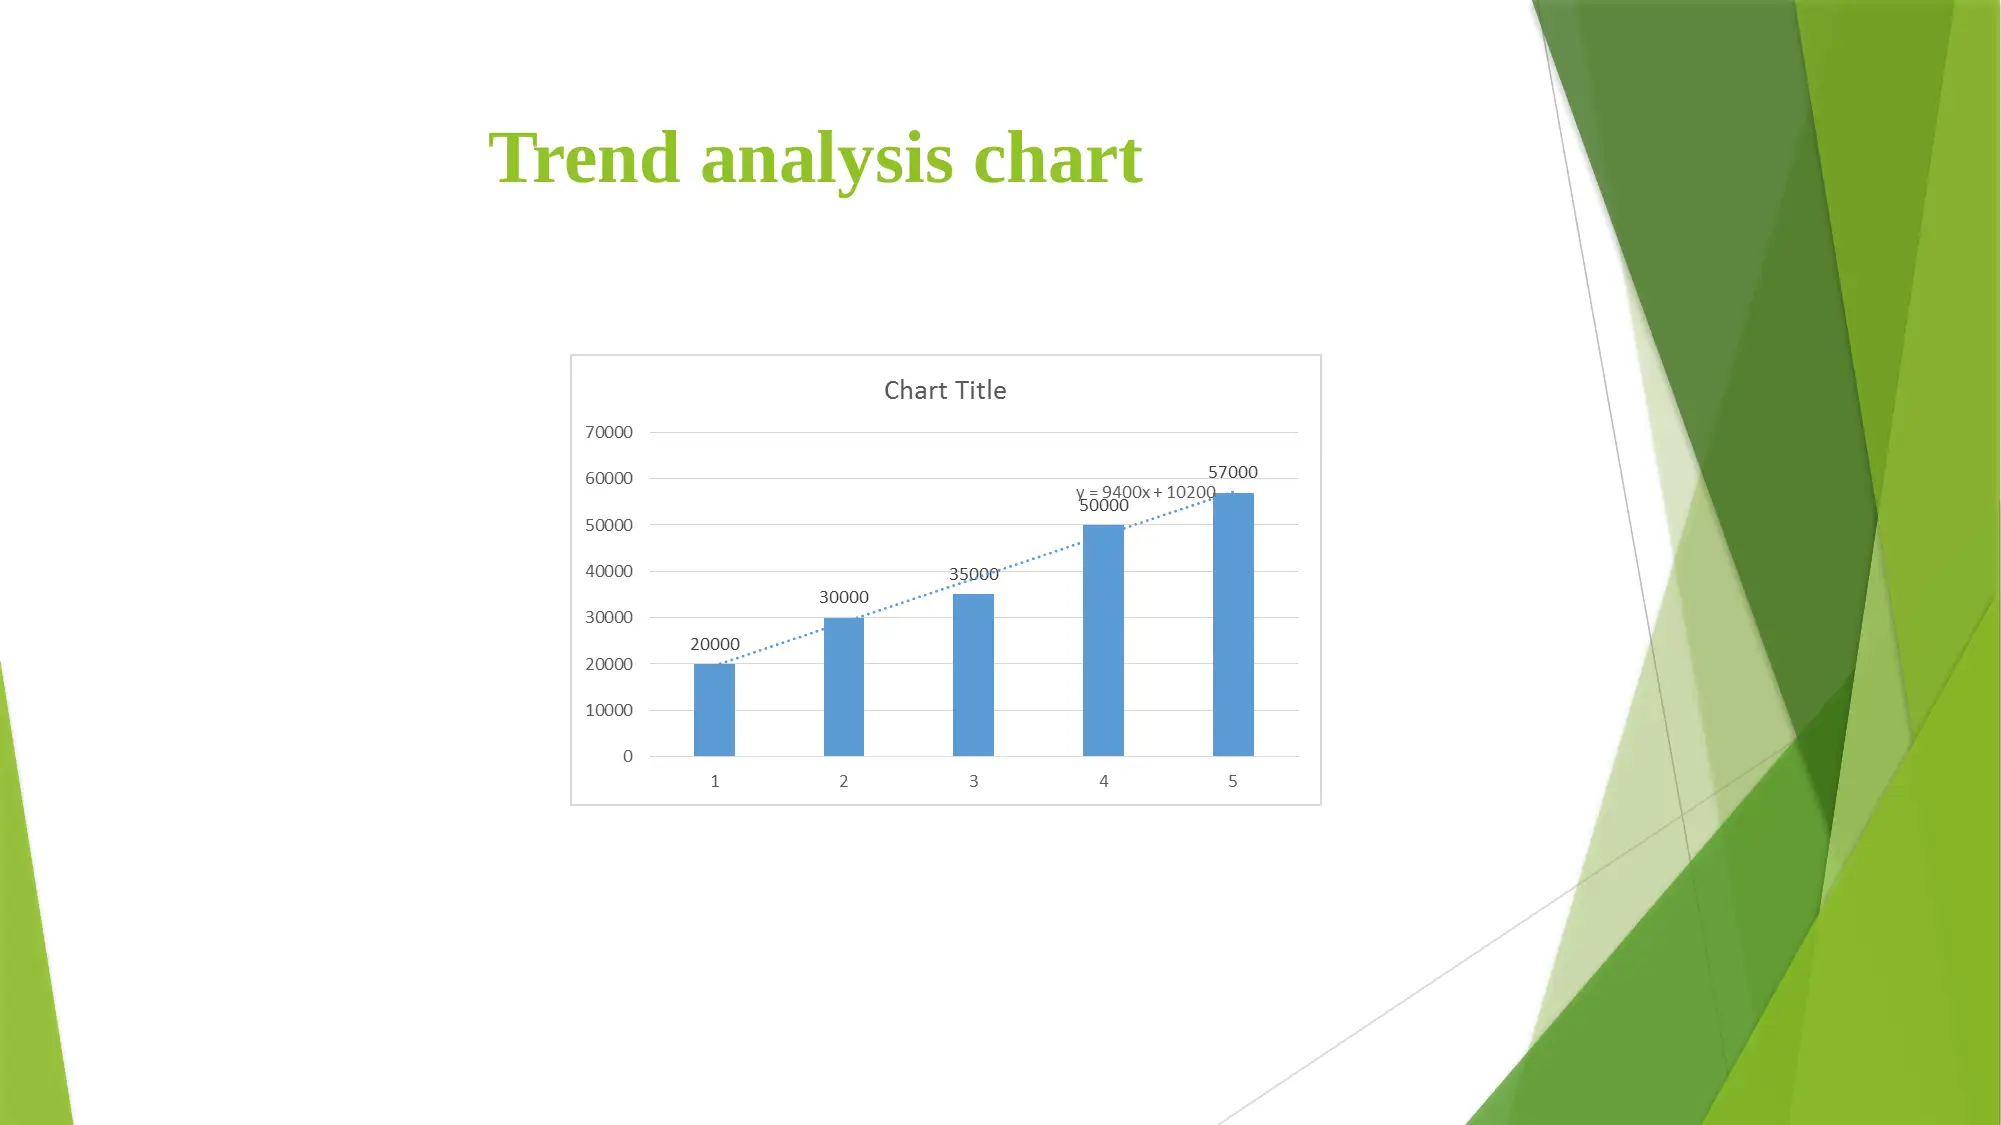
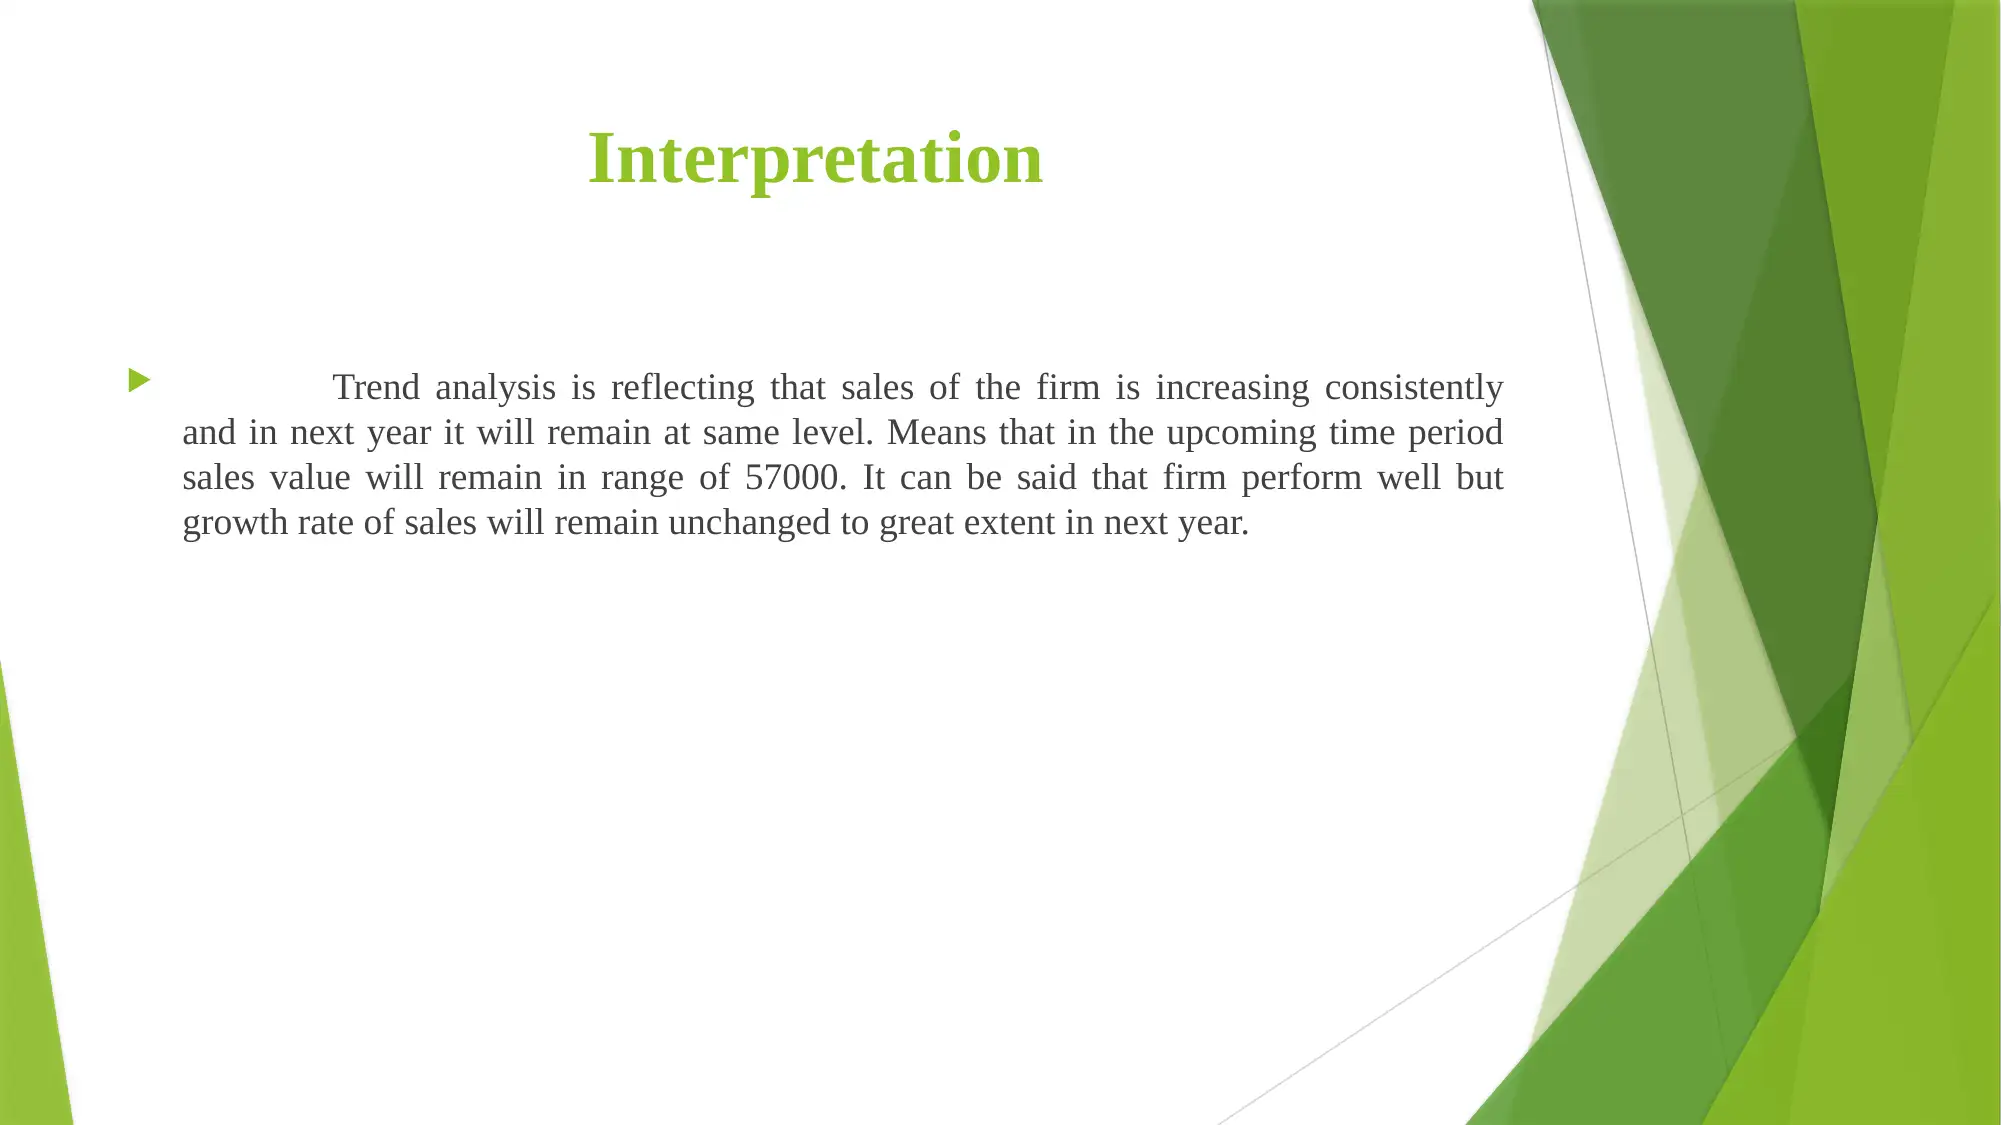
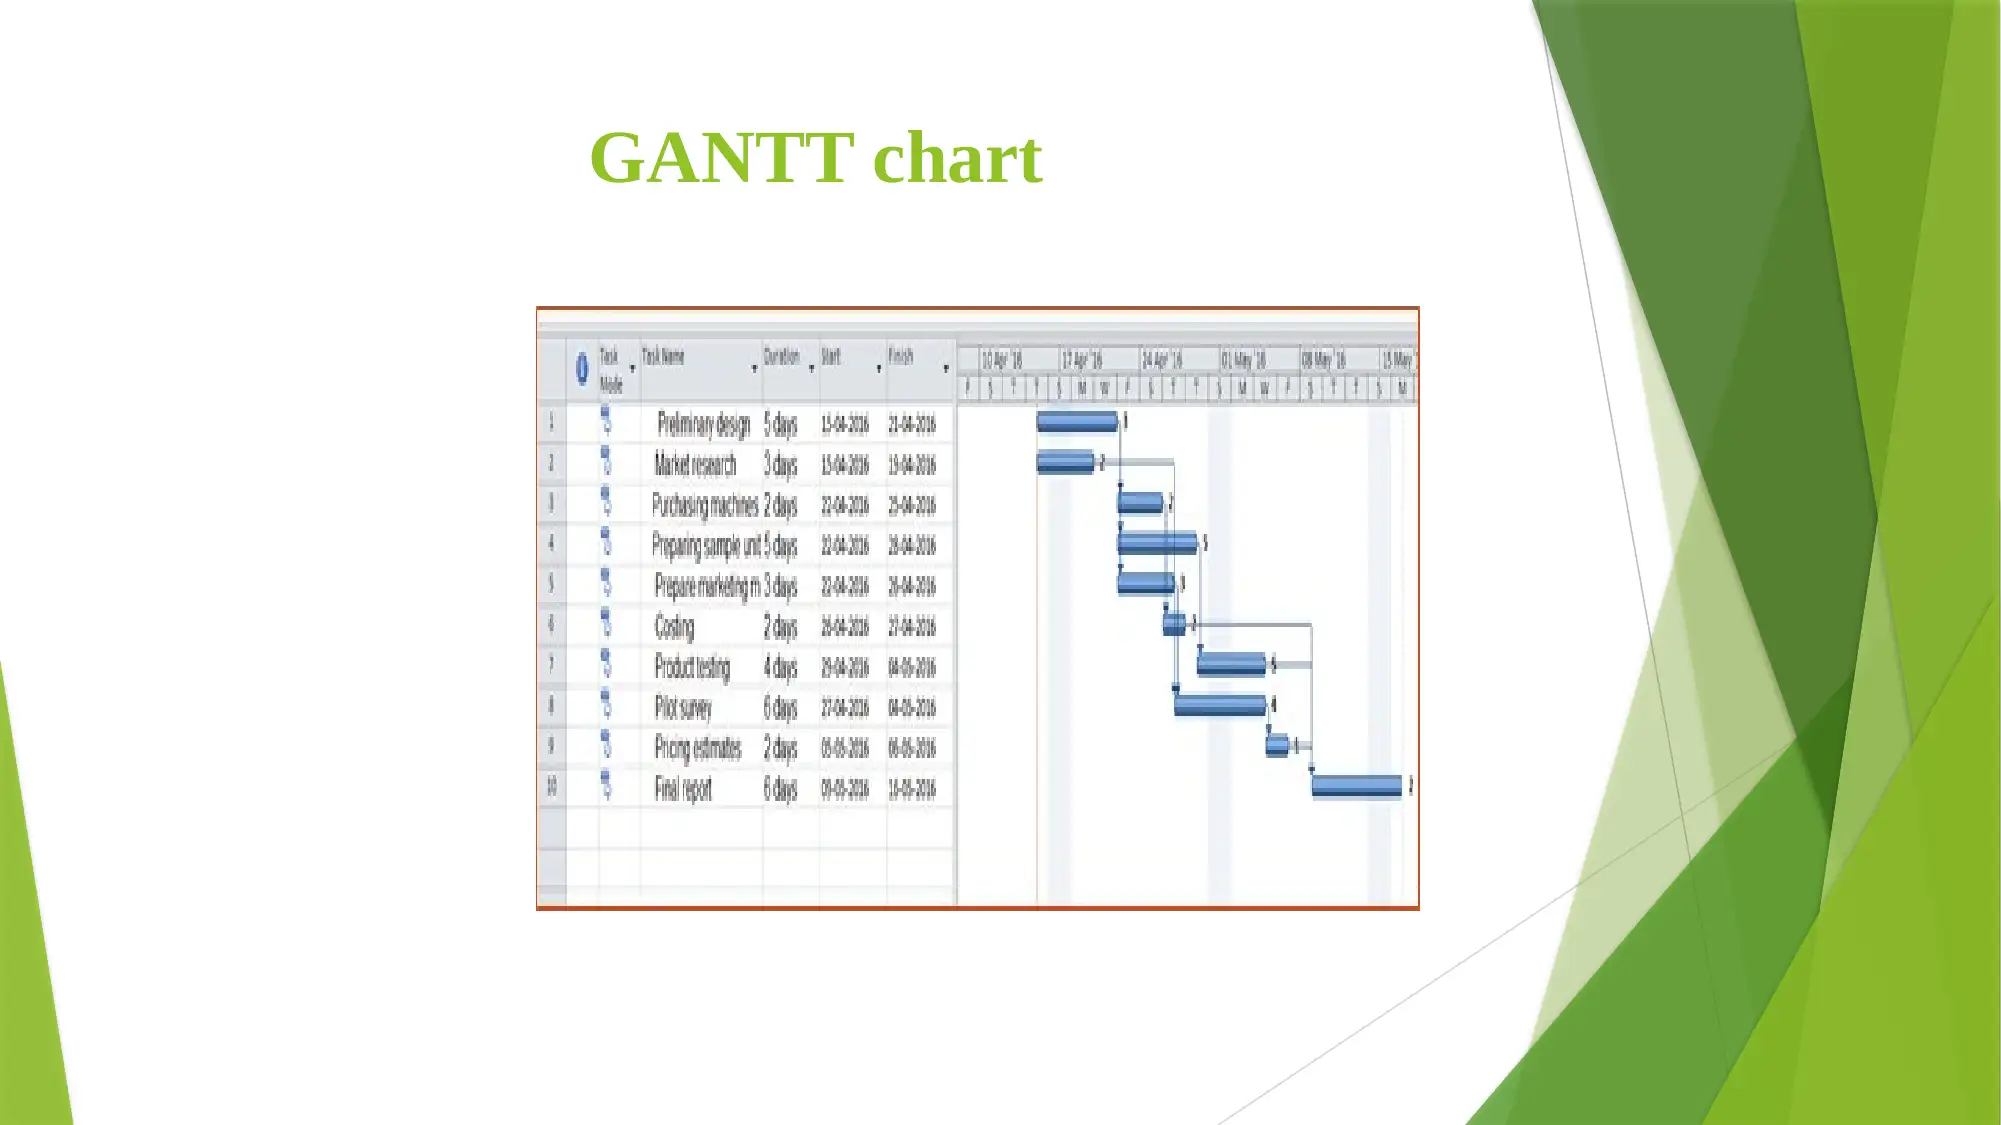
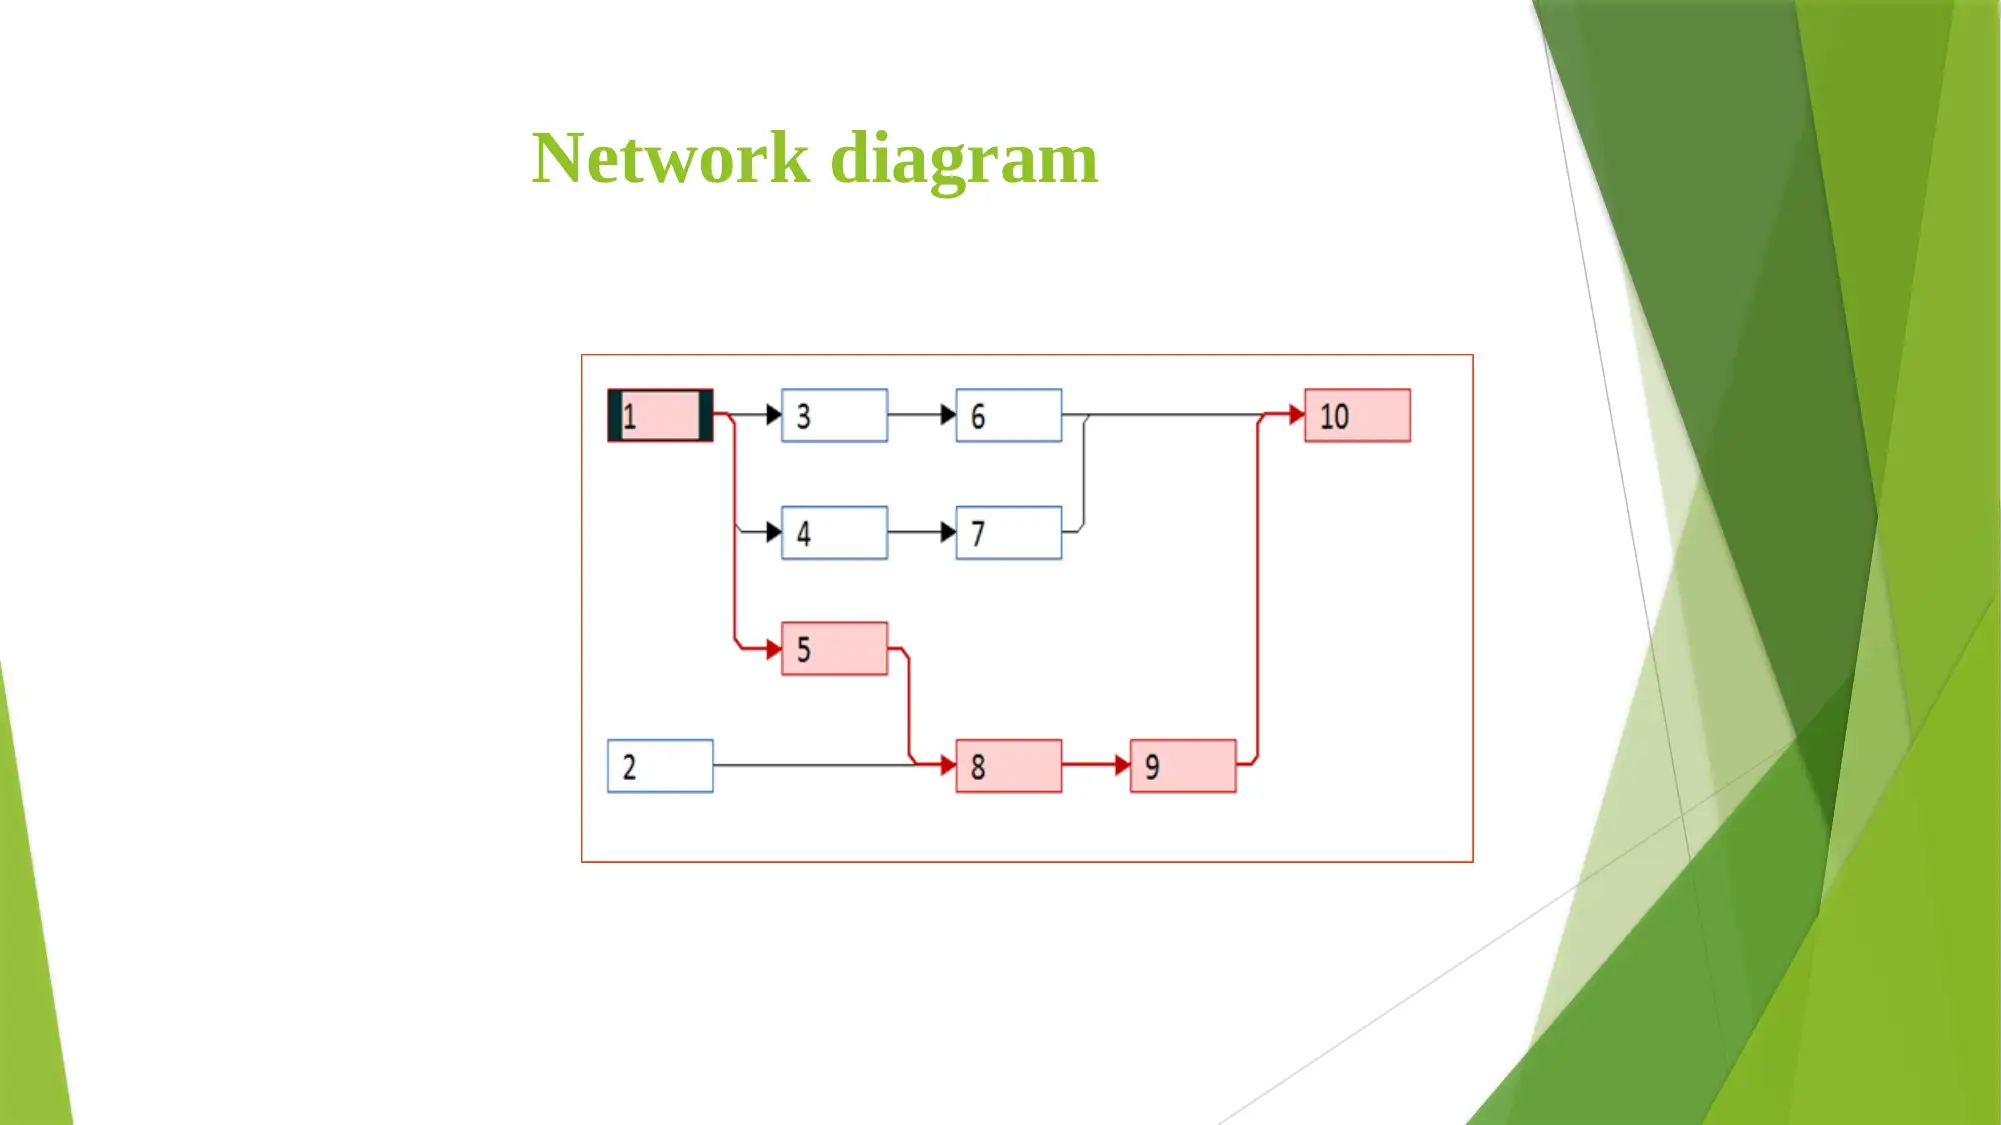
This report analyzes restaurant data to inform business decisions. It examines the frequency of customer visits, assessing the impact of service quality on customer satisfaction. The analysis includes interpretation of charts and data, such as the number of customers visiting the restaurant, the perceived quality of service, and sales trends. The report further explores the use of a Gantt chart and network diagram for project management, highlighting the critical path and its implications. The data suggests that a significant portion of customers visit the restaurant frequently, and while service quality is generally perceived as good, there's room for improvement. The report provides insights into sales growth and forecasts, emphasizing the importance of data-driven decision-making in optimizing restaurant operations and customer experience. The conclusion emphasizes the importance of understanding customer behavior and utilizing project management tools for efficiency.
Document Page
BUSINESS DECISION
MAKING
tabler-icon-diamond-filled.svg

Paraphrase This Document

Need a fresh take? Get an instant paraphrase of this document with our AI Paraphraser
Document Page
Frequency reflects a lots of things about the customers. As per
your estimate what is the frequency of your visit to our restaurant?
Document Page
Interpretation
Chart that is give above is reflecting that there are 28 people out of 50 who state that
they visit Murano restaurant 2 times in a month. Apart from this, there are 13
respondents who state that they visit mentioned restaurant 3 times in a month. There are
2 and 7 respondents who state that they visit mentioned restaurant 4 and 5 times. It can
be said that most of respondents visit mentioned restaurant 2 times in a month.
Document Page
Service of excellent quality is provided to the customers in
our restaurant. In your opinion is it right statement?
tabler-icon-diamond-filled.svg

Paraphrase This Document

Need a fresh take? Get an instant paraphrase of this document with our AI Paraphraser
Document Page
Interpretation
It can be seen from the image that most of people think that are strongly
agree on the fact that firm is making available excellent quality service to the people.
There are 10 agree, 5 neutral, 7 disagree and 5 strongly disagree with same statement. It
can be said that firm is providing good services to the customers.
Document Page
Trend analysis chart
Document Page
Interpretation
Trend analysis is reflecting that sales of the firm is increasing consistently
and in next year it will remain at same level. Means that in the upcoming time period
sales value will remain in range of 57000. It can be said that firm perform well but
growth rate of sales will remain unchanged to great extent in next year.
tabler-icon-diamond-filled.svg

Paraphrase This Document

Need a fresh take? Get an instant paraphrase of this document with our AI Paraphraser
Document Page
GANTT chart
Document Page
Network diagram
Document Page
Interpretation
Network diagram is the one of the main method that is used for evaluation of
the project. Mentioned method reflect the path that must be followed to perform all
tasks in the specific sequence (Bernard, 2011). It can be seen from the table that critical
path is 1+5+8+9+10 which means that project must be completed in 22 days. The
activities that are not in critical path can be delayed and this will not affect entire
project cost. It can be said that network diagram is the one of the most important
method that is used by the managers in the project management.
tabler-icon-diamond-filled.svg

Paraphrase This Document

Need a fresh take? Get an instant paraphrase of this document with our AI Paraphraser
Document Page
REFERENCES
Mertler, C.A. and Reinhart, R.V., 2016. Advanced and multivariate statistical methods:
Practical application and interpretation. Routledge.
Plonsky, L., 2015. Statistical power, p values, descriptive statistics, and effect sizes: A"
back-to-basics" approach to advancing quantitative methods in L2 research. Routledge.
Stawarczyk, B. and et.al., 2012. Evaluation of flexural strength of hipped and
presintered zirconia using different estimation methods of Weibull statistics. Journal of
the mechanical behavior of biomedical materials. 10. pp.227-234
Document Page
THANK YOU
chevron_up_icon
1 out of 12
circle_padding
hide_on_mobile
zoom_out_icon
[object Object]