Business Decision Making: Sales and Advertising Report

Verified

Added on  2023/04/22

|15
|753
|249
Report
AI Summary
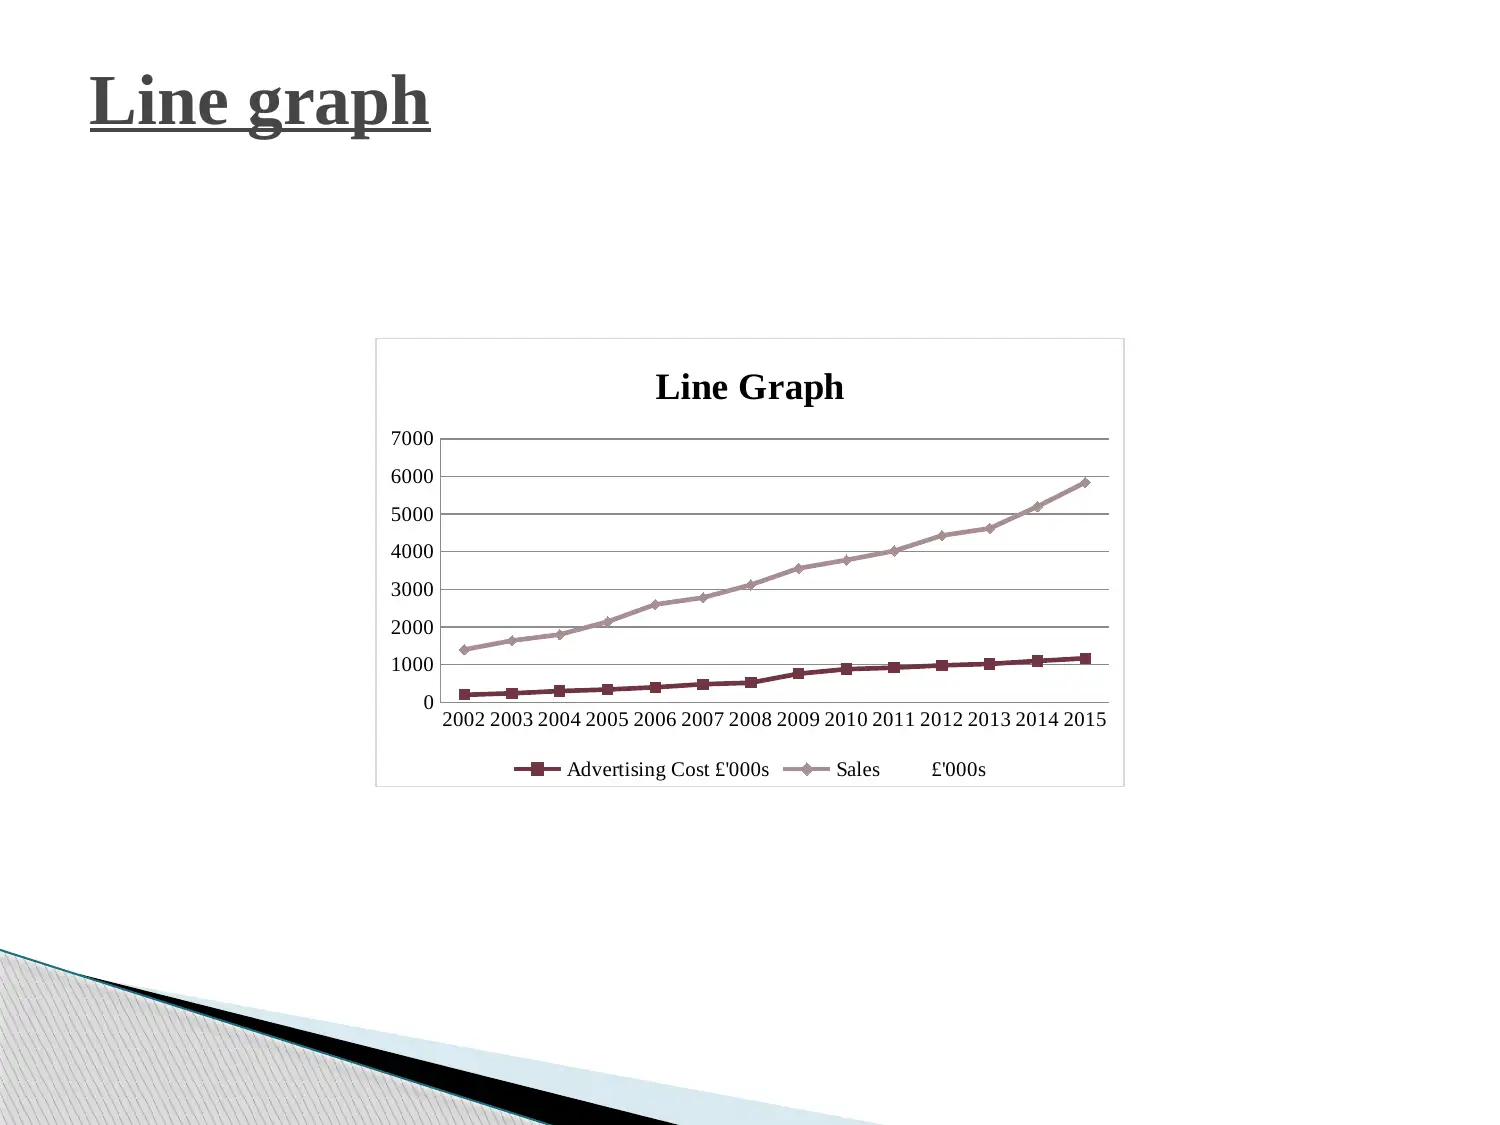
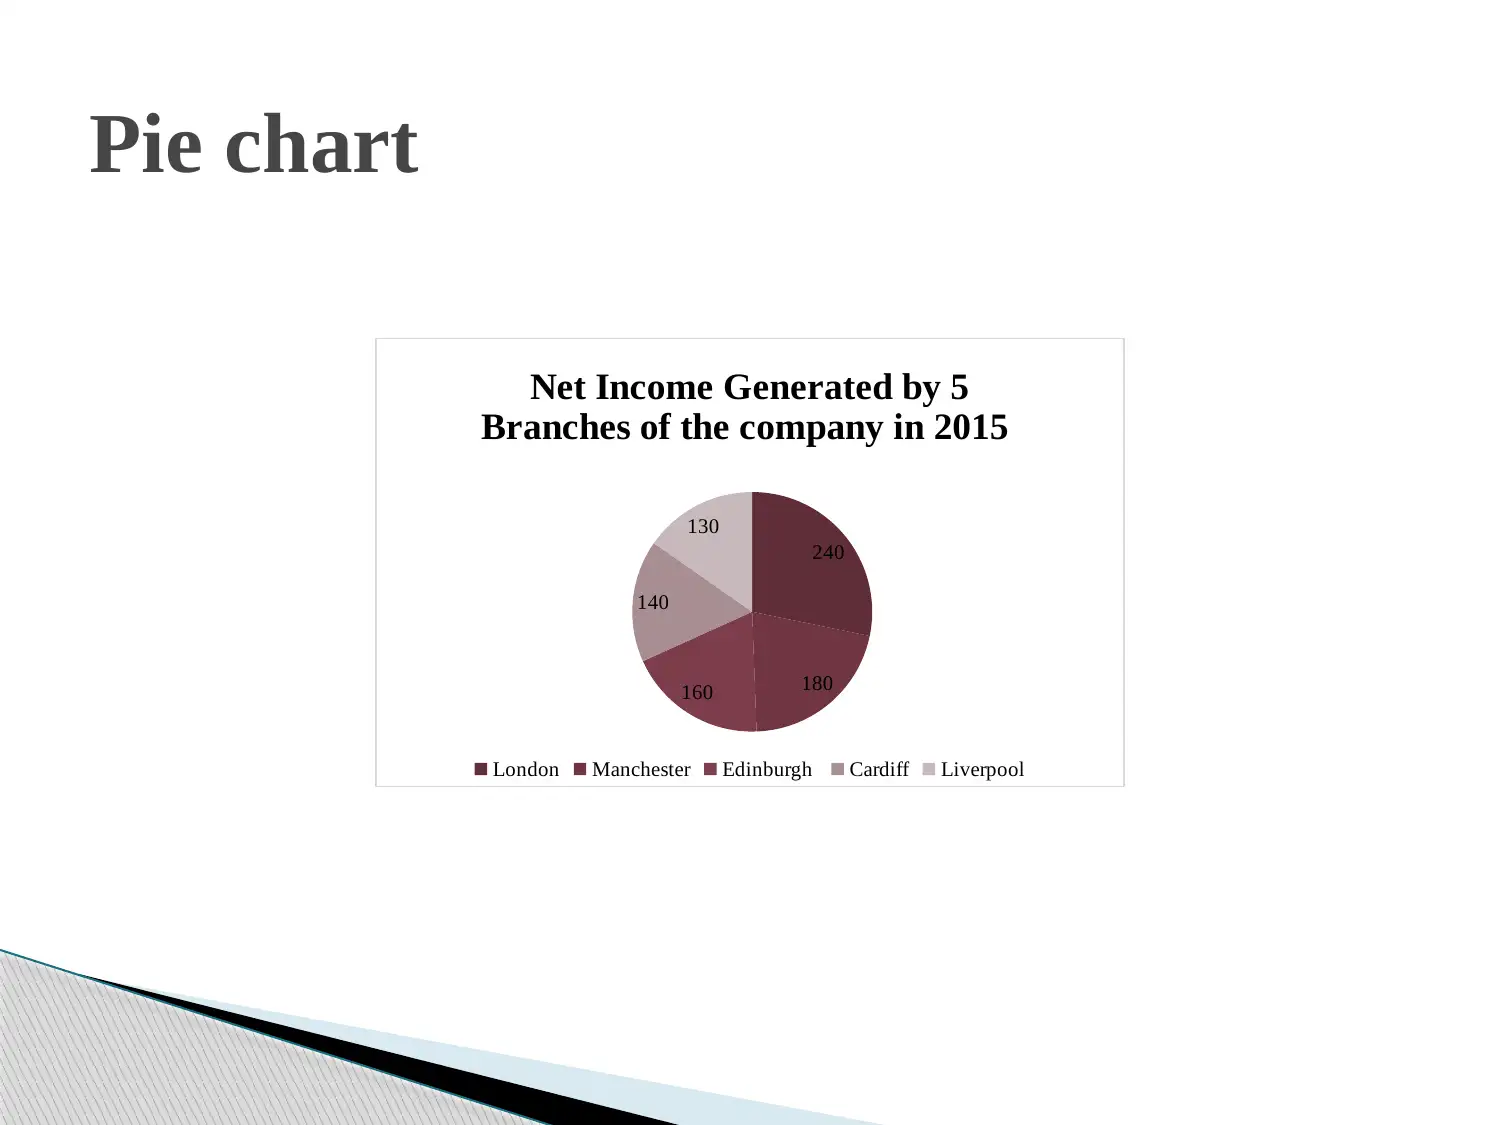
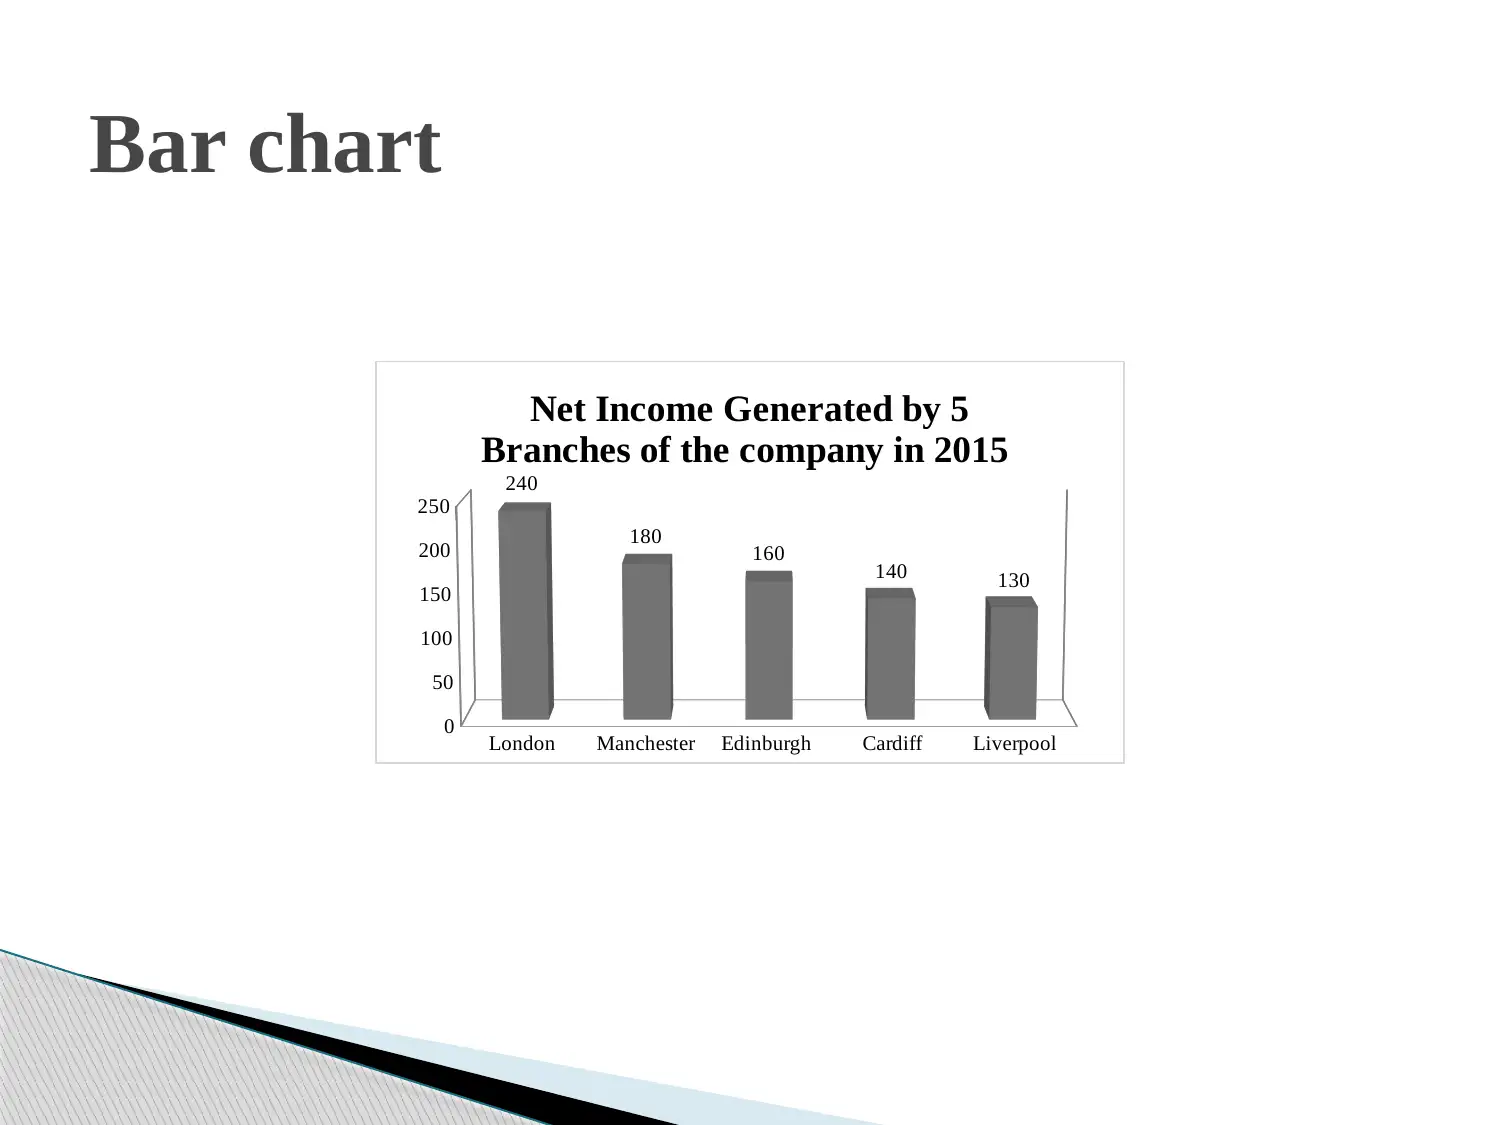
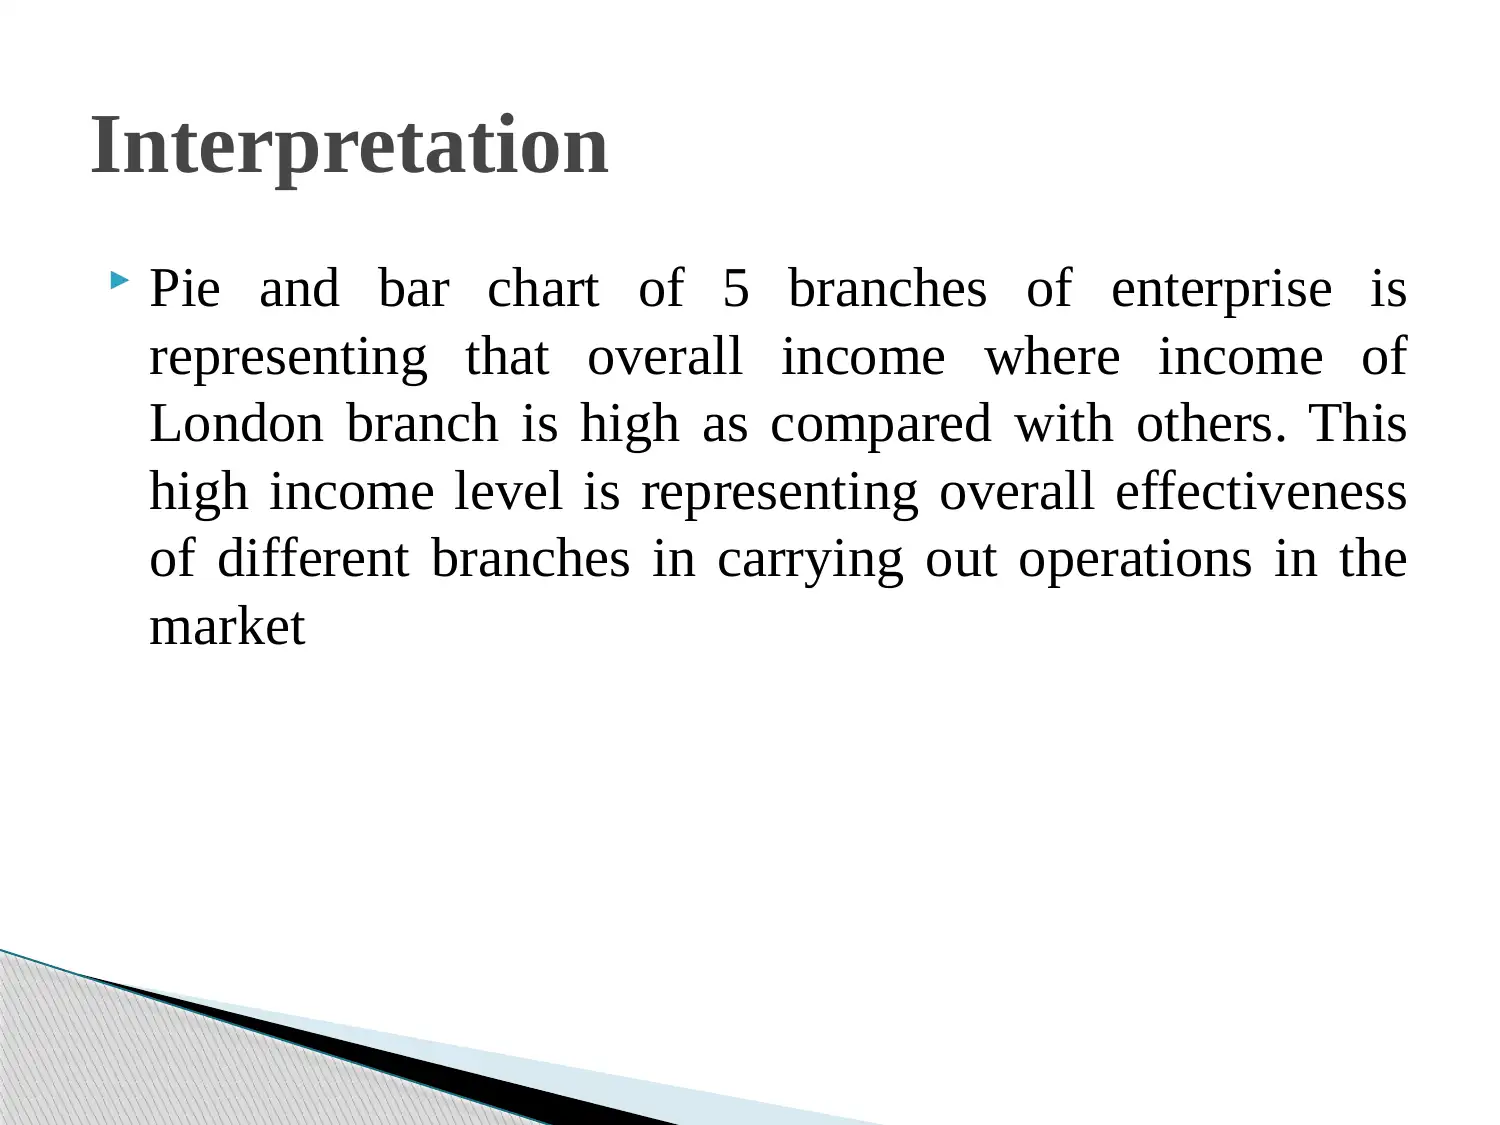
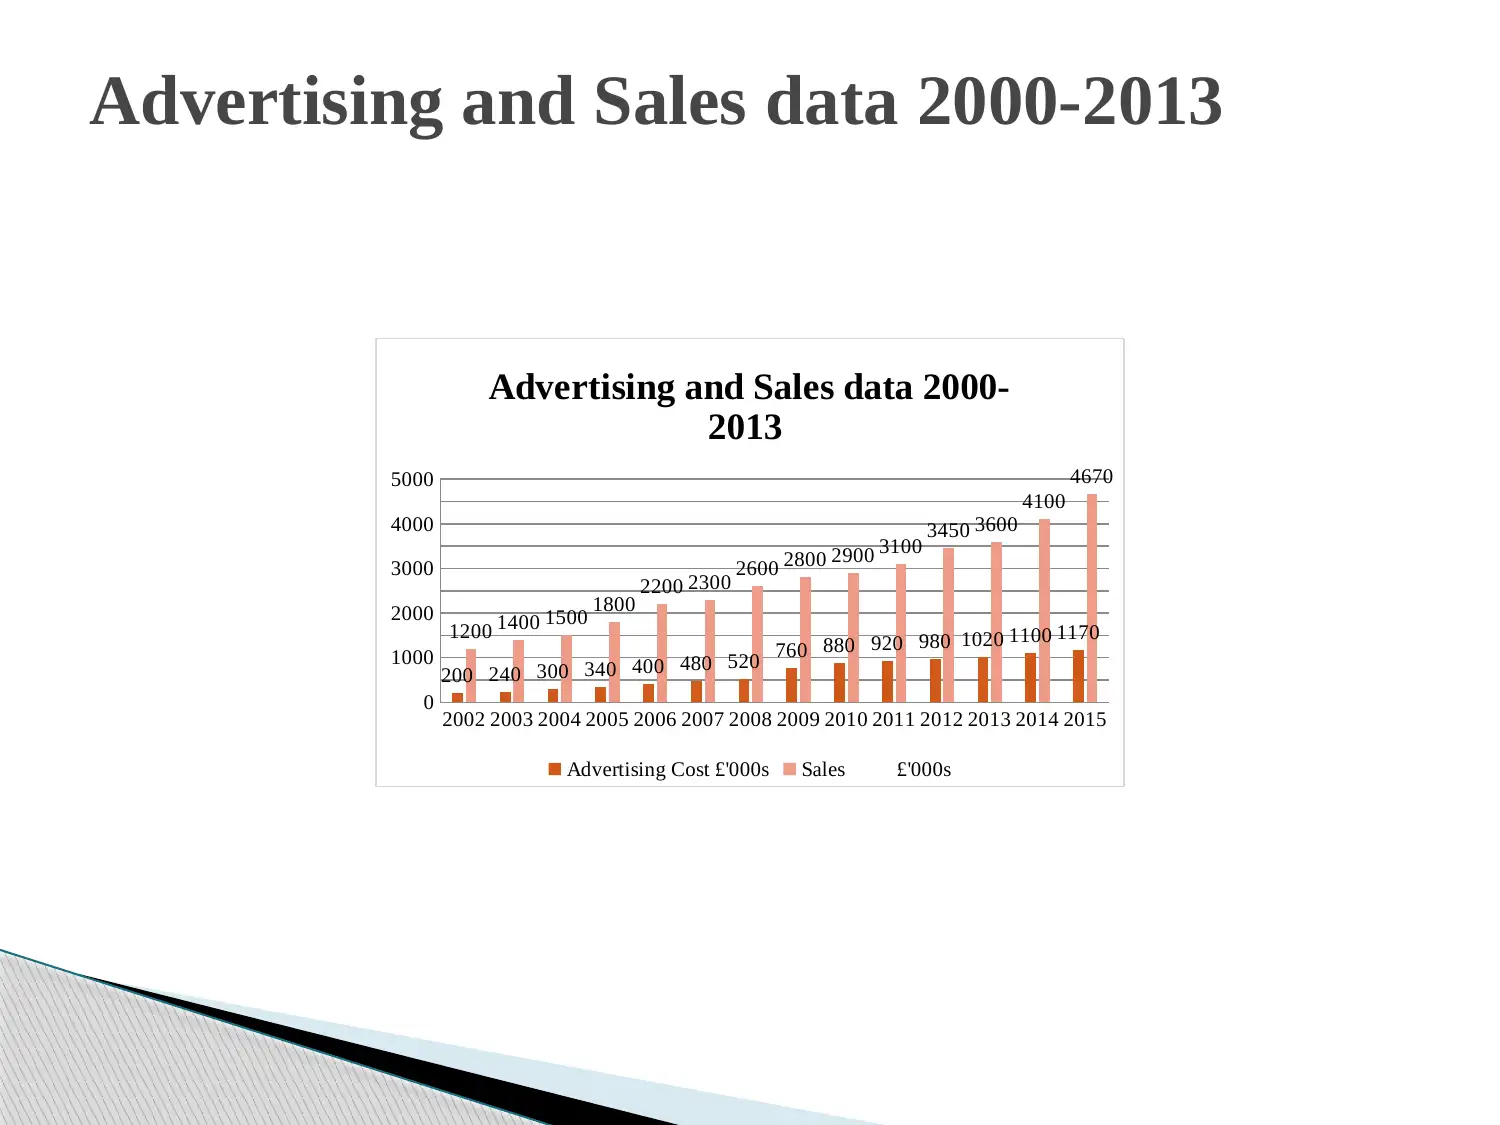
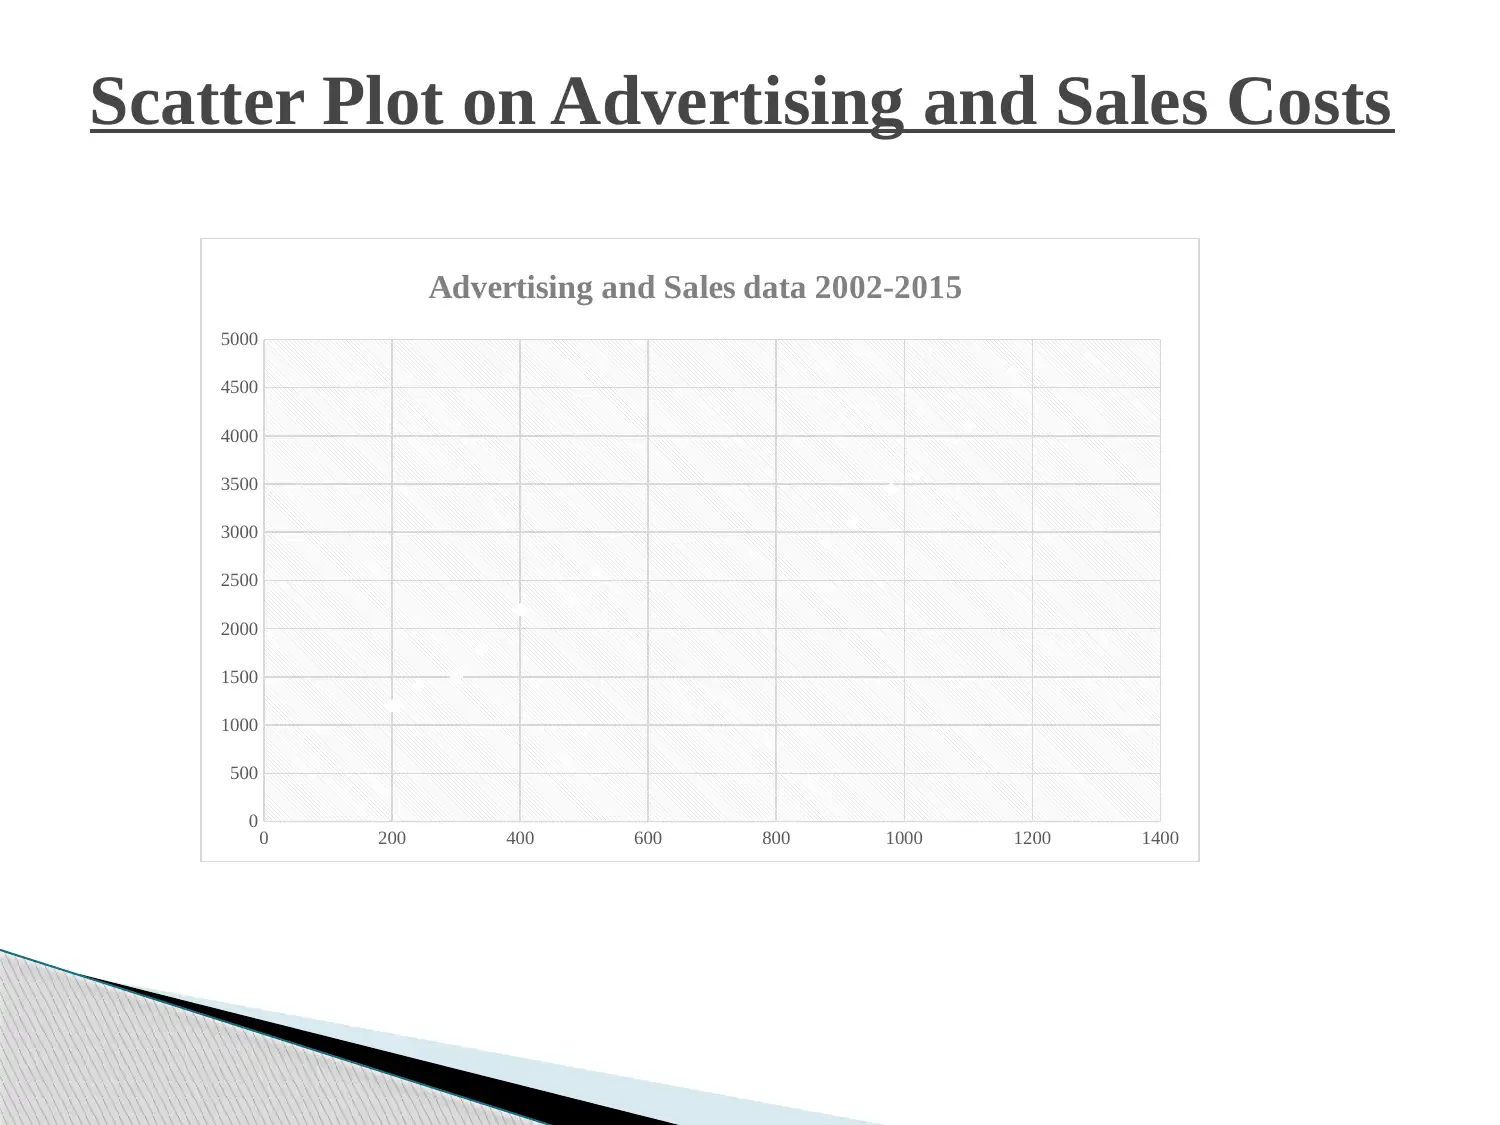
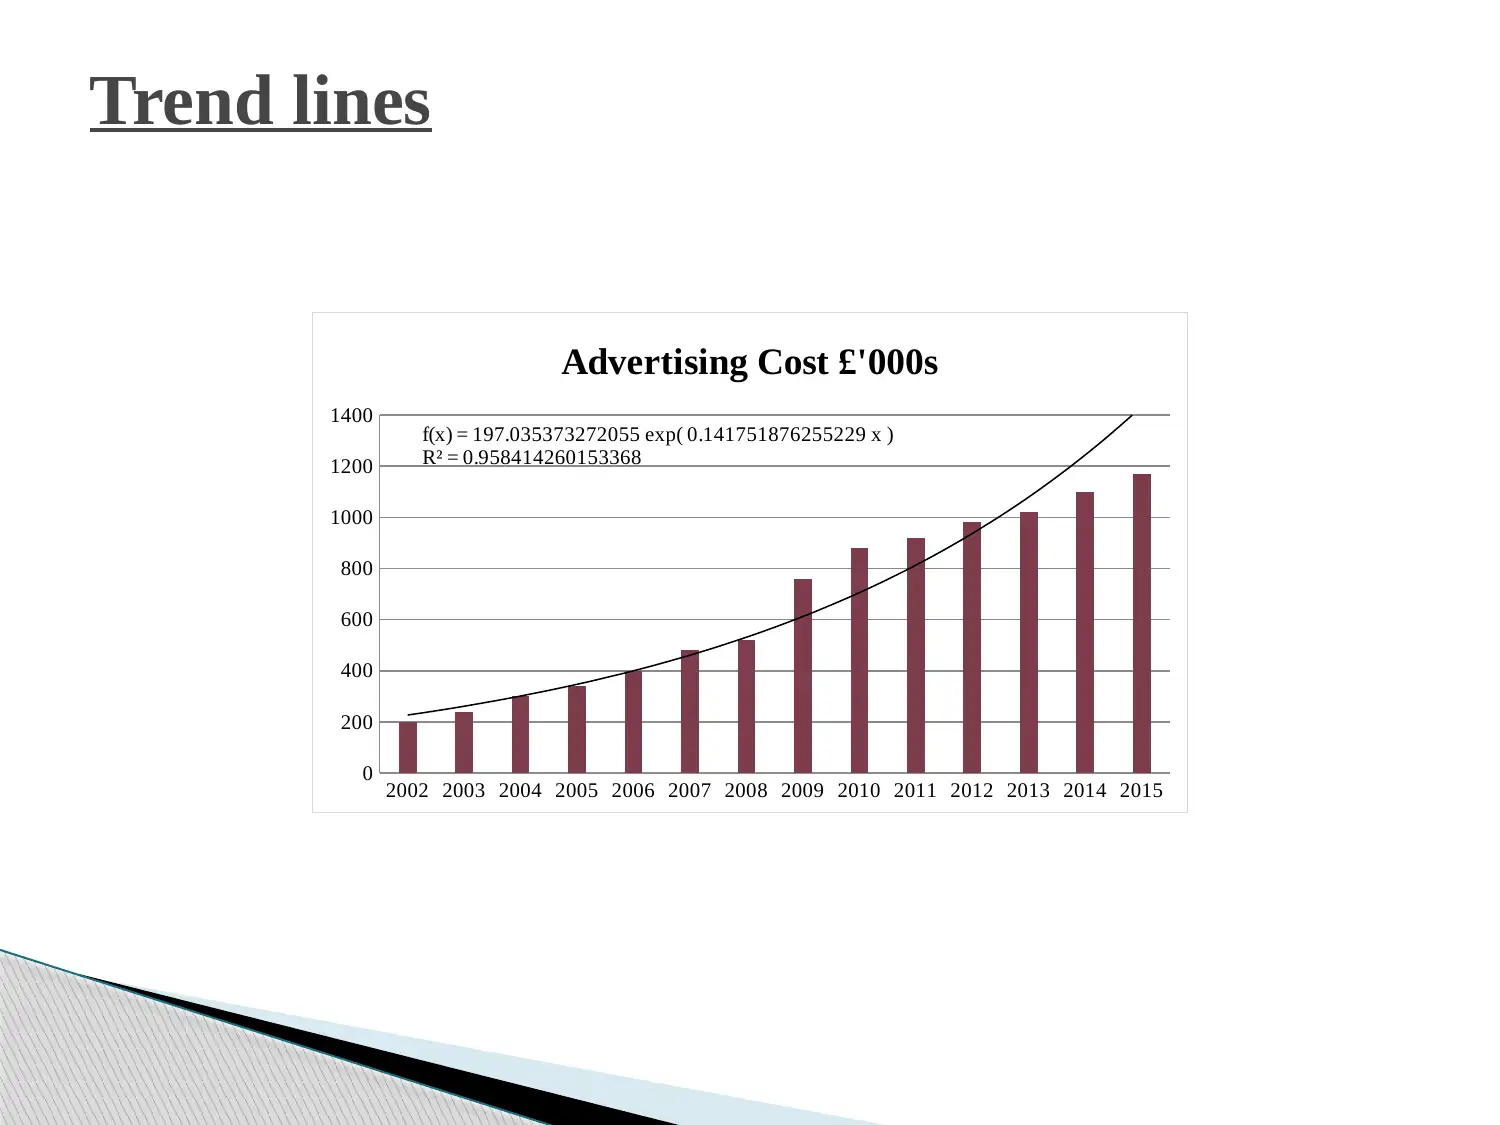
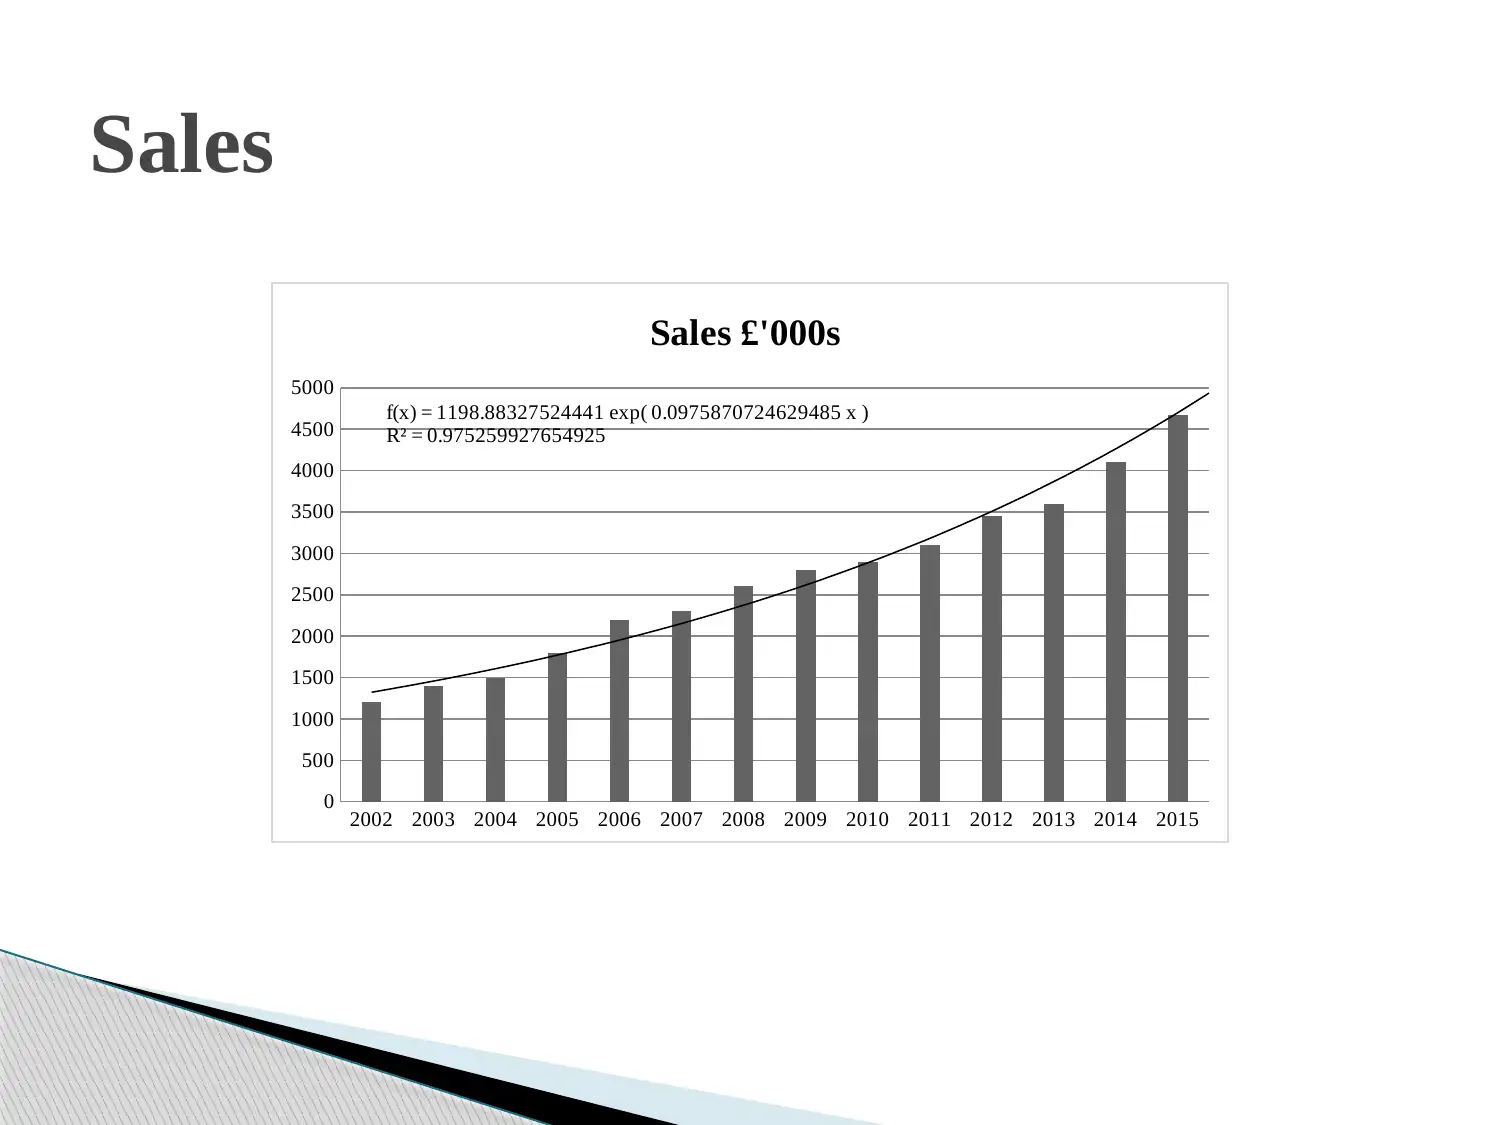
This report analyzes a business's performance through the lens of sales, advertising, and branch operations. It presents data from 2002 to 2015 using line graphs, pie charts, bar charts, and scatter plots to visualize trends and relationships. The analysis reveals a positive correlation between advertising costs and sales volume, with London branch generating the highest income. Trend lines are developed to project future performance, indicating that increased advertising expenditure can lead to higher sales and profitability. The conclusion recommends continued investment in advertising and promotional activities to capitalize on market opportunities and sustain long-term growth. The report references data collection and analysis methods, business ethics, and multiple regression techniques to support its findings and recommendations.
tabler-icon-diamond-filled.svg

Contribute Materials

Your contribution can guide someone’s learning journey. Share your documents today.
Document Page
Business decision making
TASK 3
tabler-icon-diamond-filled.svg

Secure Best Marks with AI Grader

Need help grading? Try our AI Grader for instant feedback on your assignments.
Document Page
The presentation shown advertising and sales figures
given from 2002 to 2015, pie and bar charts for net
income generated by the five branches of the company
and scatter graphs of advertising and sales figures that
are made using spreadsheets.
INTRODUCTION
Document Page
Line graph
2002 2003 2004 2005 2006 2007 2008 2009 2010 2011 2012 2013 2014 2015
0
1000
2000
3000
4000
5000
6000
7000
Line Graph
Advertising Cost £'000s Sales £'000s
Document Page
Interpretation
Line graph of advertising cost and sales which is representing positive results as rise
in advertising cost of the business is leading to rise in sales volume of enterprise.
Further, in case if organization has allocated more funds in advertising then in the
same year sales revenue of firm has enhanced which is profitable for company and in
turn effective also as overall expenses can be recovered easily.
tabler-icon-diamond-filled.svg

Secure Best Marks with AI Grader

Need help grading? Try our AI Grader for instant feedback on your assignments.
Document Page
Pie chart
240
180160
140
130
Net Income Generated by 5
Branches of the company in 2015
London Manchester Edinburgh Cardiff Liverpool
Document Page
Bar chart
London Manchester Edinburgh Cardiff Liverpool
0
50
100
150
200
250
240
180 160 140 130
Net Income Generated by 5
Branches of the company in 2015
Document Page
Pie and bar chart of 5 branches of enterprise is
representing that overall income where income of
London branch is high as compared with others. This
high income level is representing overall effectiveness
of different branches in carrying out operations in the
market
Interpretation
tabler-icon-diamond-filled.svg

Paraphrase This Document

Need a fresh take? Get an instant paraphrase of this document with our AI Paraphraser
Document Page
Advertising and Sales data 2000-2013
2002 2003 2004 2005 2006 2007 2008 2009 2010 2011 2012 2013 2014 2015
0
1000
2000
3000
4000
5000
200 240 300 340 400 480 520 760 880 920 980 1020 1100 11701200 1400 1500 1800 2200 2300 2600 2800 2900 3100 3450 3600
4100
4670
Advertising and Sales data 2000-
2013
Advertising Cost £'000s Sales £'000s
Document Page
Scatter Plot on Advertising and Sales Costs
0 200 400 600 800 1000 1200 1400
0
500
1000
1500
2000
2500
3000
3500
4000
4500
5000
Advertising and Sales data 2002-2015
Document Page
Trend lines
2002 2003 2004 2005 2006 2007 2008 2009 2010 2011 2012 2013 2014 2015
0
200
400
600
800
1000
1200
1400 f(x) = 197.035373272055 exp( 0.141751876255229 x )
R² = 0.958414260153368
Advertising Cost £'000s
tabler-icon-diamond-filled.svg

Secure Best Marks with AI Grader

Need help grading? Try our AI Grader for instant feedback on your assignments.
Document Page
Trend line of advertising cost has been developed and
through this it can be said that by increasing the overall
cost of advertising in near future company can obtain
large amount of benefits as it can have positive impact
on the sales volume of company. Apart from this,
through effective promotion it will become for
enterprise to attract large number of customers and this
can assist in accomplishing overall long term
objectives of the organization.
Interpretation
Document Page
Sales
2002 2003 2004 2005 2006 2007 2008 2009 2010 2011 2012 2013 2014 2015
0
500
1000
1500
2000
2500
3000
3500
4000
4500
5000
f(x) = 1198.88327524441 exp( 0.0975870724629485 x )
R² = 0.975259927654925
Sales £'000s
Document Page
Trend line of sales of organization is also showing
positive results where rise in cost of advertising will
boost sales volume of business and through this
company can earn higher profits which are considered as
one of the main objective of business behind carrying
out overall operations in the market. Overall growth in
sales volume of business is beneficial for enterprise in
every possible manner. Therefore, it is recommended to
business to focus on advertising tools for enhancing
overall performance in the market and grabbing
opportunities.
Interpretation
tabler-icon-diamond-filled.svg

Paraphrase This Document

Need a fresh take? Get an instant paraphrase of this document with our AI Paraphraser
Document Page
From the analysis done it has been found that rising
advertising cost is fruitful for business. Further, every
brand is earning high income but of London’s branch it
is quite high as compared with others. Investment in
advertisement and other type of promotional activities
will be beneficial for business and through this higher
income can be earned easily. Apart from this, it will
provide large number of opportunities to business and
firm can sustain in the market for longer period of time
Conclusion
Document Page
REFERENCES
Sapsford, R. and Jupp, V., 2006. Data collection and analysis. Sage.
Cohen, J. and et. al., 2013. Applied Multiple Regression/ Correlation Analysis for the
Behavioral Sciences. Routledge.Kaplowitz,.
Ferrell, O. C. and Fraedrich, J., 2014. Business ethics: Ethical decision making & cases.
Cengage learning.
chevron_up_icon
1 out of 15
circle_padding
hide_on_mobile
zoom_out_icon
logo.png

Your All-in-One AI-Powered Toolkit for Academic Success.

Available 24*7 on WhatsApp / Email

[object Object]