Business Decision Making Report: Financial Analysis for ABC Restaurant
VerifiedAdded on 2019/12/03
|14
|4015
|477
Report
AI Summary
This report provides a comprehensive analysis of business decision-making for ABC Restaurant, focusing on the potential expansion of the restaurant chain in London. The report begins with an introduction to the importance of data-driven decision-making in the business context. It outlines the collection of primary and secondary data, including the design of a questionnaire to gather customer preferences and the use of financial data from the restaurant's past performance. The report presents the survey methodology and sampling frame used. It then delves into data analysis, including the use of representative values, measures of dispersion (range, variance, standard deviation), quartiles, percentiles, and the correlation coefficient to draw conclusions about the restaurant's financial performance and customer preferences. The report also incorporates the creation of graphs using spreadsheets to visualize data and create trend lines for forecasting. A formal business report format is used to present the findings and conclusions, including information processing and financial tools for decision-making, and a project plan with a critical path is determined to support the analysis and recommendations.

Business Decision Making
Paraphrase This Document
Need a fresh take? Get an instant paraphrase of this document with our AI Paraphraser
TABLE OF CONTENTS
INTRODUCTION............................................................................................3
TASK 1 .......................................................................................................3
1.1Create a plan for the collection of primary and secondary data for a
given business problem ..........................................................................3
1.2Present a survey methodology and sampling frame used..................3
1.3Design a questionnaire for a given business problem.........................4
2.1 Create information for decision making by summarising data using
representative values...............................................................................6
2.2 Analysis the results to draw valid conclusions in a business context.7
2.3 Analysis data using measures of dispersion to inform a given
business scenario.....................................................................................7
2.4 Explain how quartiles, percentiles and the correlation coefficient are
used to draw useful conclusions in a business context............................8
TASK 2 ......................................................................................................10
3.1Produce graphs using spreadsheets and draw valid conclusions......10
3.2Create trend lines in spreadsheet graphs to assist in forecasting ....10
3.4Formal business report......................................................................11
4.1 Information processing tools............................................................11
4.2 Prepare a project plan for an activity and determine the critical path
...............................................................................................................11
...............................................................................................................12
...............................................................................................................12
4.3 Financial tools for decision making..................................................13
REFERENCES ............................................................................................15
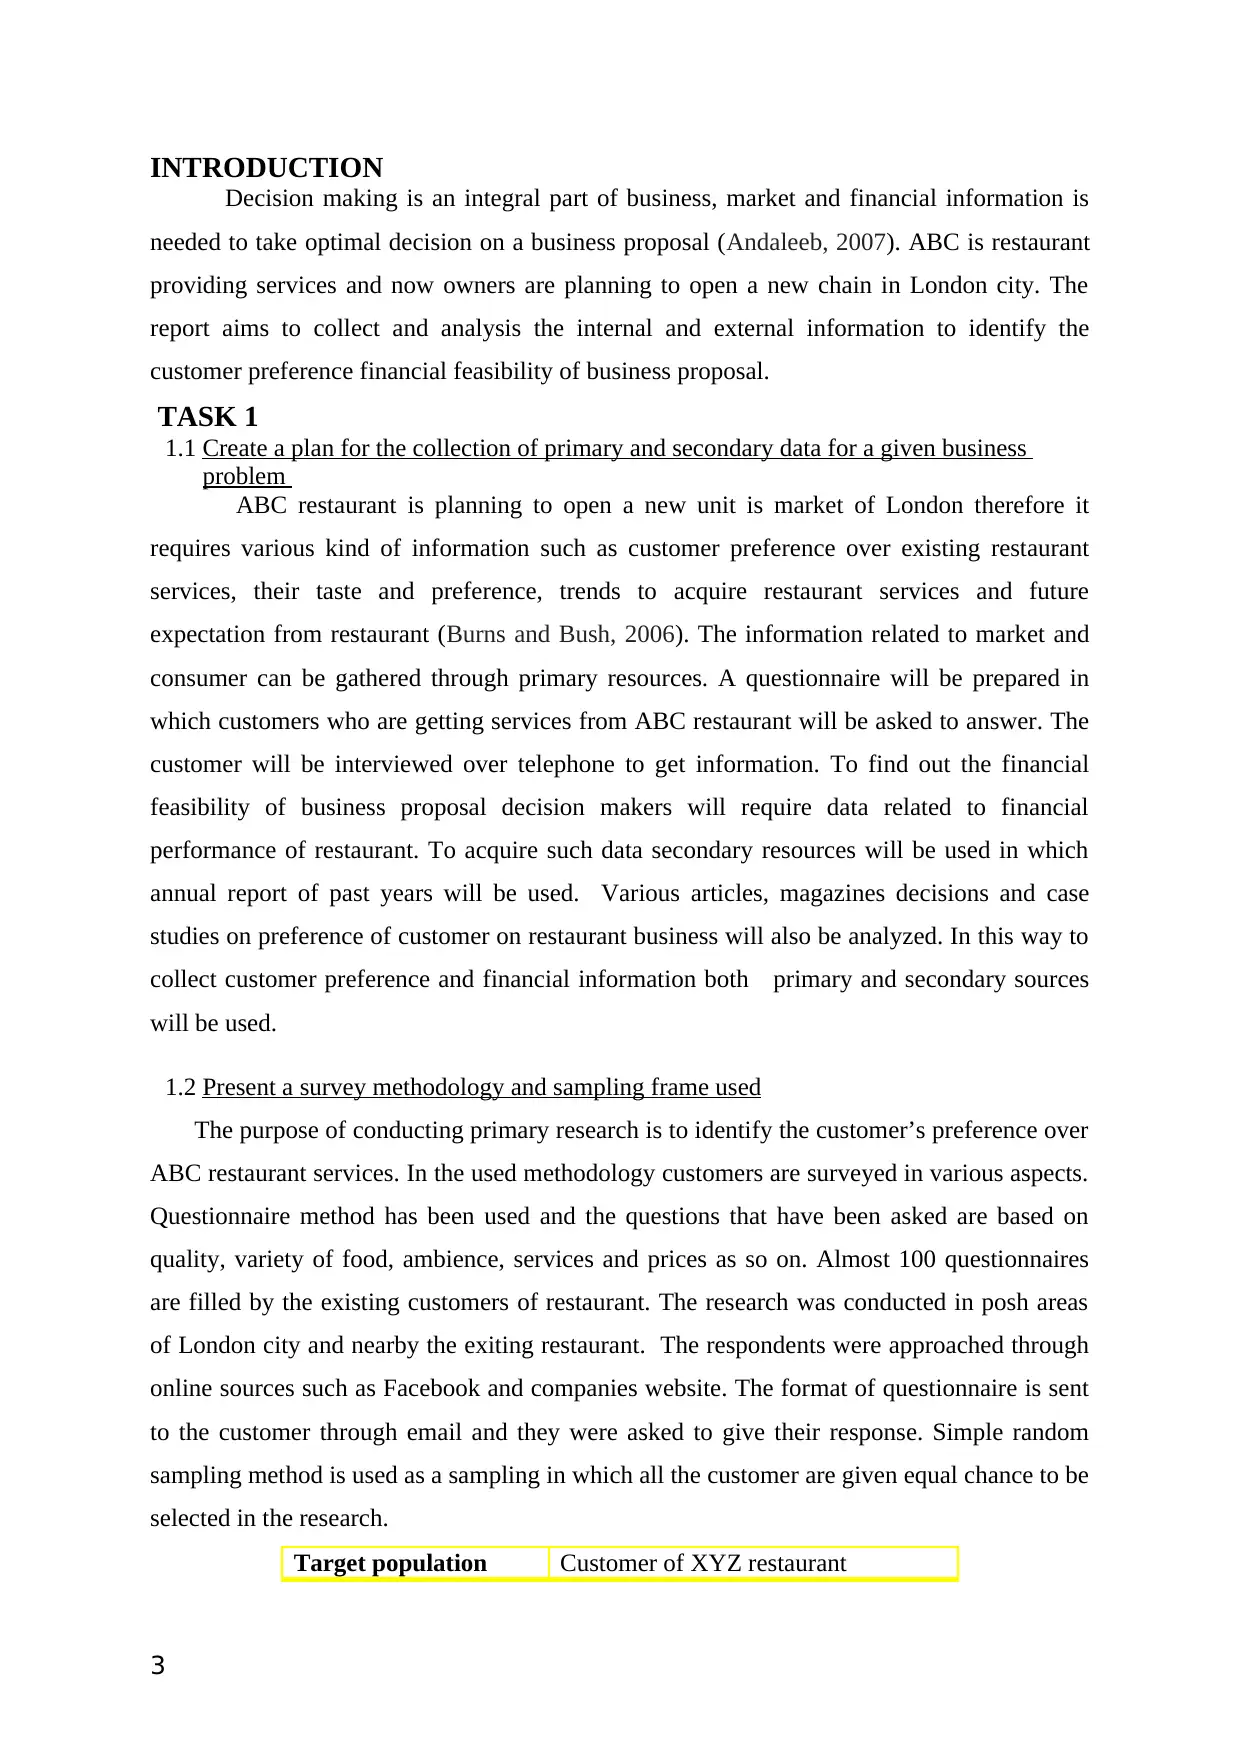
INTRODUCTION
Decision making is an integral part of business, market and financial information is
needed to take optimal decision on a business proposal (Andaleeb, 2007). ABC is restaurant
providing services and now owners are planning to open a new chain in London city. The
report aims to collect and analysis the internal and external information to identify the
customer preference financial feasibility of business proposal.
TASK 1
1.1 Create a plan for the collection of primary and secondary data for a given business
problem
ABC restaurant is planning to open a new unit is market of London therefore it
requires various kind of information such as customer preference over existing restaurant
services, their taste and preference, trends to acquire restaurant services and future
expectation from restaurant (Burns and Bush, 2006). The information related to market and
consumer can be gathered through primary resources. A questionnaire will be prepared in
which customers who are getting services from ABC restaurant will be asked to answer. The
customer will be interviewed over telephone to get information. To find out the financial
feasibility of business proposal decision makers will require data related to financial
performance of restaurant. To acquire such data secondary resources will be used in which
annual report of past years will be used. Various articles, magazines decisions and case
studies on preference of customer on restaurant business will also be analyzed. In this way to
collect customer preference and financial information both primary and secondary sources
will be used.
1.2 Present a survey methodology and sampling frame used
The purpose of conducting primary research is to identify the customer’s preference over
ABC restaurant services. In the used methodology customers are surveyed in various aspects.
Questionnaire method has been used and the questions that have been asked are based on
quality, variety of food, ambience, services and prices as so on. Almost 100 questionnaires
are filled by the existing customers of restaurant. The research was conducted in posh areas
of London city and nearby the exiting restaurant. The respondents were approached through
online sources such as Facebook and companies website. The format of questionnaire is sent
to the customer through email and they were asked to give their response. Simple random
sampling method is used as a sampling in which all the customer are given equal chance to be
selected in the research.
Target population Customer of XYZ restaurant
3
⊘ This is a preview!⊘
Do you want full access?
Subscribe today to unlock all pages.
Trusted by 1+ million students worldwide
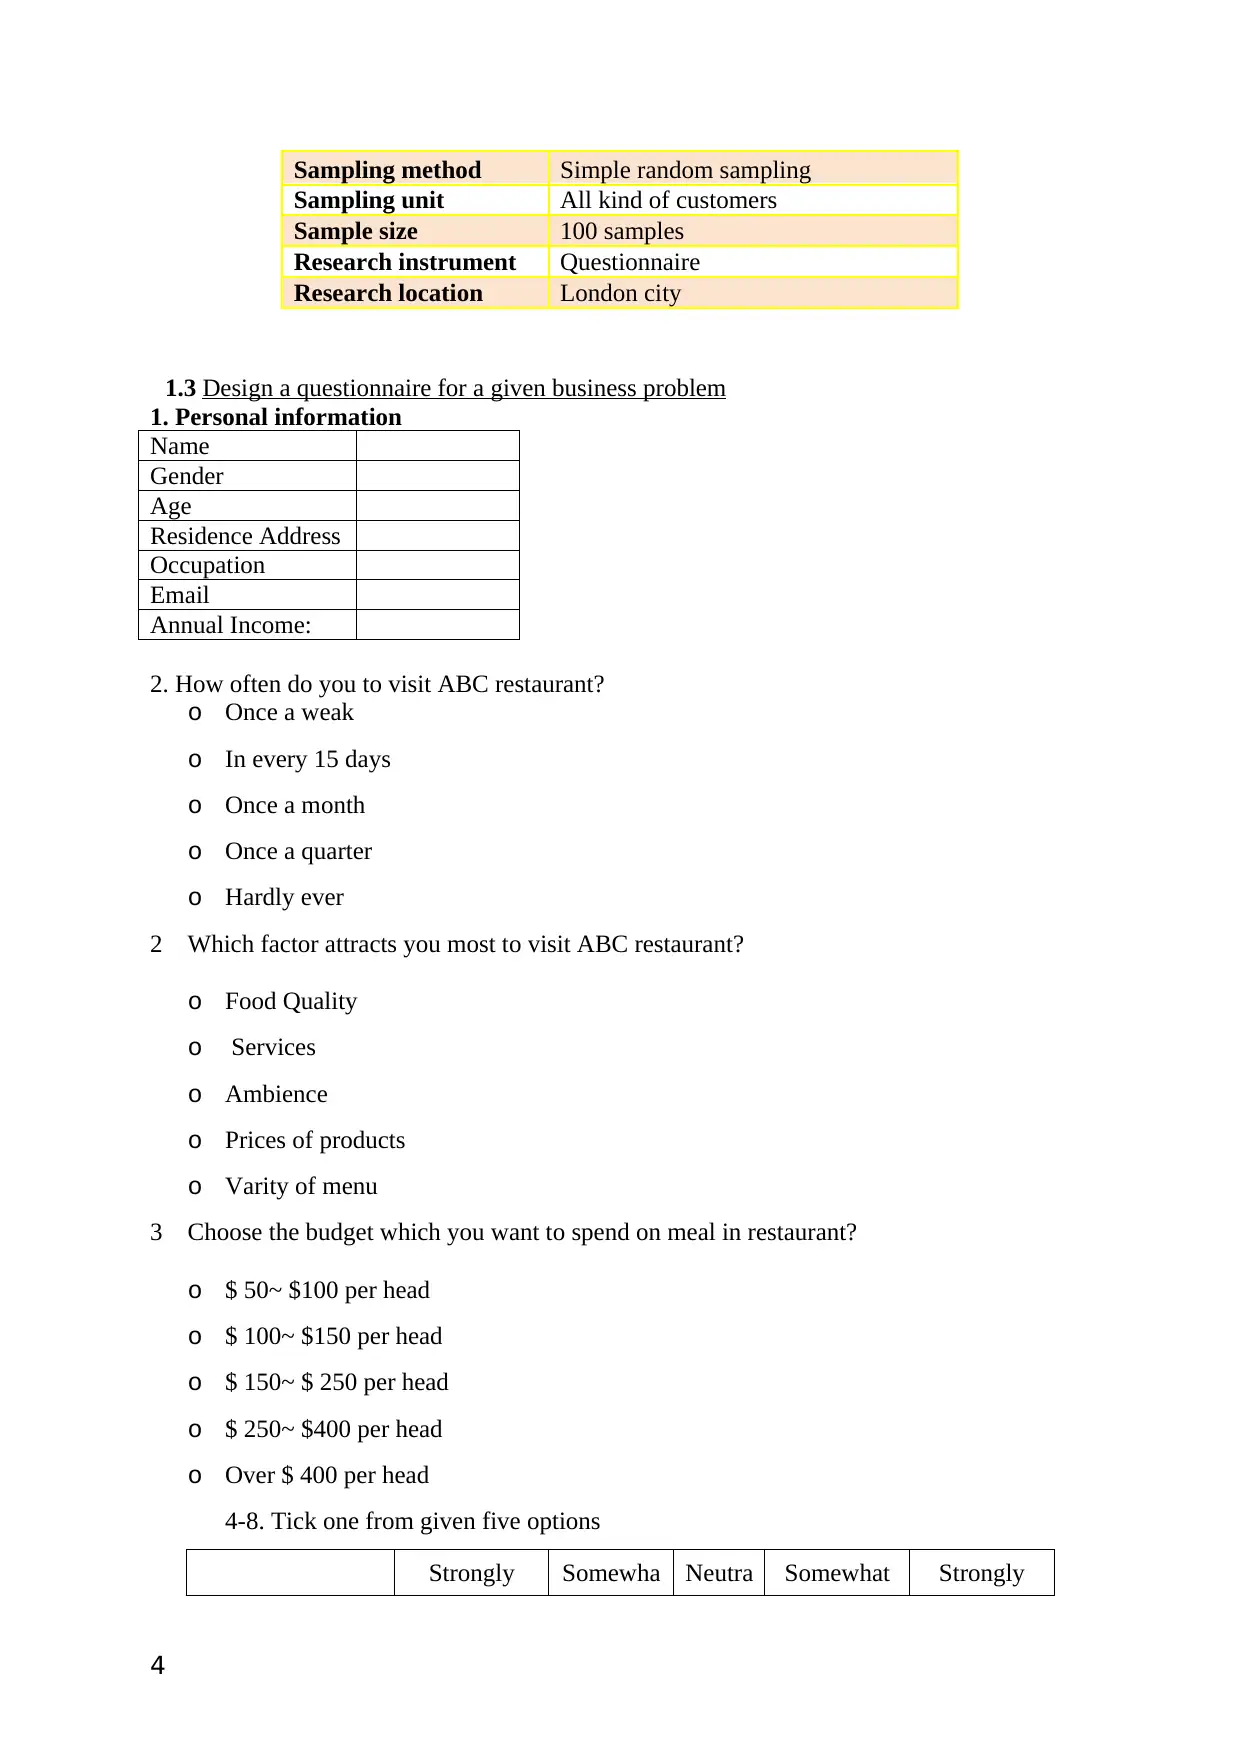
Sampling method Simple random sampling
Sampling unit All kind of customers
Sample size 100 samples
Research instrument Questionnaire
Research location London city
1.3 Design a questionnaire for a given business problem
1. Personal information
Name
Gender
Age
Residence Address
Occupation
Email
Annual Income:
2. How often do you to visit ABC restaurant?
o Once a weak
o In every 15 days
o Once a month
o Once a quarter
o Hardly ever
2 Which factor attracts you most to visit ABC restaurant?
o Food Quality
o Services
o Ambience
o Prices of products
o Varity of menu
3 Choose the budget which you want to spend on meal in restaurant?
o $ 50~ $100 per head
o $ 100~ $150 per head
o $ 150~ $ 250 per head
o $ 250~ $400 per head
o Over $ 400 per head
4-8. Tick one from given five options
Strongly Somewha Neutra Somewhat Strongly
4
Sampling unit All kind of customers
Sample size 100 samples
Research instrument Questionnaire
Research location London city
1.3 Design a questionnaire for a given business problem
1. Personal information
Name
Gender
Age
Residence Address
Occupation
Annual Income:
2. How often do you to visit ABC restaurant?
o Once a weak
o In every 15 days
o Once a month
o Once a quarter
o Hardly ever
2 Which factor attracts you most to visit ABC restaurant?
o Food Quality
o Services
o Ambience
o Prices of products
o Varity of menu
3 Choose the budget which you want to spend on meal in restaurant?
o $ 50~ $100 per head
o $ 100~ $150 per head
o $ 150~ $ 250 per head
o $ 250~ $400 per head
o Over $ 400 per head
4-8. Tick one from given five options
Strongly Somewha Neutra Somewhat Strongly
4
Paraphrase This Document
Need a fresh take? Get an instant paraphrase of this document with our AI Paraphraser
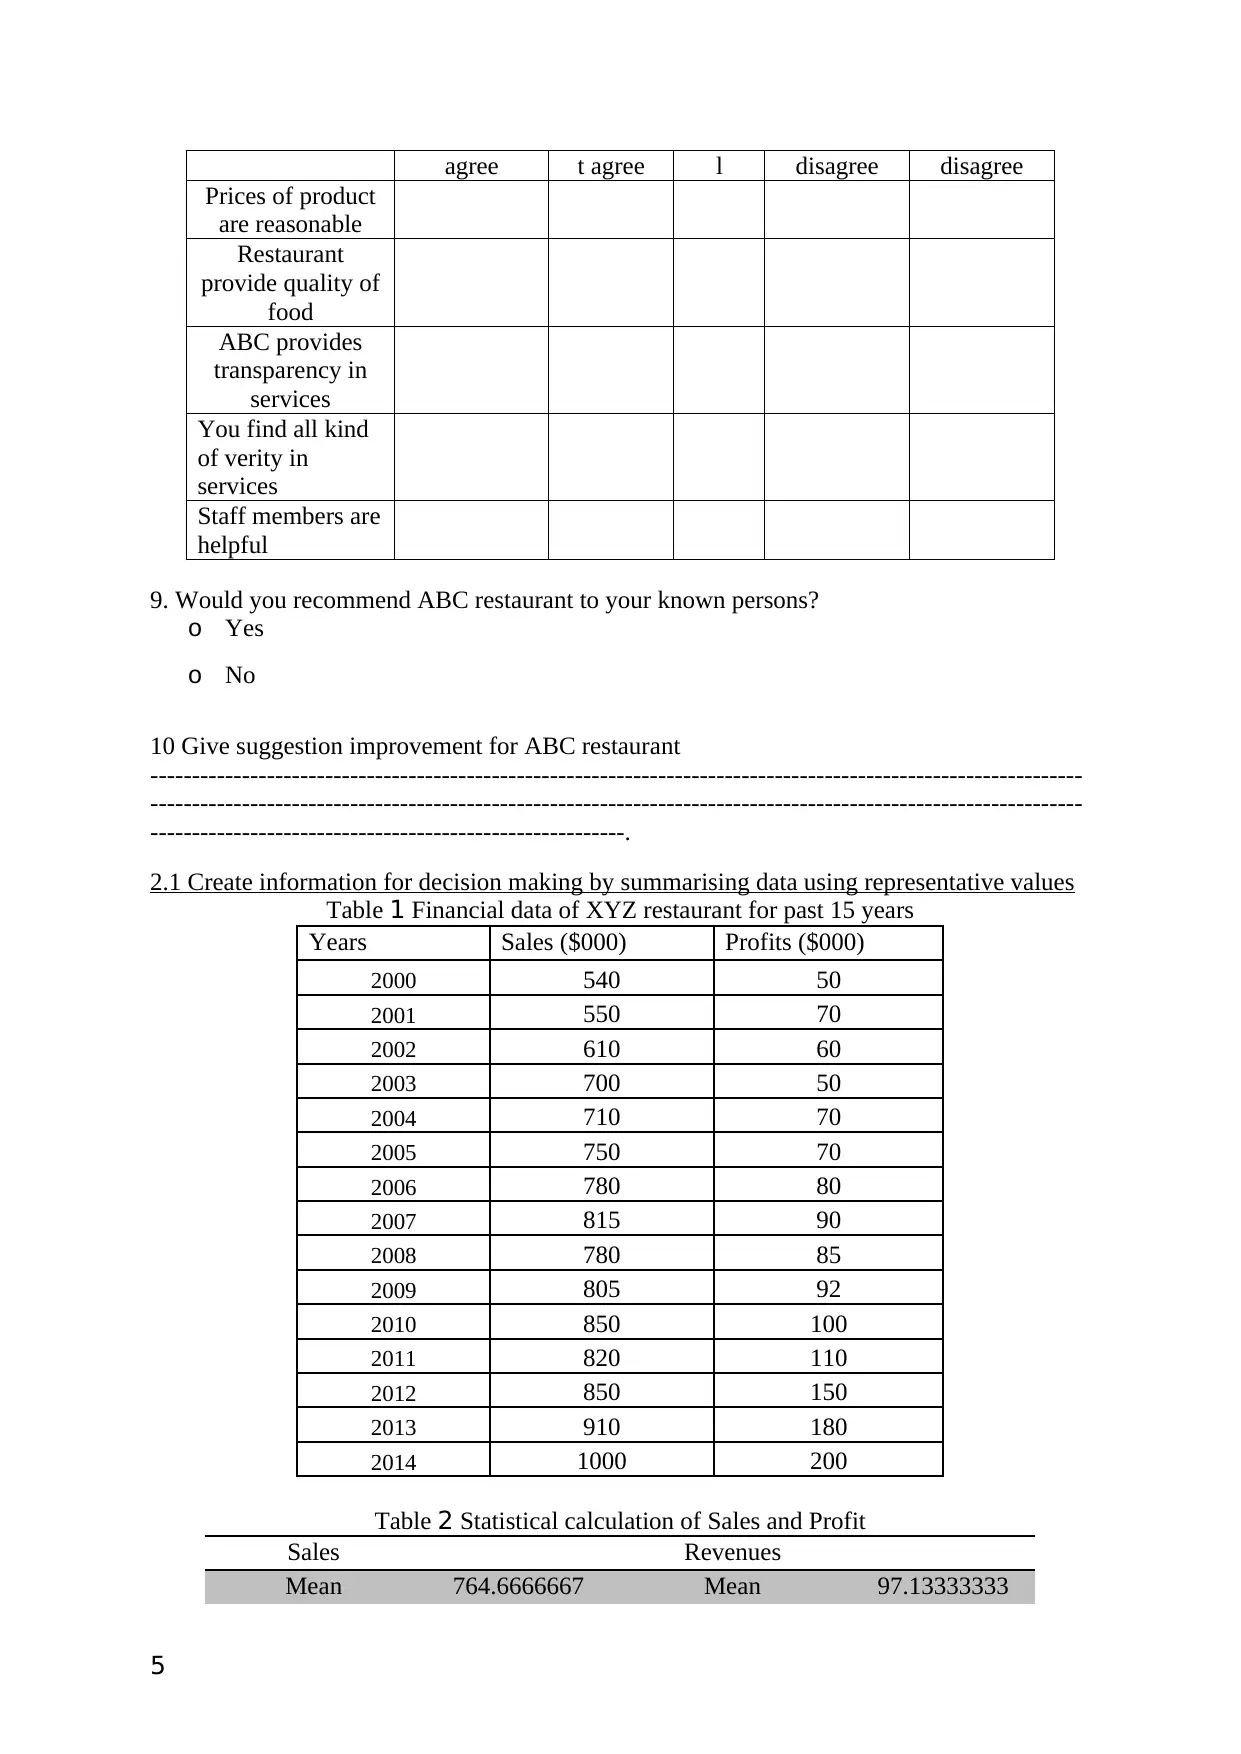
agree t agree l disagree disagree
Prices of product
are reasonable
Restaurant
provide quality of
food
ABC provides
transparency in
services
You find all kind
of verity in
services
Staff members are
helpful
9. Would you recommend ABC restaurant to your known persons?
o Yes
o No
10 Give suggestion improvement for ABC restaurant
----------------------------------------------------------------------------------------------------------------
----------------------------------------------------------------------------------------------------------------
---------------------------------------------------------.
2.1 Create information for decision making by summarising data using representative values
Table 1 Financial data of XYZ restaurant for past 15 years
Years Sales ($000) Profits ($000)
2000 540 50
2001 550 70
2002 610 60
2003 700 50
2004 710 70
2005 750 70
2006 780 80
2007 815 90
2008 780 85
2009 805 92
2010 850 100
2011 820 110
2012 850 150
2013 910 180
2014 1000 200
Table 2 Statistical calculation of Sales and Profit
Sales Revenues
Mean 764.6666667 Mean 97.13333333
5
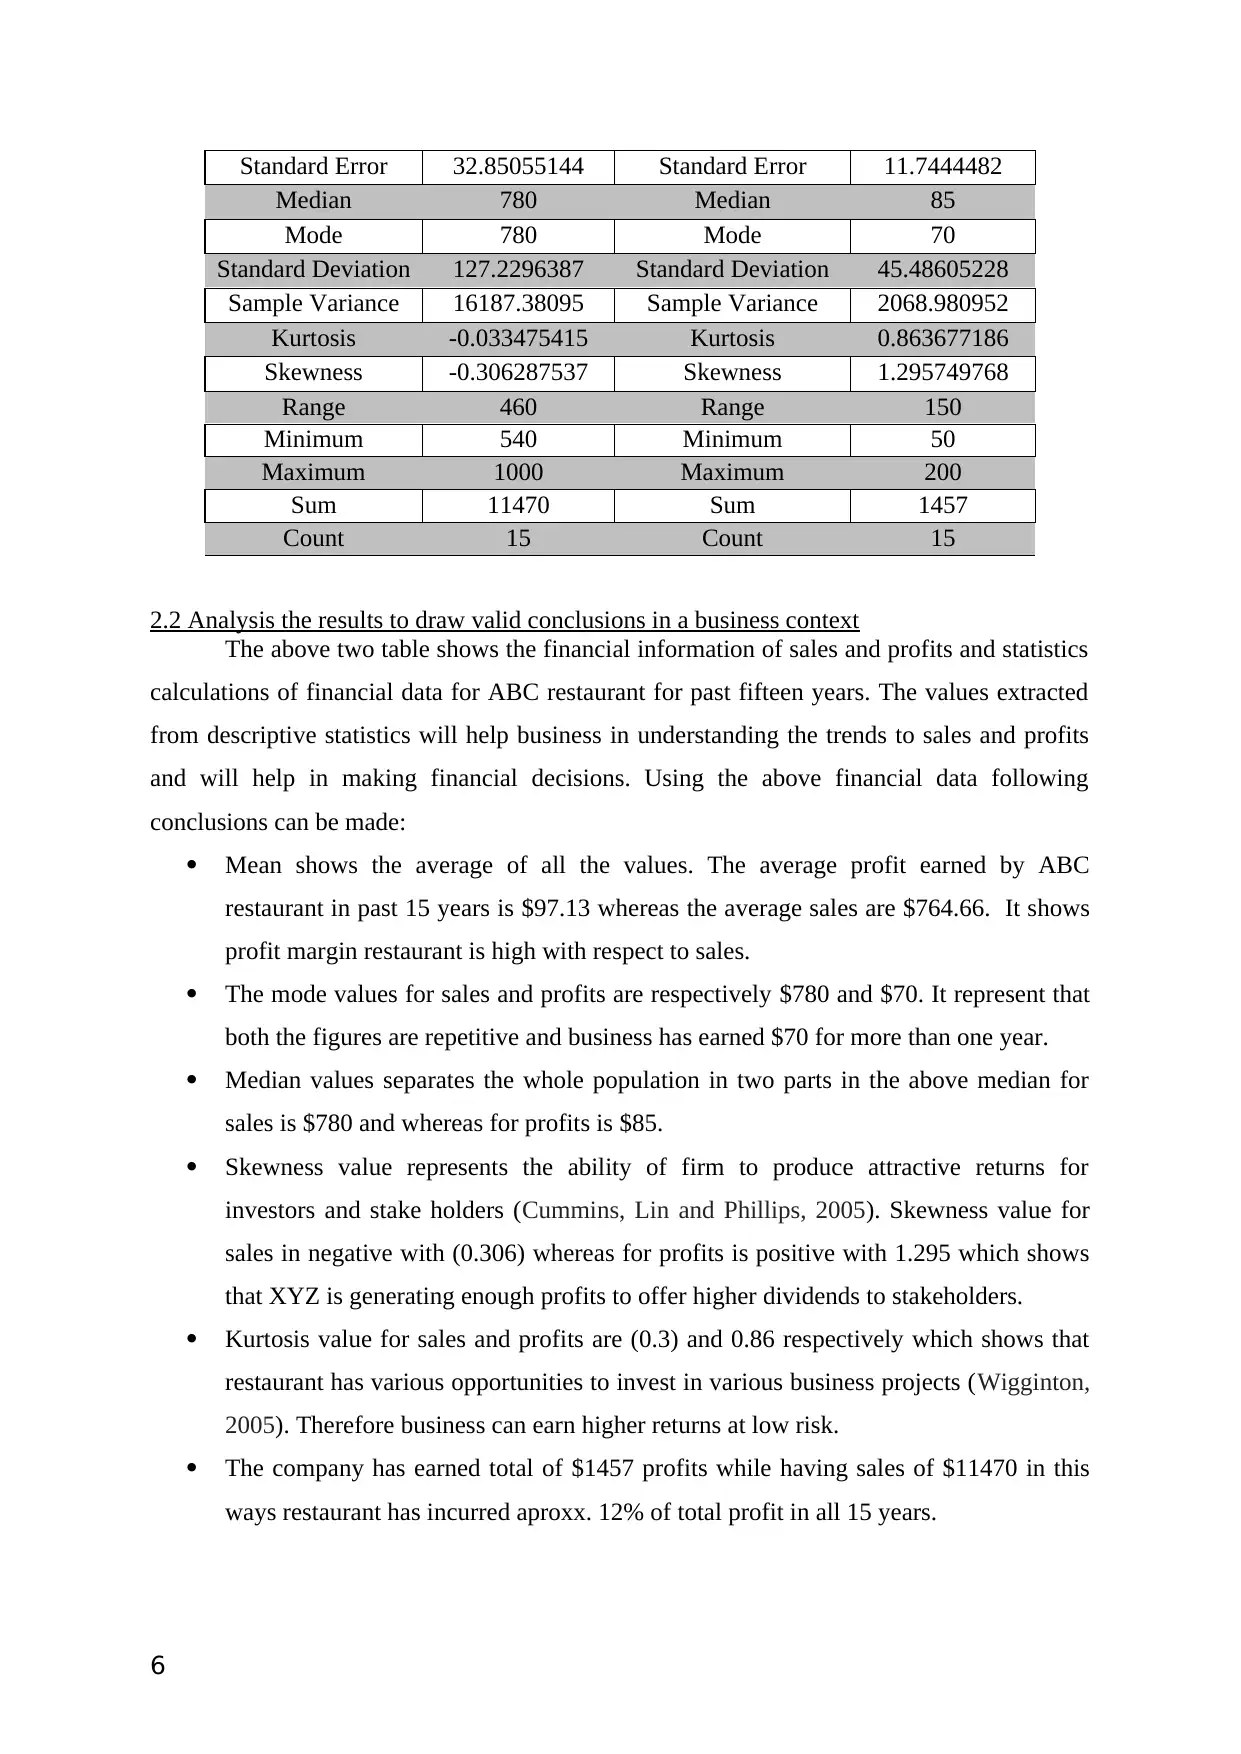
Standard Error 32.85055144 Standard Error 11.7444482
Median 780 Median 85
Mode 780 Mode 70
Standard Deviation 127.2296387 Standard Deviation 45.48605228
Sample Variance 16187.38095 Sample Variance 2068.980952
Kurtosis -0.033475415 Kurtosis 0.863677186
Skewness -0.306287537 Skewness 1.295749768
Range 460 Range 150
Minimum 540 Minimum 50
Maximum 1000 Maximum 200
Sum 11470 Sum 1457
Count 15 Count 15
2.2 Analysis the results to draw valid conclusions in a business context
The above two table shows the financial information of sales and profits and statistics
calculations of financial data for ABC restaurant for past fifteen years. The values extracted
from descriptive statistics will help business in understanding the trends to sales and profits
and will help in making financial decisions. Using the above financial data following
conclusions can be made:
Mean shows the average of all the values. The average profit earned by ABC
restaurant in past 15 years is $97.13 whereas the average sales are $764.66. It shows
profit margin restaurant is high with respect to sales.
The mode values for sales and profits are respectively $780 and $70. It represent that
both the figures are repetitive and business has earned $70 for more than one year.
Median values separates the whole population in two parts in the above median for
sales is $780 and whereas for profits is $85.
Skewness value represents the ability of firm to produce attractive returns for
investors and stake holders (Cummins, Lin and Phillips, 2005). Skewness value for
sales in negative with (0.306) whereas for profits is positive with 1.295 which shows
that XYZ is generating enough profits to offer higher dividends to stakeholders.
Kurtosis value for sales and profits are (0.3) and 0.86 respectively which shows that
restaurant has various opportunities to invest in various business projects (Wigginton,
2005). Therefore business can earn higher returns at low risk.
The company has earned total of $1457 profits while having sales of $11470 in this
ways restaurant has incurred aproxx. 12% of total profit in all 15 years.
6
⊘ This is a preview!⊘
Do you want full access?
Subscribe today to unlock all pages.
Trusted by 1+ million students worldwide
2.3 Analysis data using measures of dispersion to inform a given business scenario
There are three types of values come under measures of dispersion such as range,
standard deviation and variance. All the three values will help business in making optimal
decision on business plans. The financial performance of restaurant has been analysed with
the help of following measures of dispersion.
Range: Range indicates difference between highest and lowest value for given values
(Zivot, 2007). The range of sales is 460 on the other hand range for profit is 150. This
indicated the business have ability to generate higher profits and revenues in a short run.
Range = Higher value – shorter value
Range (Sales) = 1000-540=460
Range (Profits) =200-50=150
Variance: Variance of value series indicates how far the values are spread out and
represents the mean of the squares of individual differences from average value (Mun, 2006).
The variance for sales is 16187.38 and variance for profits is 2068.98. Both the values are
high indication that all the date is spread in large units.
Standard deviation: The square root of various called as standard deviation
(Ramsay, 2006). SD for sales and profits are127.22 and 45.48 respectively, indicates that the
financial data are largely spread in individual years.
2.4 Explain how quartiles, percentiles and the correlation coefficient are used to draw useful
conclusions in a business context
Following tables show the calculation of quartiles, percentiles and the correlation
coefficient and helps in making conclusion of financial decisions of firm
Quartile
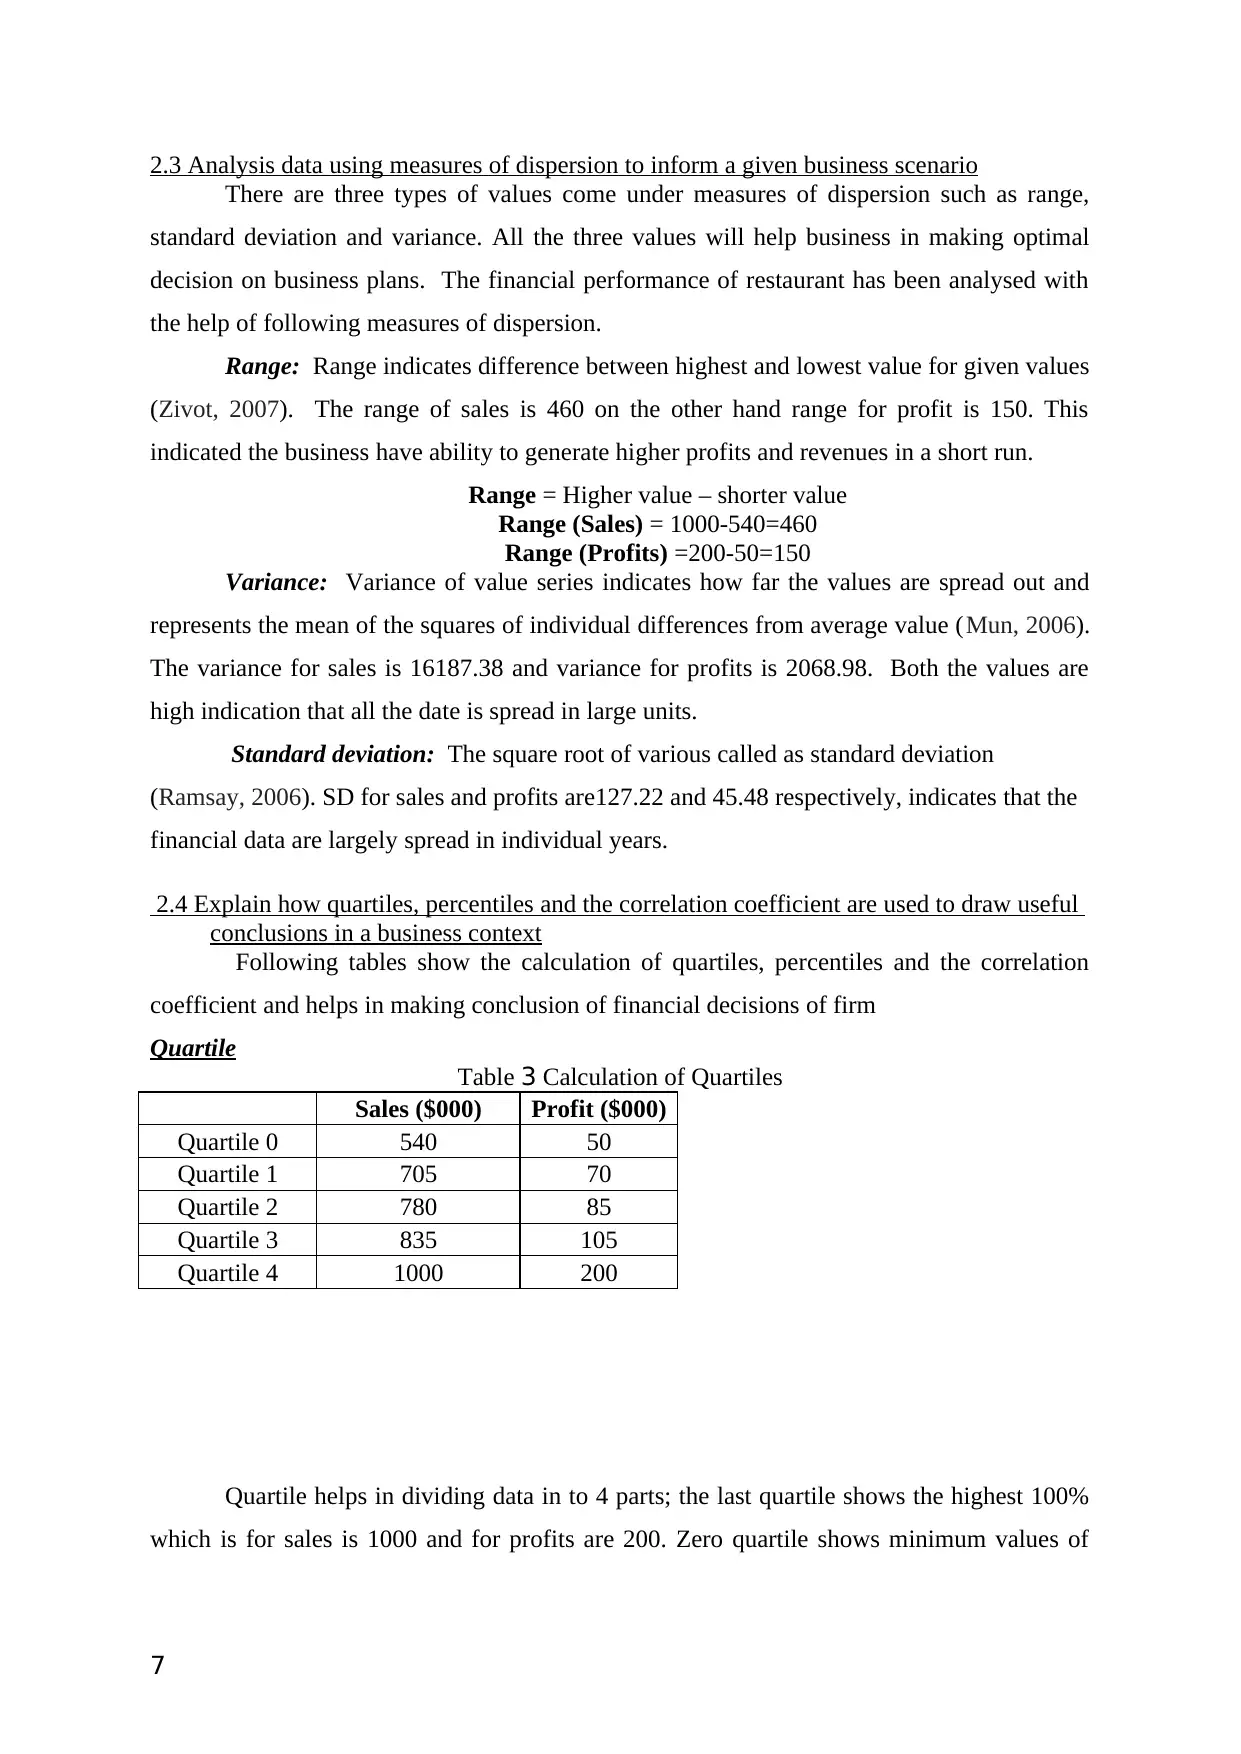
Table 3 Calculation of Quartiles
Sales ($000) Profit ($000)
Quartile 0 540 50
Quartile 1 705 70
Quartile 2 780 85
Quartile 3 835 105
Quartile 4 1000 200
Quartile helps in dividing data in to 4 parts; the last quartile shows the highest 100%
which is for sales is 1000 and for profits are 200. Zero quartile shows minimum values of
7
There are three types of values come under measures of dispersion such as range,
standard deviation and variance. All the three values will help business in making optimal
decision on business plans. The financial performance of restaurant has been analysed with
the help of following measures of dispersion.
Range: Range indicates difference between highest and lowest value for given values
(Zivot, 2007). The range of sales is 460 on the other hand range for profit is 150. This
indicated the business have ability to generate higher profits and revenues in a short run.
Range = Higher value – shorter value
Range (Sales) = 1000-540=460
Range (Profits) =200-50=150
Variance: Variance of value series indicates how far the values are spread out and
represents the mean of the squares of individual differences from average value (Mun, 2006).
The variance for sales is 16187.38 and variance for profits is 2068.98. Both the values are
high indication that all the date is spread in large units.
Standard deviation: The square root of various called as standard deviation
(Ramsay, 2006). SD for sales and profits are127.22 and 45.48 respectively, indicates that the
financial data are largely spread in individual years.
2.4 Explain how quartiles, percentiles and the correlation coefficient are used to draw useful
conclusions in a business context
Following tables show the calculation of quartiles, percentiles and the correlation
coefficient and helps in making conclusion of financial decisions of firm
Quartile
Table 3 Calculation of Quartiles
Sales ($000) Profit ($000)
Quartile 0 540 50
Quartile 1 705 70
Quartile 2 780 85
Quartile 3 835 105
Quartile 4 1000 200
Quartile helps in dividing data in to 4 parts; the last quartile shows the highest 100%
which is for sales is 1000 and for profits are 200. Zero quartile shows minimum values of
7
Paraphrase This Document
Need a fresh take? Get an instant paraphrase of this document with our AI Paraphraser
profits and sales in among all years are $50 and $540. $85 was the average profits for all the
years, helps in making decision for future.
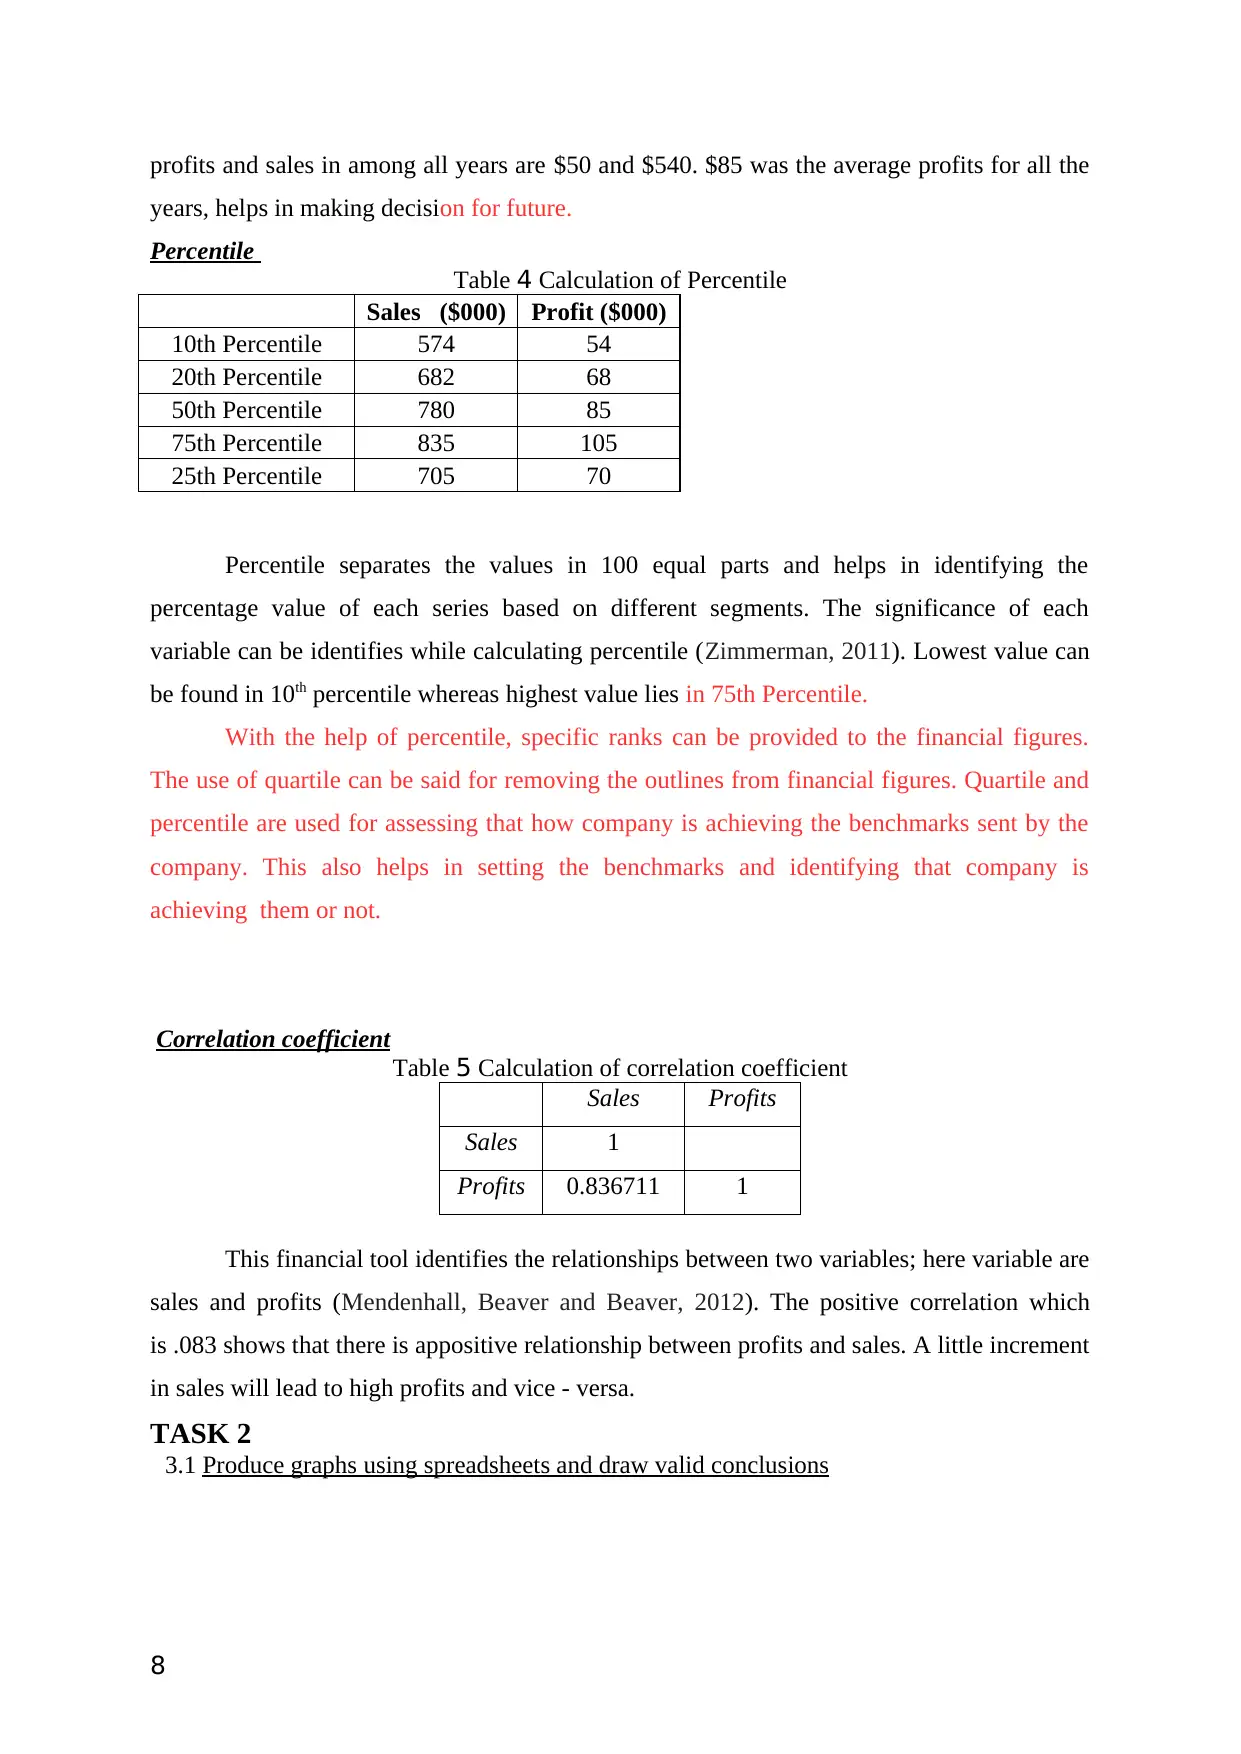
Percentile
Table 4 Calculation of Percentile
Sales ($000) Profit ($000)
10th Percentile 574 54
20th Percentile 682 68
50th Percentile 780 85
75th Percentile 835 105
25th Percentile 705 70
Percentile separates the values in 100 equal parts and helps in identifying the
percentage value of each series based on different segments. The significance of each
variable can be identifies while calculating percentile (Zimmerman, 2011). Lowest value can
be found in 10th percentile whereas highest value lies in 75th Percentile.
With the help of percentile, specific ranks can be provided to the financial figures.
The use of quartile can be said for removing the outlines from financial figures. Quartile and
percentile are used for assessing that how company is achieving the benchmarks sent by the
company. This also helps in setting the benchmarks and identifying that company is
achieving them or not.
Correlation coefficient
Table 5 Calculation of correlation coefficient
Sales Profits
Sales 1
Profits 0.836711 1
This financial tool identifies the relationships between two variables; here variable are
sales and profits (Mendenhall, Beaver and Beaver, 2012). The positive correlation which
is .083 shows that there is appositive relationship between profits and sales. A little increment
in sales will lead to high profits and vice - versa.
TASK 2
3.1 Produce graphs using spreadsheets and draw valid conclusions
8
years, helps in making decision for future.
Percentile
Table 4 Calculation of Percentile
Sales ($000) Profit ($000)
10th Percentile 574 54
20th Percentile 682 68
50th Percentile 780 85
75th Percentile 835 105
25th Percentile 705 70
Percentile separates the values in 100 equal parts and helps in identifying the
percentage value of each series based on different segments. The significance of each
variable can be identifies while calculating percentile (Zimmerman, 2011). Lowest value can
be found in 10th percentile whereas highest value lies in 75th Percentile.
With the help of percentile, specific ranks can be provided to the financial figures.
The use of quartile can be said for removing the outlines from financial figures. Quartile and
percentile are used for assessing that how company is achieving the benchmarks sent by the
company. This also helps in setting the benchmarks and identifying that company is
achieving them or not.
Correlation coefficient
Table 5 Calculation of correlation coefficient
Sales Profits
Sales 1
Profits 0.836711 1
This financial tool identifies the relationships between two variables; here variable are
sales and profits (Mendenhall, Beaver and Beaver, 2012). The positive correlation which
is .083 shows that there is appositive relationship between profits and sales. A little increment
in sales will lead to high profits and vice - versa.
TASK 2
3.1 Produce graphs using spreadsheets and draw valid conclusions
8
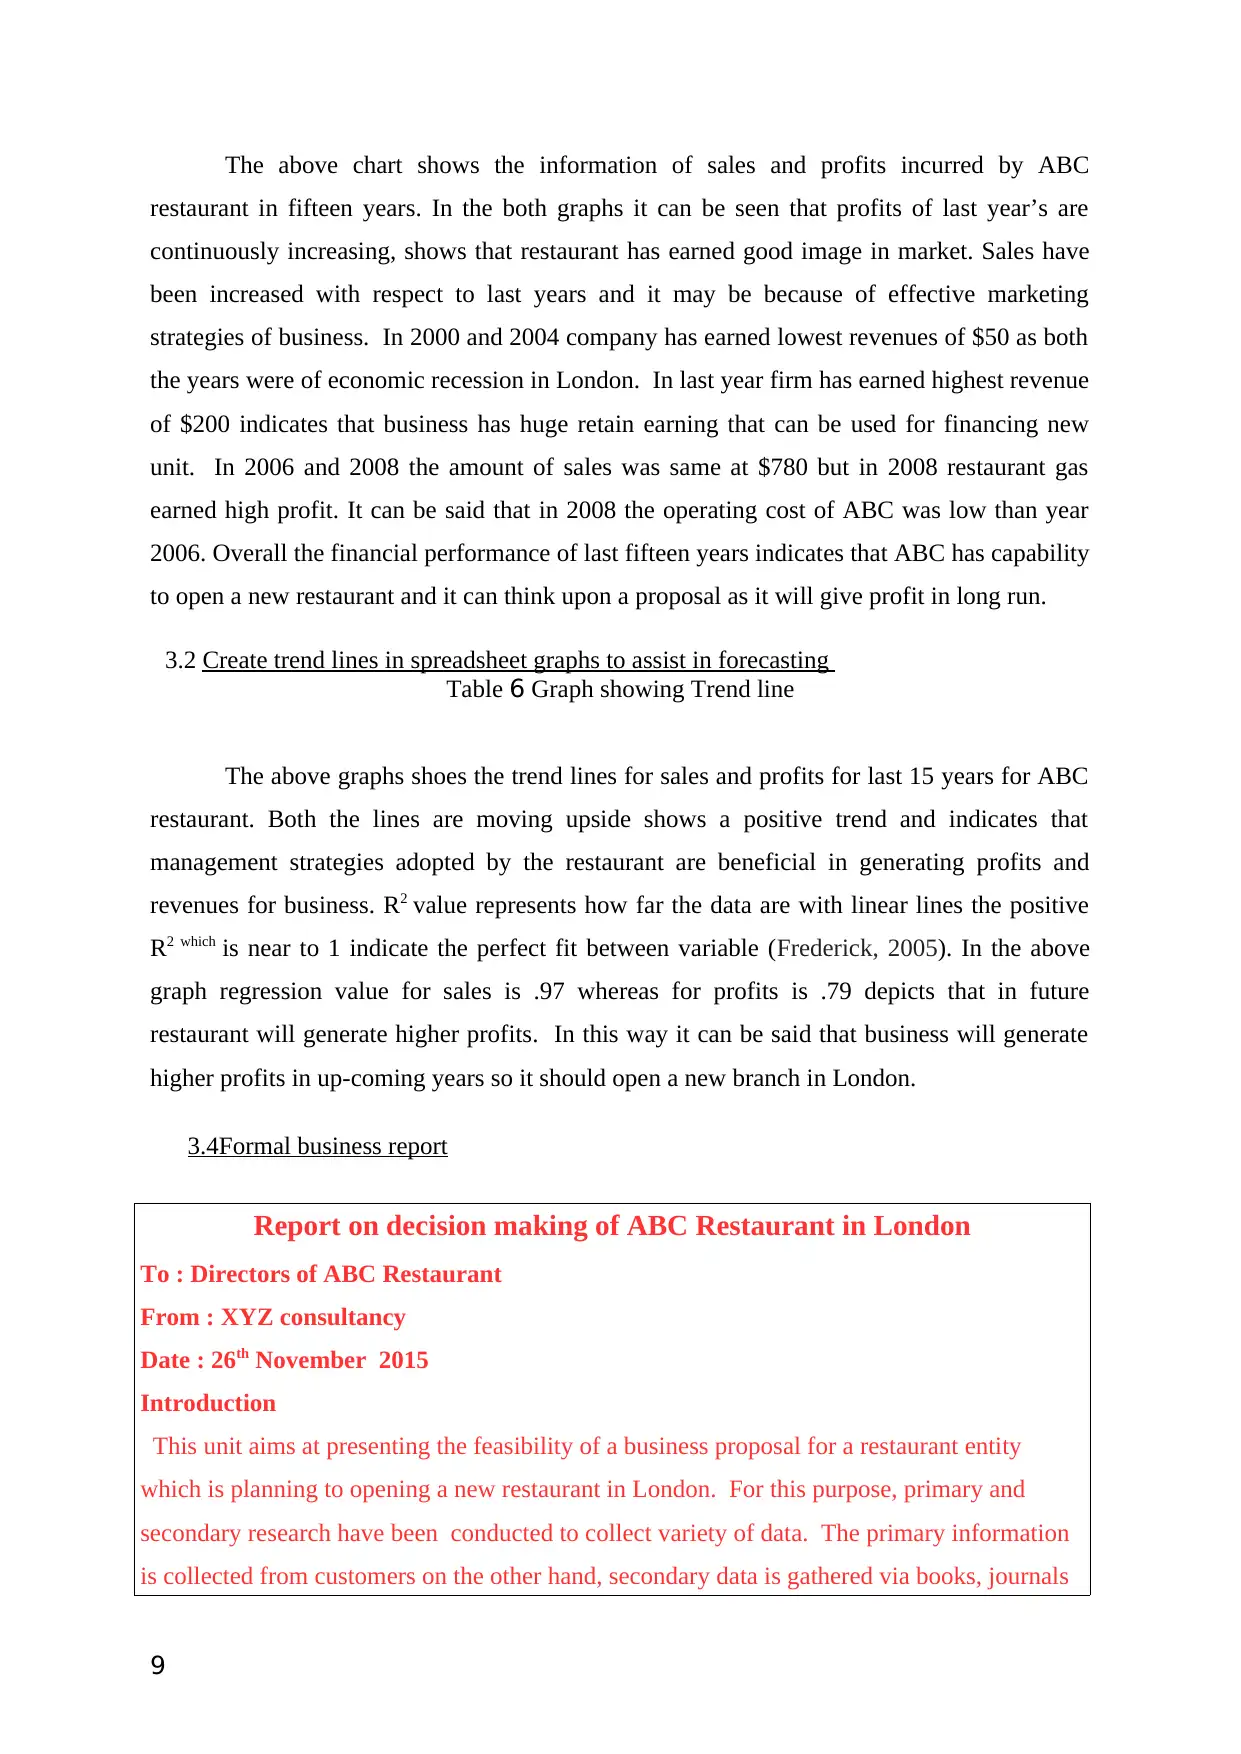
The above chart shows the information of sales and profits incurred by ABC
restaurant in fifteen years. In the both graphs it can be seen that profits of last year’s are
continuously increasing, shows that restaurant has earned good image in market. Sales have
been increased with respect to last years and it may be because of effective marketing
strategies of business. In 2000 and 2004 company has earned lowest revenues of $50 as both
the years were of economic recession in London. In last year firm has earned highest revenue
of $200 indicates that business has huge retain earning that can be used for financing new
unit. In 2006 and 2008 the amount of sales was same at $780 but in 2008 restaurant gas
earned high profit. It can be said that in 2008 the operating cost of ABC was low than year
2006. Overall the financial performance of last fifteen years indicates that ABC has capability
to open a new restaurant and it can think upon a proposal as it will give profit in long run.
3.2 Create trend lines in spreadsheet graphs to assist in forecasting
Table 6 Graph showing Trend line
The above graphs shoes the trend lines for sales and profits for last 15 years for ABC
restaurant. Both the lines are moving upside shows a positive trend and indicates that
management strategies adopted by the restaurant are beneficial in generating profits and
revenues for business. R2 value represents how far the data are with linear lines the positive
R2 which is near to 1 indicate the perfect fit between variable (Frederick, 2005). In the above
graph regression value for sales is .97 whereas for profits is .79 depicts that in future
restaurant will generate higher profits. In this way it can be said that business will generate
higher profits in up-coming years so it should open a new branch in London.
3.4Formal business report
Report on decision making of ABC Restaurant in London
To : Directors of ABC Restaurant
From : XYZ consultancy
Date : 26th November 2015
Introduction
This unit aims at presenting the feasibility of a business proposal for a restaurant entity
which is planning to opening a new restaurant in London. For this purpose, primary and
secondary research have been conducted to collect variety of data. The primary information
is collected from customers on the other hand, secondary data is gathered via books, journals
9
⊘ This is a preview!⊘
Do you want full access?
Subscribe today to unlock all pages.
Trusted by 1+ million students worldwide
and online sources and company's report.
Methods
In order to collect the primary data pertaining to consumer preference a questionnaire has
been prepared as the existing customers of restaurants are asked to give their responses. Most
of the respondents were approached in the restaurants at the time of taking services and rest
were approached through online. To assess the feasibility of business proposal the tactics
such as descriptive statistics tools and investment analysis techniques are used. However,
correlation, mean, median, quartile and percentile are for interpreting secondary information
trend lines are used. To find out the financial feasibility of project record of past 15 years
sales and profits have been extracted through secondary sources such as annual reports.
Statistical calculation of Sales and Profit have been done in excel sheet and used for making
conclusion
Findings
From the analysis, it has been assessed that past performance of restaurant in terms of profits
and sales was favourable as both the variable are highly correlated that represent the
opportunities of earning higher profits and sales in the future.
Conclusion
From the analysis it can be said that new business proposal is feasible for firm and it can open
a new branch to earn more profits.
Signature
XYZ consultancy
4.1 Information processing tools
Management information system: MIS is an information processing tool which
allows business to exchange the information from one place to another in the organization.
Whit the help of this tool corporate entity can store all the important information in the
organization (Zikmund, 2012).
Intranet facility: The information tool used in the organization to flow the date from
one department to another is called is intranet. This tool is useful in keeping information
confidential within the business.
Customer relationship management: Now a day’s companies are using such tools
to store the information related to customers and their purchasing behaviour.
10
Paraphrase This Document
Need a fresh take? Get an instant paraphrase of this document with our AI Paraphraser
Decision support systems: Mostly top level managers or board of directors use
decision support system in which they pass information to middle level managers or other
employees pertaining to a decision taken by them.
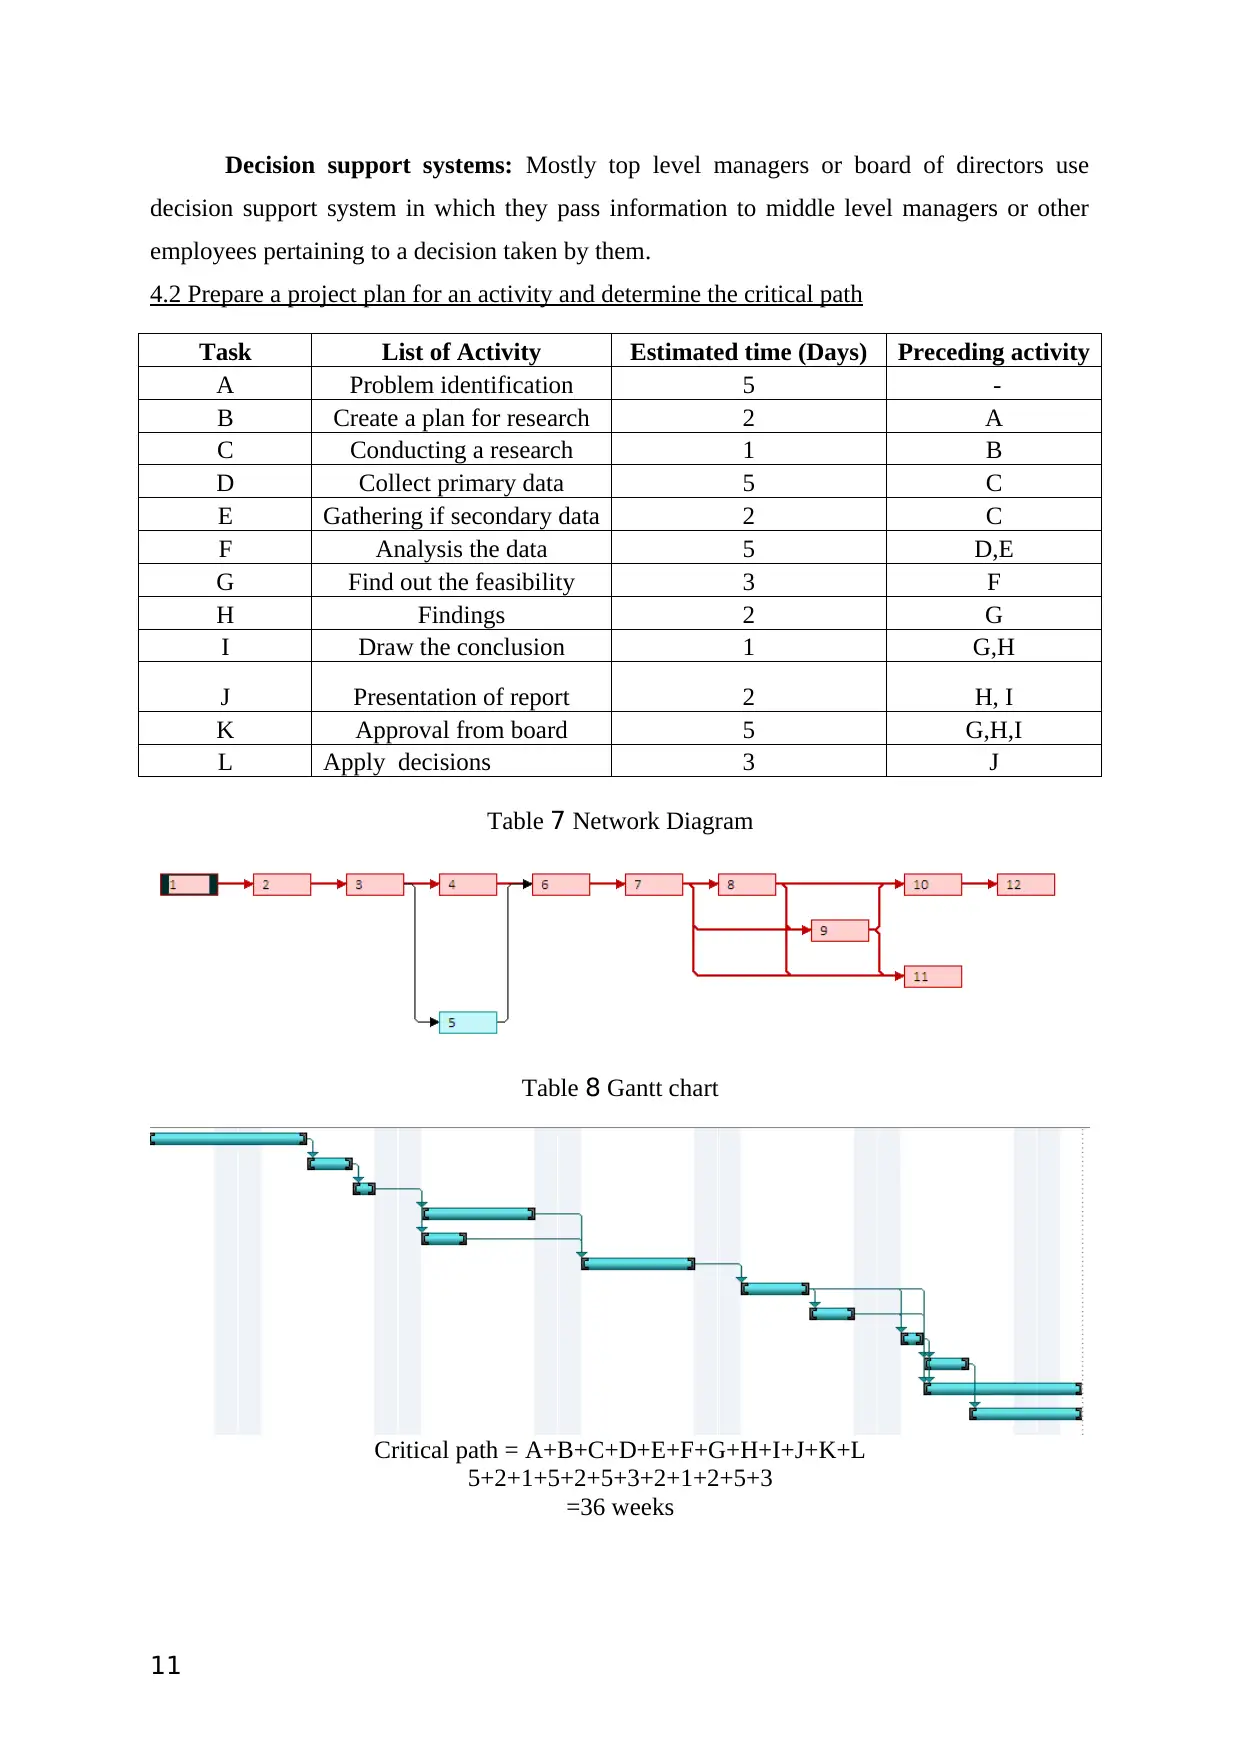
4.2 Prepare a project plan for an activity and determine the critical path
Task List of Activity Estimated time (Days) Preceding activity
A Problem identification 5 -
B Create a plan for research 2 A
C Conducting a research 1 B
D Collect primary data 5 C
E Gathering if secondary data 2 C
F Analysis the data 5 D,E
G Find out the feasibility 3 F
H Findings 2 G
I Draw the conclusion 1 G,H
J Presentation of report 2 H, I
K Approval from board 5 G,H,I
L Apply decisions 3 J
Table 7 Network Diagram
Table 8 Gantt chart
Critical path = A+B+C+D+E+F+G+H+I+J+K+L
5+2+1+5+2+5+3+2+1+2+5+3
=36 weeks
11
decision support system in which they pass information to middle level managers or other
employees pertaining to a decision taken by them.
4.2 Prepare a project plan for an activity and determine the critical path
Task List of Activity Estimated time (Days) Preceding activity
A Problem identification 5 -
B Create a plan for research 2 A
C Conducting a research 1 B
D Collect primary data 5 C
E Gathering if secondary data 2 C
F Analysis the data 5 D,E
G Find out the feasibility 3 F
H Findings 2 G
I Draw the conclusion 1 G,H
J Presentation of report 2 H, I
K Approval from board 5 G,H,I
L Apply decisions 3 J
Table 7 Network Diagram
Table 8 Gantt chart
Critical path = A+B+C+D+E+F+G+H+I+J+K+L
5+2+1+5+2+5+3+2+1+2+5+3
=36 weeks
11
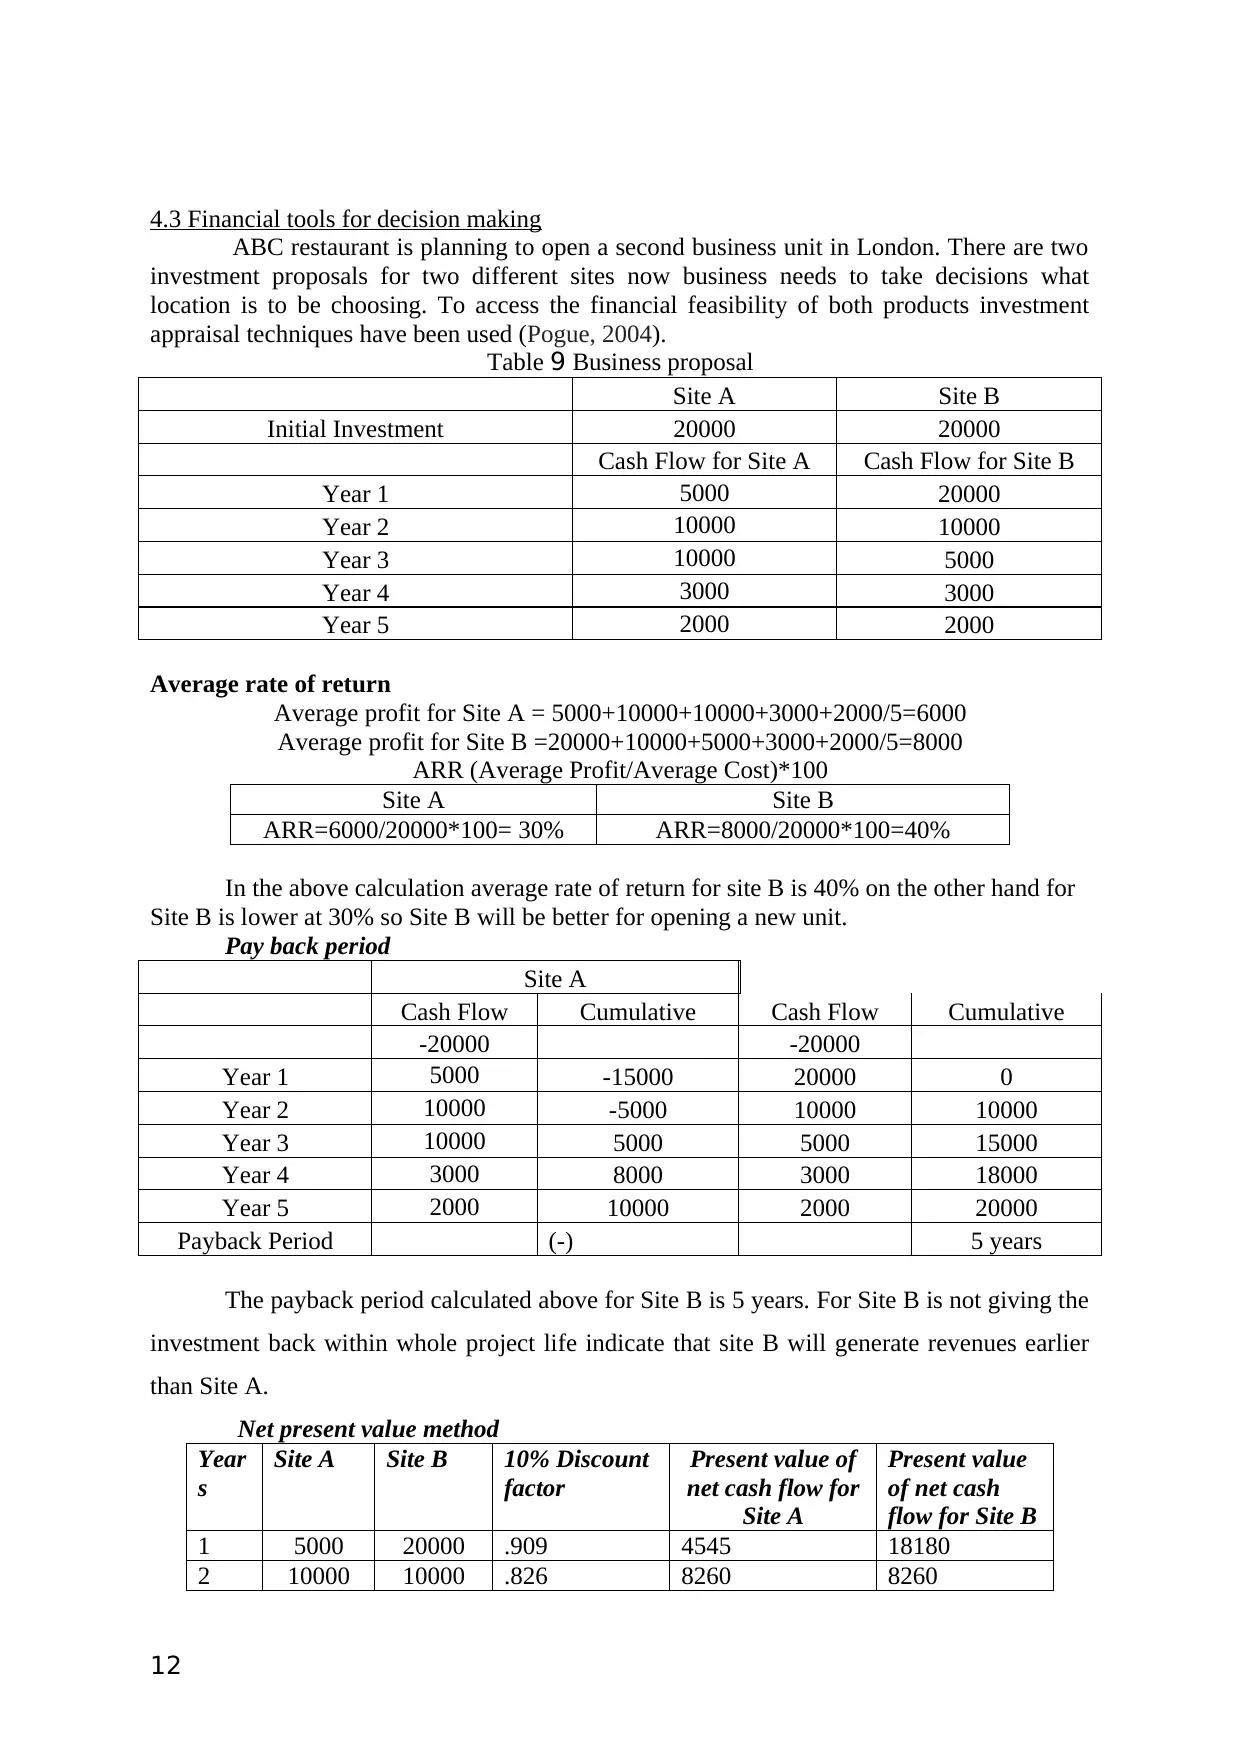
4.3 Financial tools for decision making
ABC restaurant is planning to open a second business unit in London. There are two
investment proposals for two different sites now business needs to take decisions what
location is to be choosing. To access the financial feasibility of both products investment
appraisal techniques have been used (Pogue, 2004).
Table 9 Business proposal
Site A Site B
Initial Investment 20000 20000
Cash Flow for Site A Cash Flow for Site B
Year 1 5000 20000
Year 2 10000 10000
Year 3 10000 5000
Year 4 3000 3000
Year 5 2000 2000
Average rate of return
Average profit for Site A = 5000+10000+10000+3000+2000/5=6000
Average profit for Site B =20000+10000+5000+3000+2000/5=8000
ARR (Average Profit/Average Cost)*100
Site A Site B
ARR=6000/20000*100= 30% ARR=8000/20000*100=40%
In the above calculation average rate of return for site B is 40% on the other hand for
Site B is lower at 30% so Site B will be better for opening a new unit.
Pay back period
Site A
Cash Flow Cumulative Cash Flow Cumulative
-20000 -20000
Year 1 5000 -15000 20000 0
Year 2 10000 -5000 10000 10000
Year 3 10000 5000 5000 15000
Year 4 3000 8000 3000 18000
Year 5 2000 10000 2000 20000
Payback Period (-) 5 years
The payback period calculated above for Site B is 5 years. For Site B is not giving the
investment back within whole project life indicate that site B will generate revenues earlier
than Site A.
Net present value method
Year
s
Site A Site B 10% Discount
factor
Present value of
net cash flow for
Site A
Present value
of net cash
flow for Site B
1 5000 20000 .909 4545 18180
2 10000 10000 .826 8260 8260
12
⊘ This is a preview!⊘
Do you want full access?
Subscribe today to unlock all pages.
Trusted by 1+ million students worldwide
1 out of 14
Related Documents


Your All-in-One AI-Powered Toolkit for Academic Success.
+13062052269
info@desklib.com
Available 24*7 on WhatsApp / Email
![[object Object]](/_next/static/media/star-bottom.7253800d.svg)
Unlock your academic potential
Copyright © 2020–2026 A2Z Services. All Rights Reserved. Developed and managed by ZUCOL.